Ethereum (ETH) has gone up by nearly 30% in the past 7 days after a massive short squeeze pushed the price past multiple key resistances.
The SEC’s proposed new rules for the crypto space and the Treasury Department’s announcement regarding a 2x increase in the amount of money spent on buybacks triggered a wave of short liquidations that made it to the top 10 largest wipeouts in history.
Ethereum spearheaded this move, as the top altcoin rose above the both psychologically and technically relevant $2,000 threshold — a price zone that we saw as the hurdle that ETH needed to overcome to put an end to its bear market.

Investors Have Poured $940M Into Ethereum ETFs in August
Wall Street piled into exchange-traded funds (ETFs) linked to ETH, pouring nearly $700 million into these vehicles just last week as sentiment shifted.
Data from SoSoValue now shows that Ethereum ETFs are having their best month since August 2025, as net inflows are nearing $940 million. In June last year, when net inflows exceeded $1 billion, we saw ETH climb from $2,500 to ultimately hit an all-time high during this latest bullish cycle.
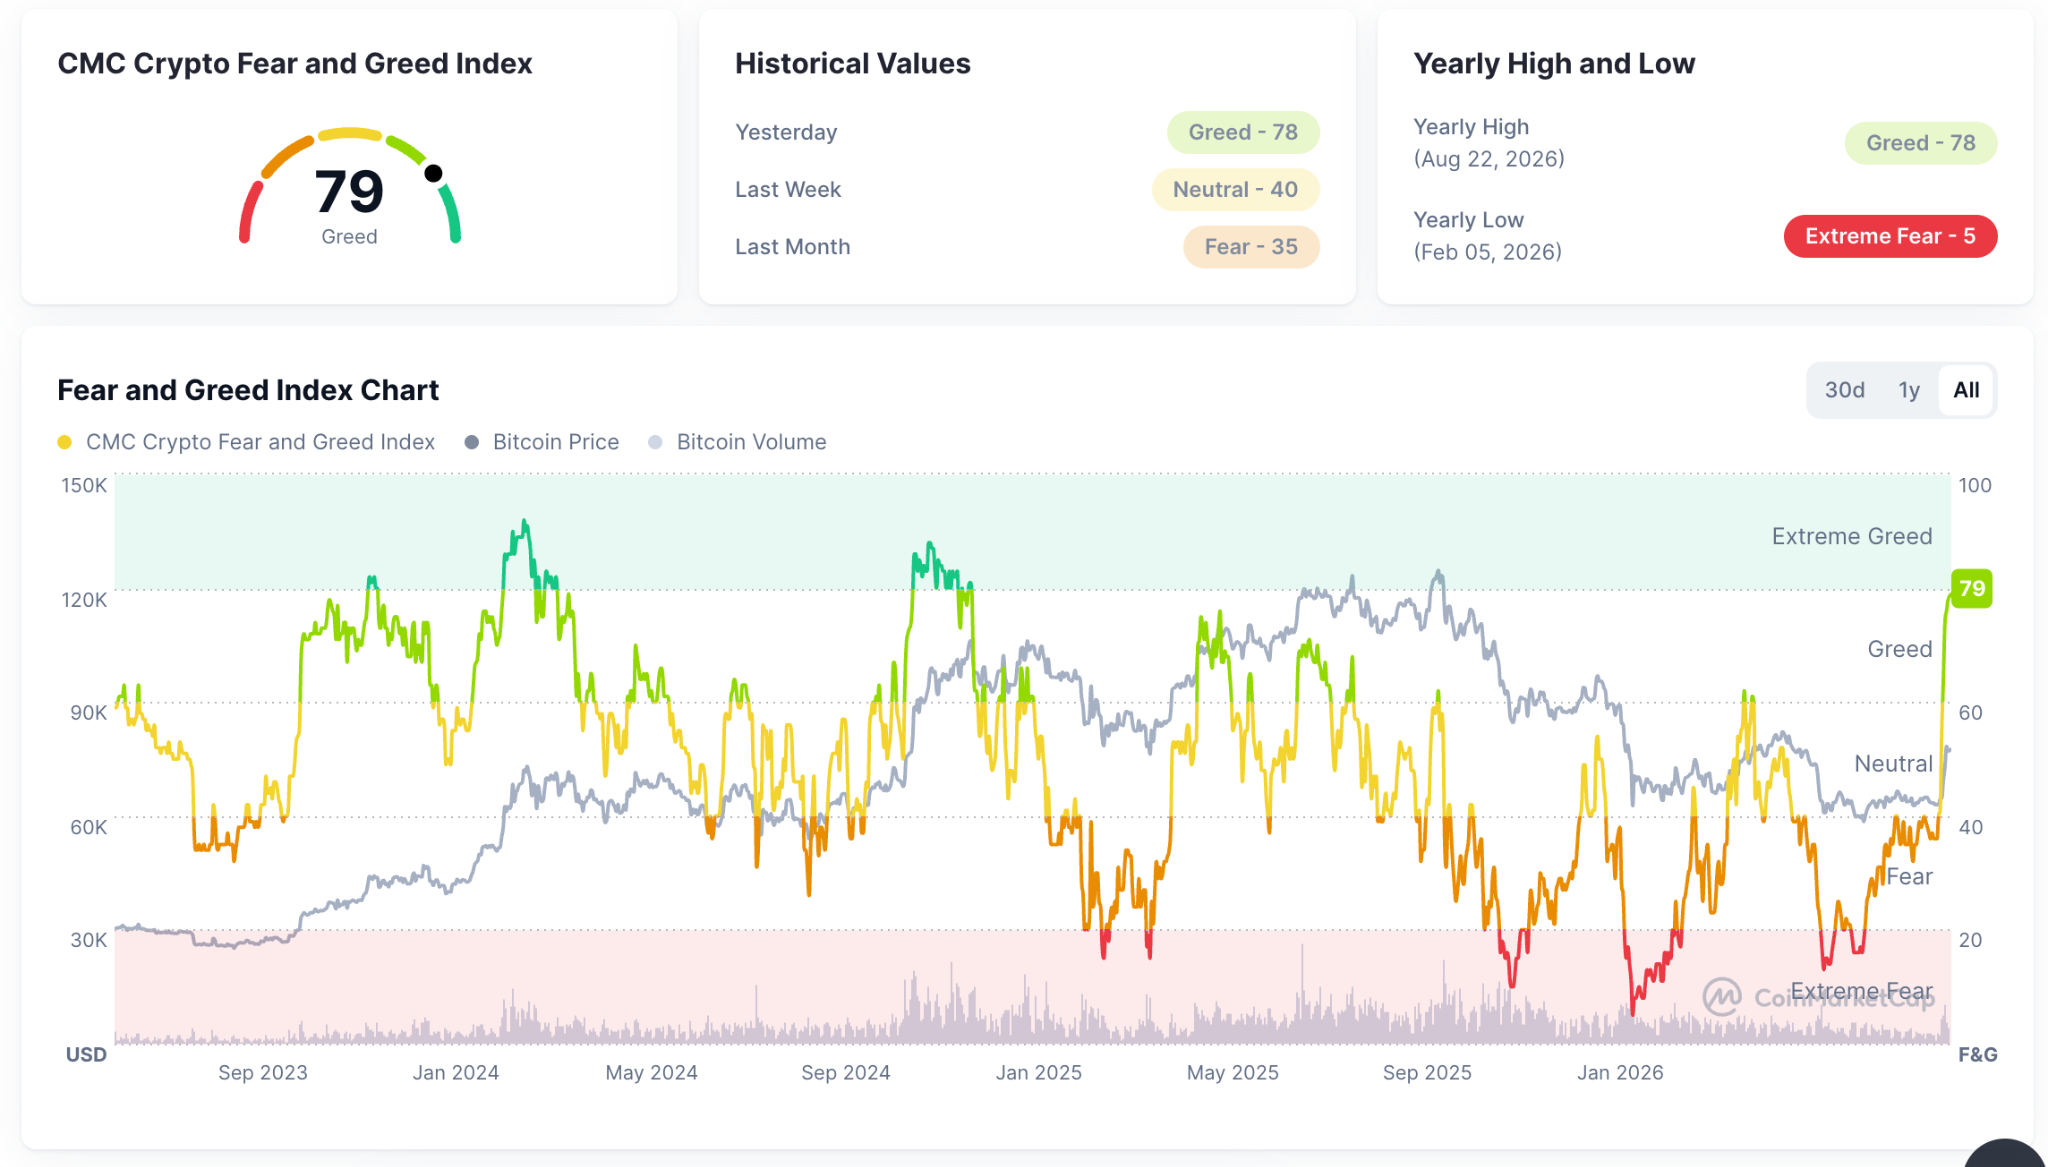
Market sentiment has improved dramatically as a result of this move, as reflected by the Crypto Fear and Greed Index. This gauge has stepped out of Neutral territory, from around 36 to 79 at the time of writing, already nearing “Extreme Greed” territory for the first time since December 2024.
Back then, we saw ETH rise to $4,000 at some point. Most technical indicators are pointing to what could be the early days of this token’s next bullish cycle, but we continue to monitor on-chain data for confirmation.
In this regard, trading volumes for ETH still need to go up a little bit further to match historical patterns. As per data from Santiment, we are still not seeing our moving averages for volumes crossing.
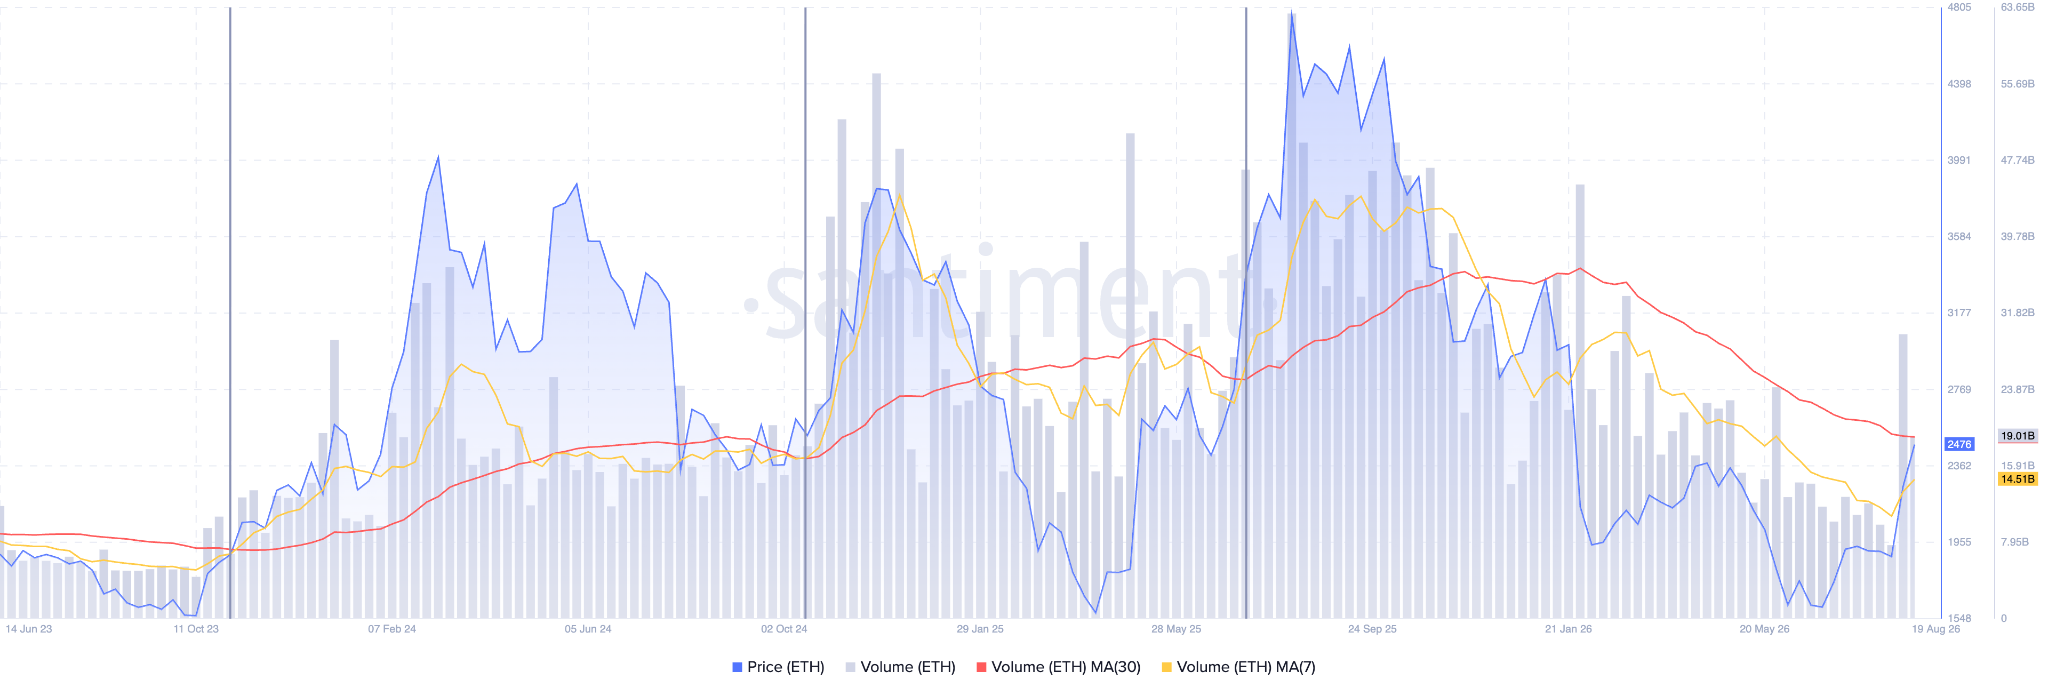
In three previous instances, whenever the 7-day and the 30-day moving averages have crossed, a bull market for ETH has started. The distance between these two MAs has shortened, but they are still apart.
This signal indicates growing momentum and increased buying pressure. We envision a move above the $2,750 area as the most likely catalyst for another significant jump in volumes, as FOMO could drive prices even higher.
Ethereum Price Forecast
Every new Ethereum analysis as it publishes, today's technical signal and key levels, live price — on one page.
See all Ethereum forecastsETH Could Jump by 34% If This Key Resistance is Broken
Turning to the daily chart, we can see how relevant this price zone has been in the past. This level has acted as both support and resistance, and we see it as ETH’s potential short-term ceiling in case of a pullback.
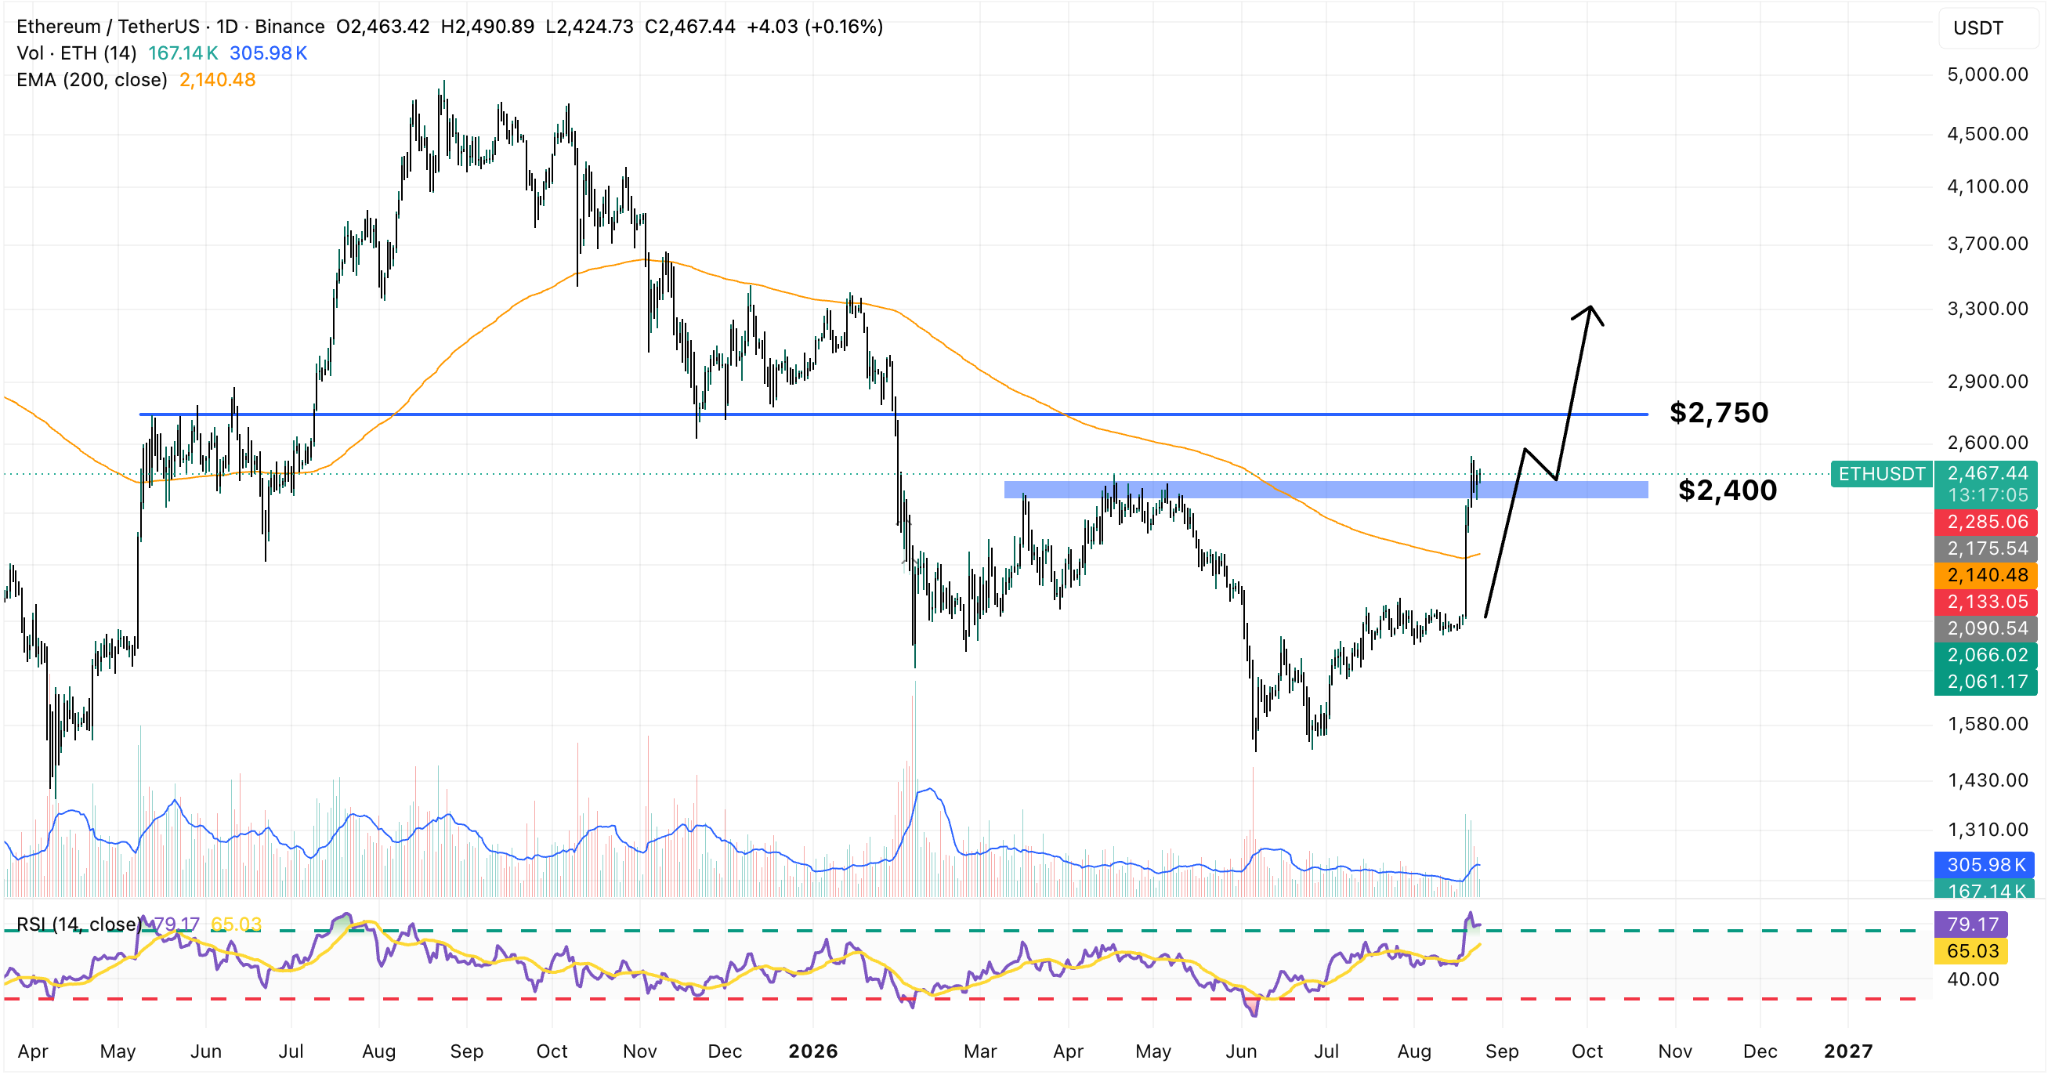
The Relative Strength Index (RSI) has surged to overbought territory at 79, meaning that the rally could be starting to get out of hand. This calls for a pullback, and the most likely landing zone if that happens should be the 200-day exponential moving average (EMA) at around $2,200.
Late buyers may benefit from this decline as that would give them the chance to open a long position at a more advantageous price point. However, if the price action breaks past the $2,750 mark, we envision a move to $3,300 for ETH in the near term, meaning a 34% upside potential.