



Ethereum (ETH) has jumped by 34% in the past 30 days, outpacing all other tokens in the top 5 during this period, after a couple of macro tailwinds.
The latest speech from the Chairman of the Federal Reserve, Kevin Warsh, during the Jackson Hole summit managed to pause the crypto rally but only temporarily, as most tokens have recovered during the weekend.
Trading volumes in the past 24 hours jumped by 39%, currently sitting at nearly $9 billion. This figure accounts for nearly 3% of the asset’s circulating market cap, indicating that the buying interest has subsided a bit.
Market sentiment improved dramatically in the past couple of weeks after the U.S. Securities and Exchange Commission (SEC) proposed a new set of rules for the crypto industry that front-run Congress’s expected approval of the Clarity Act.
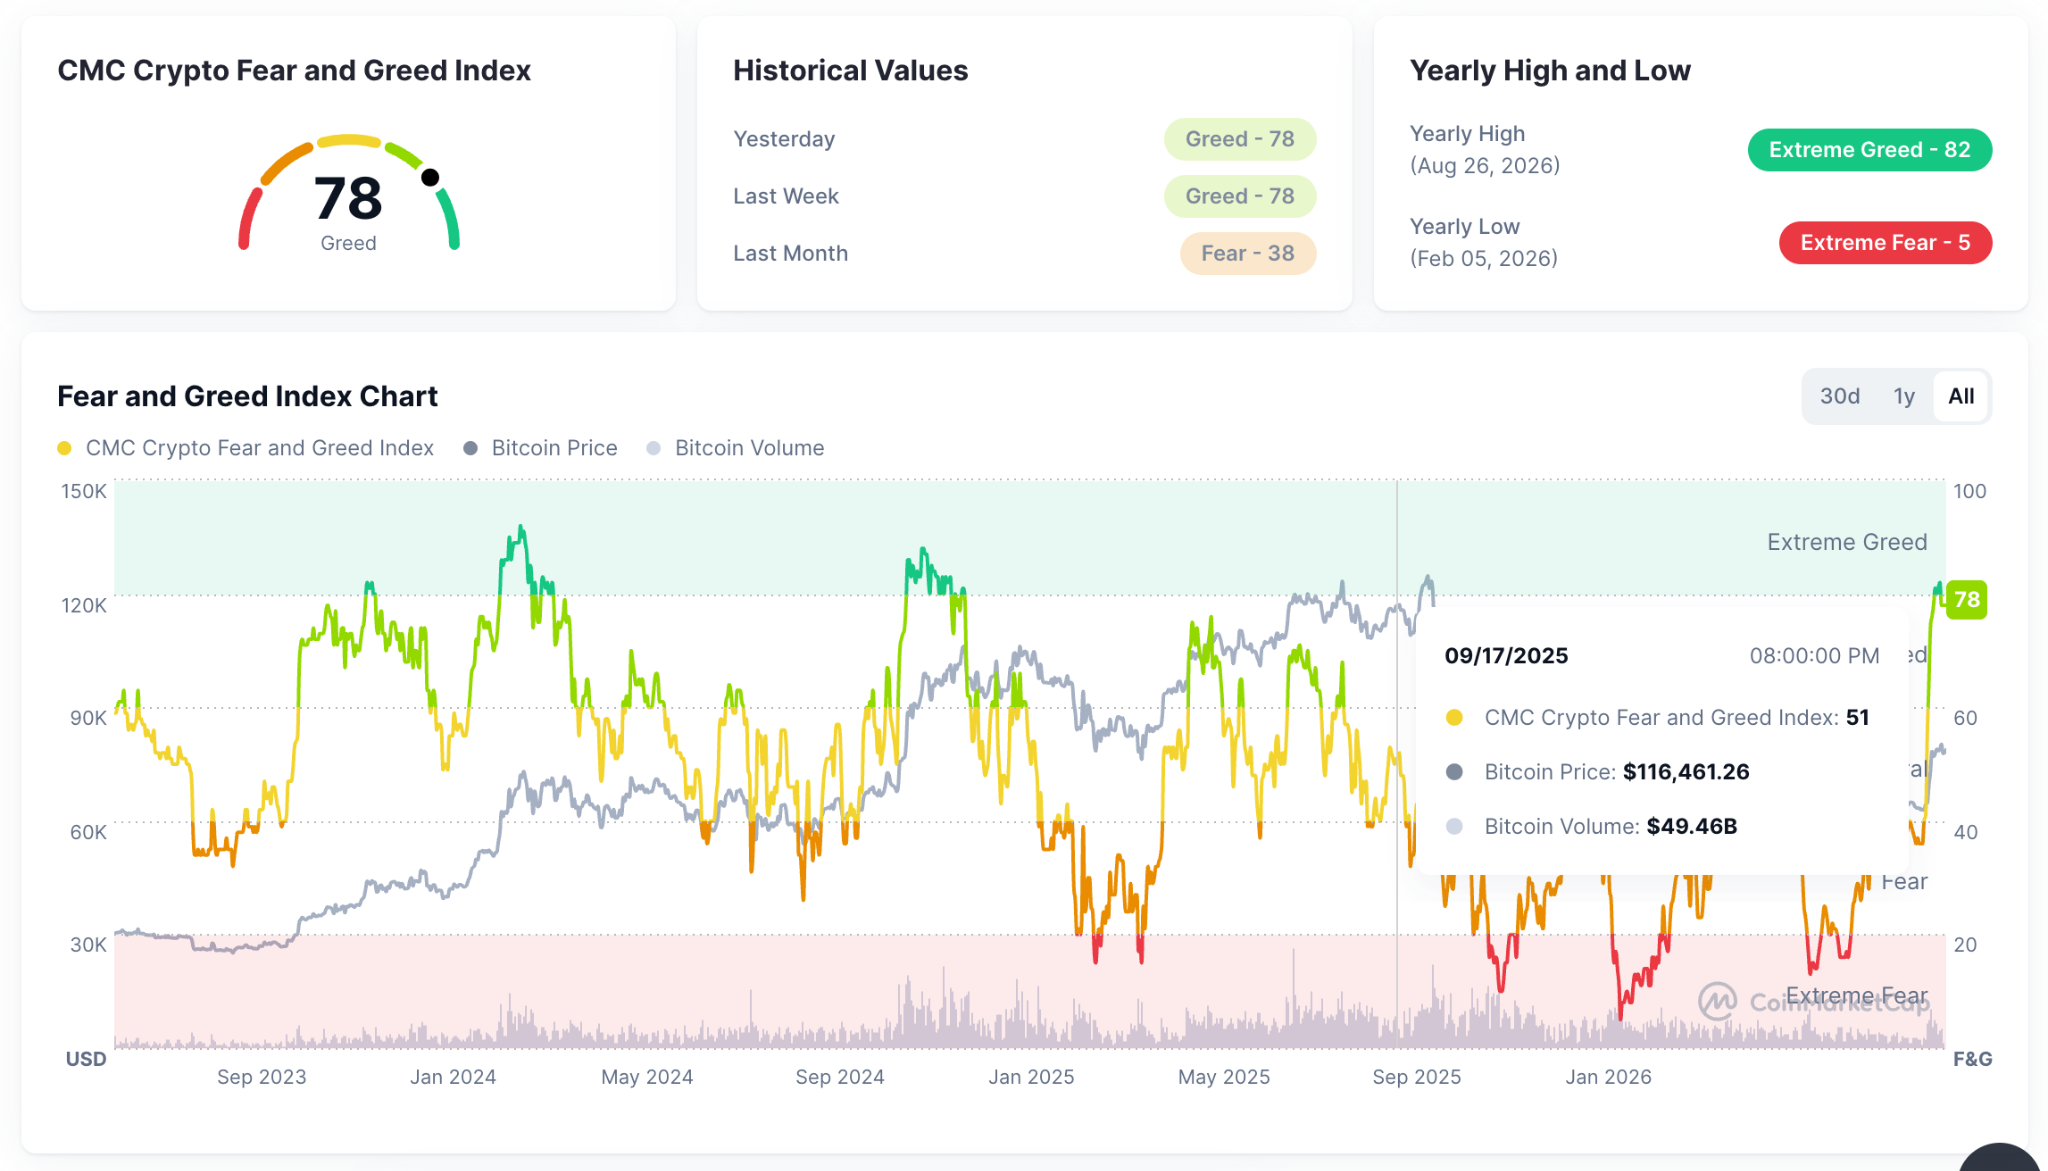
The Crypto Fear and Greed Index has jumped to 78, indicating that investors are in “Greed” mode. This is the highest reading since December 2024, back when the ETH was rallying to $4,000.
Moreover, the U.S. Treasury Department announced that they will double the amount of buybacks in the bond market.
This injects additional liquidity to the system, and the crypto market appears to have greeted the news as most tokens climbed above their 200-day exponential moving average (EMA), which theoretically marks the end of this bear market.
Ethereum MRVR Ratio is About to Flash a Strong Buy Signal
Turning to on-chain metrics, one data point in particular has improved dramatically in the past couple of weeks.
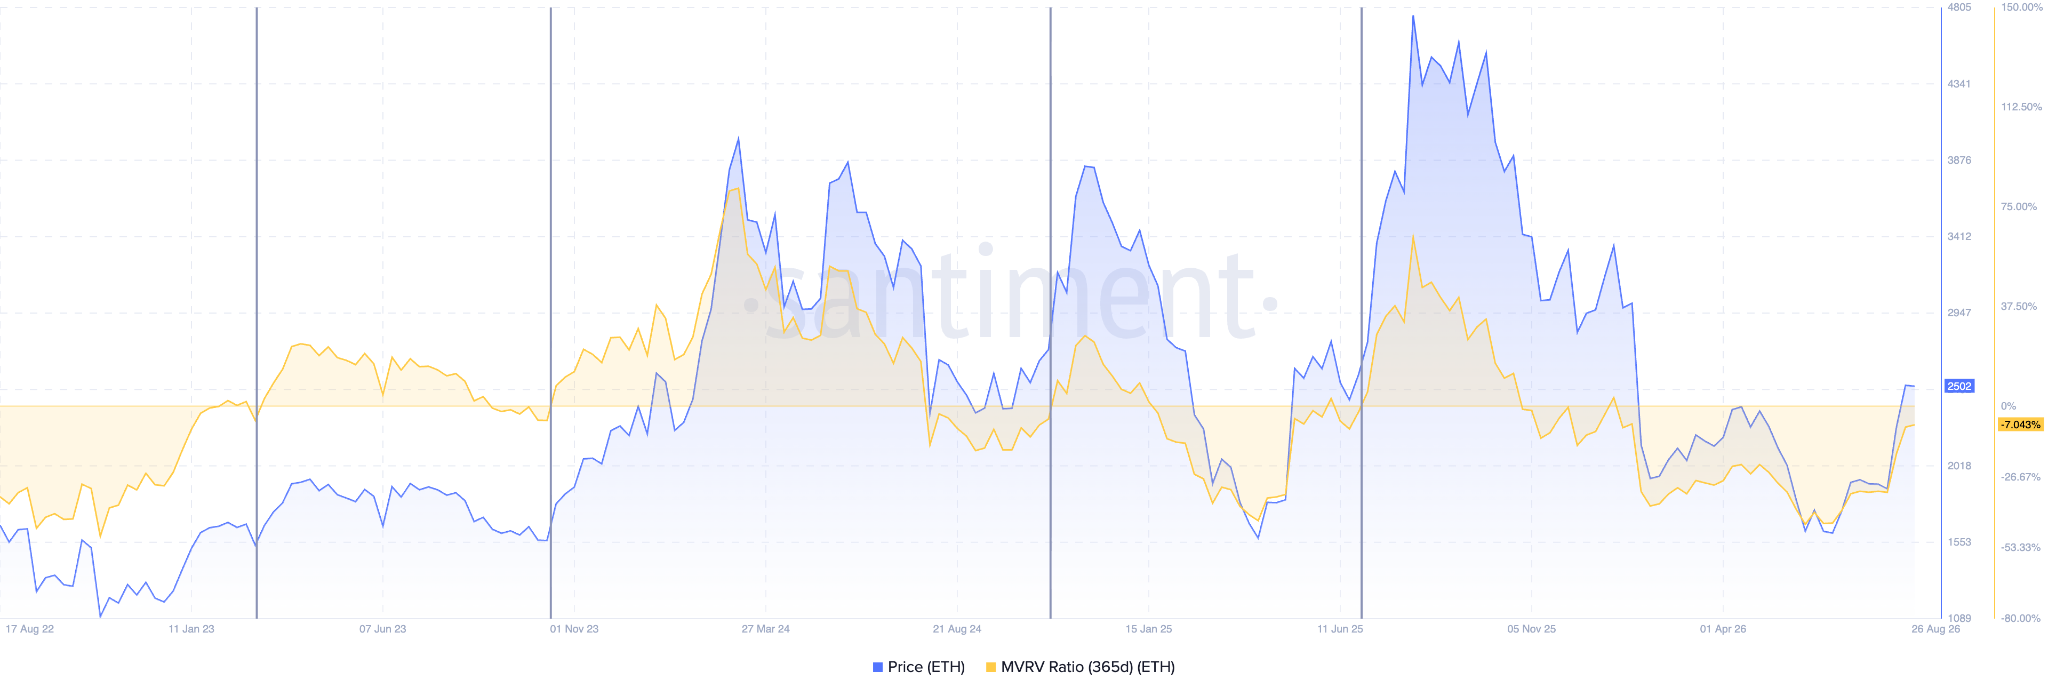
According to data from Santiment, the MVRV Ratio has trimmed its negative value from -45% to -7% at the time of writing. In at least 4 out of the last 5 instances that this metric has jumped above the zero line, that has marked the beginning of a bull market for ETH.
In the current scenario, we may see this happening if ETH climbs past $2,800, which is a near-term target for the token.
This bullish outlook is consistent with a buy signal in the weekly chart associated with the Relative Strength Index (RSI). In this higher time frame, whenever the oscillator drops to 30 and recovers, that has also market the cycle bottom for Ethereum.
This has already happened, and we could now witness a strong rally in the next 6 to 12 months that could push ETH to $5,000 for the first time in history.
Ethereum Price Forecast
Every new Ethereum analysis as it publishes, today's technical signal and key levels, live price — on one page.
See all Ethereum forecastsETH Next Stop Could Be $2,800 Once the Rally Resumes
The daily chart shows that ETH just broke past a key resistance at $2,400 just days after the token rose above the 200-day EMA.
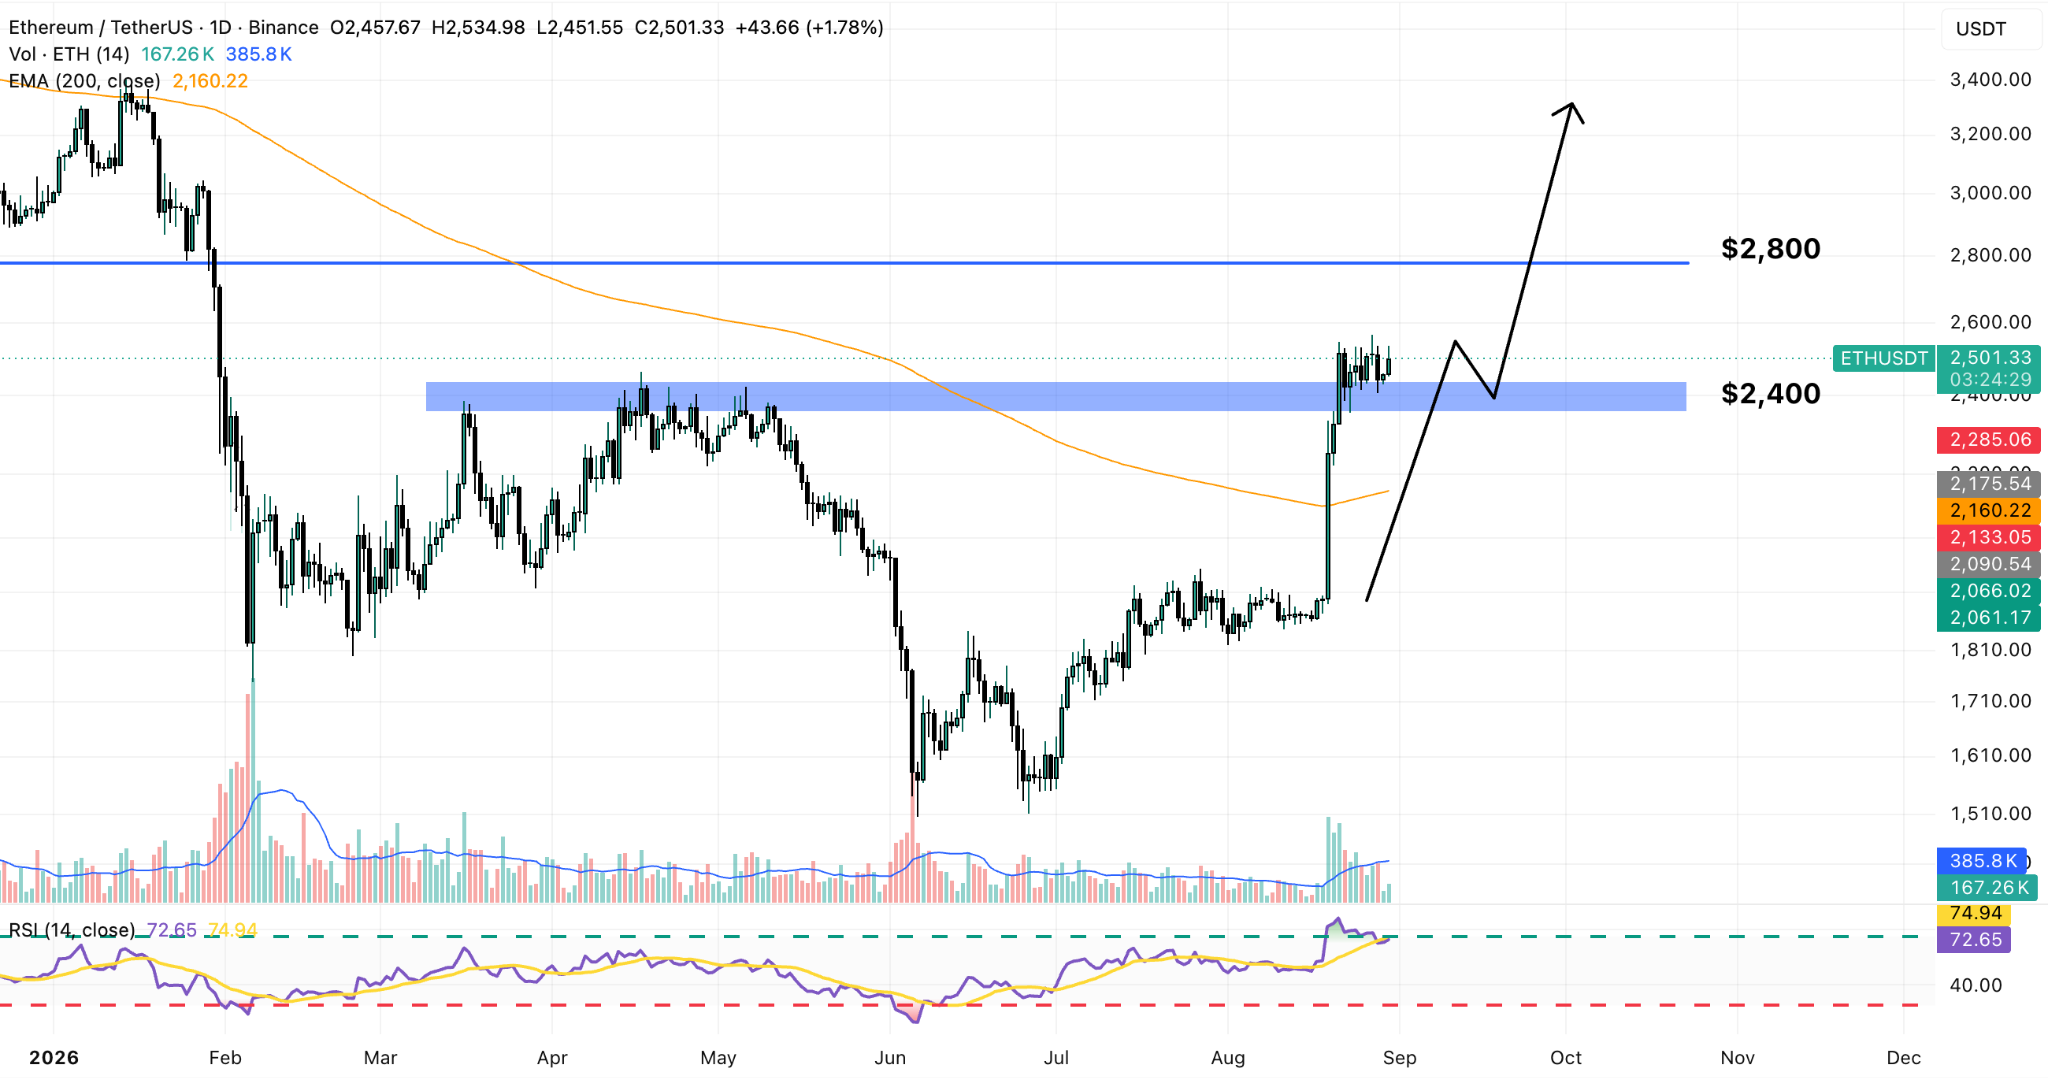
The latter is a relevant technical indicators that a large group of traders tend to follow to determine if an asset is on an uptrend or a downtrend.
ETH could continue to rise $2,800 after this bullish breakout. This means a 12% upside potential. The token appears to have entered a phase of consolidation as early buyers cash out of their early bets and late buyers start to position for the continuation of this uptrend.
We could expect a liquidity grab at around $2,300 – $2,400 before the next leg up. However, the baseline scenario continues to be bullish.