New Pipeline Gives Sellers One More Reason to Press Below $3.00
Natural gas sold off Friday with Energy Transfer’s Hugh Brinson pipeline set to start moving Permian gas on September 1. The market is not waiting for the line to fill. Production is running above last year, the rig count just climbed to a five-month high and storage is tracking well above normal heading into autumn. The 50-day moving average rejected Thursday’s spike and sellers were back in control on Friday. Heat across the southern two-thirds of the country is keeping this from turning into a washout. The break below $3.00 is holding.
October Nymex natural gas settled at $2.862, down $0.026, or 0.89%.

Daily October Natural Gas Technical Analysis
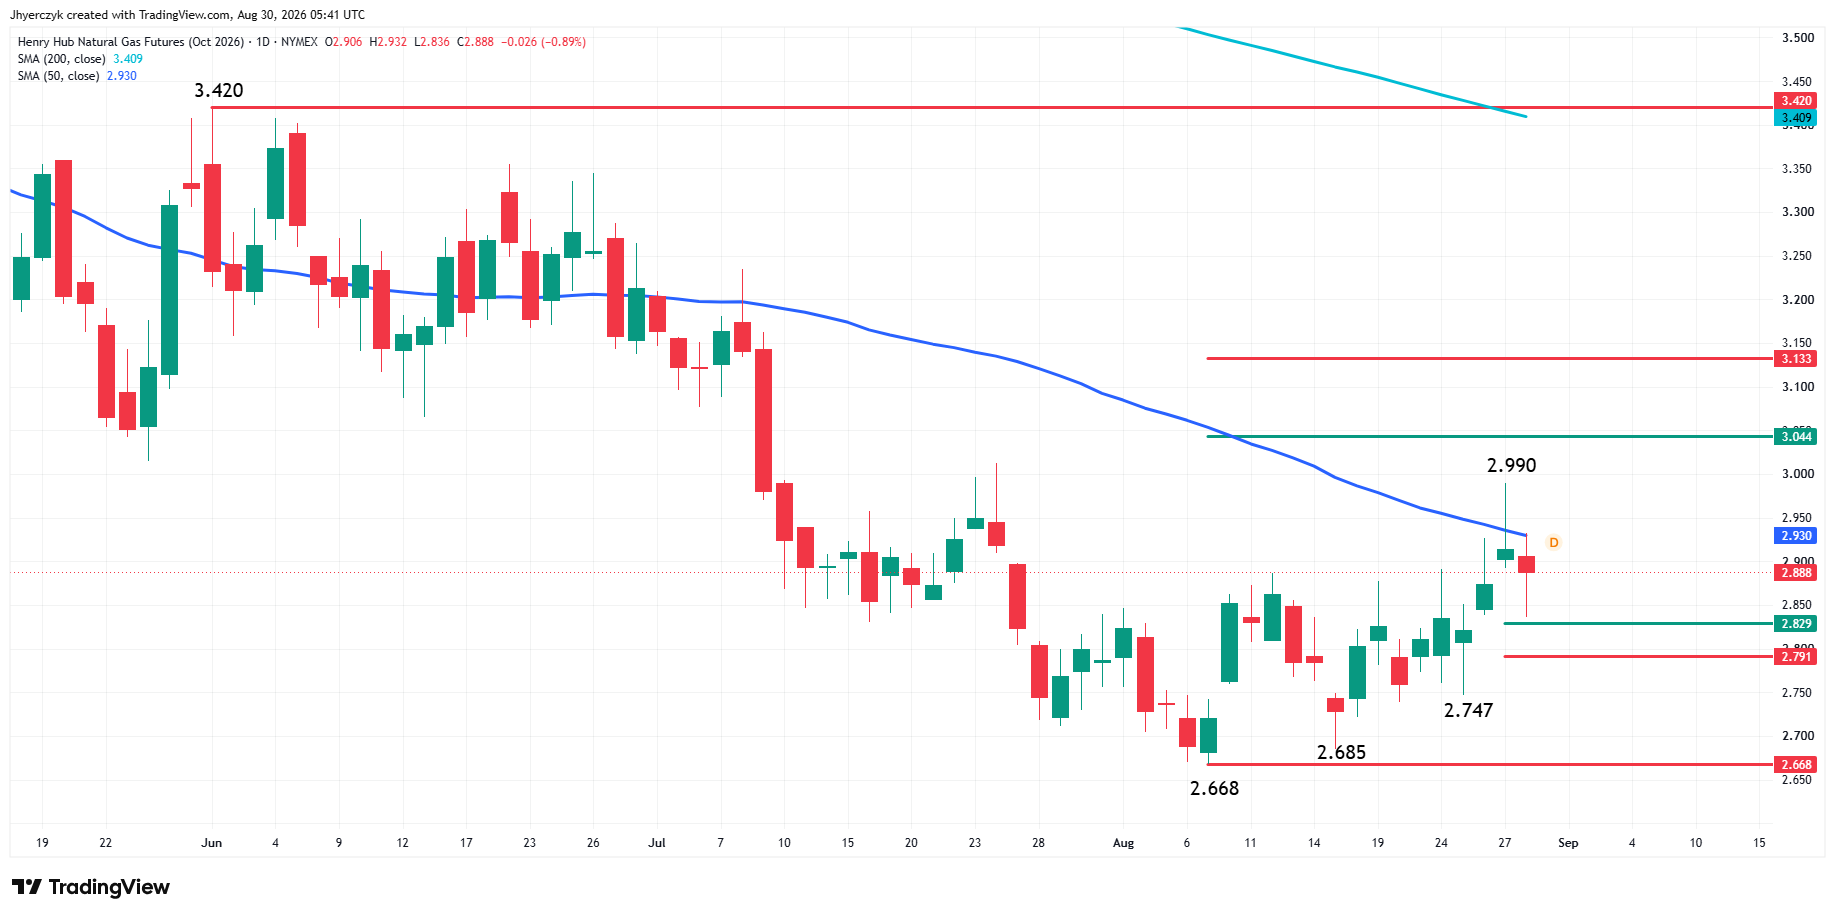
October natural gas futures sold off on Friday after getting rejected by the 50-day moving average at $2.930. On Thursday, the market spiked through the 50-day MA to $2.990, but couldn’t hold on to most of those gains, settling at $2.914.
The price action indicates that trader reaction to the 50-day MA is likely to determine the near-term direction on the daily chart.
A sustained move over the 50-day MA is likely to indicate the presence of buyers. If this creates enough upside momentum, then look for a drive through $2.990 and into the intermediate 50% to 61.8% retracement zone at $3.044 to $3.133.
A sustained move under the 50-day MA is likely to signal the presence of sellers. The new short-term range is $2.668 to $2.990. Its retracement zone at $2.829 to $2.791 is the primary downside target. If $2.791 fails to hold, then we could see a labored break with potential targets at the main bottoms of $2.747, $2.685 and $2.668.
Natural Gas Price Forecast
Every new Natural Gas analysis as it publishes, today's technical signal and key levels, live price — on one page.
See all Natural Gas forecastsThe Supply Side Did Not Need Another Pipeline
Natural gas production was already running well above last year before the Hugh Brinson project showed up on the calendar. The pipeline adds about 2.2 billion cubic feet per day of capacity from the Permian Basin to East Texas, giving Permian producers another route toward Erath, Louisiana, near the Henry Hub delivery point. The line starts September 1. Traders started pricing the additional supply before the first molecule moved.
Lower 48 dry gas production is running at 113.0 bcf per day, up 4.5% from a year ago according to BNEF. Baker Hughes reported the U.S. gas rig count rose by five last week to 132. That is a five-month high, just below February’s three-year high of 134. Producers are not backing off even with Henry Hub below $3.00. The new pipeline gives them another outlet and gives sellers another reason to lean on this market.
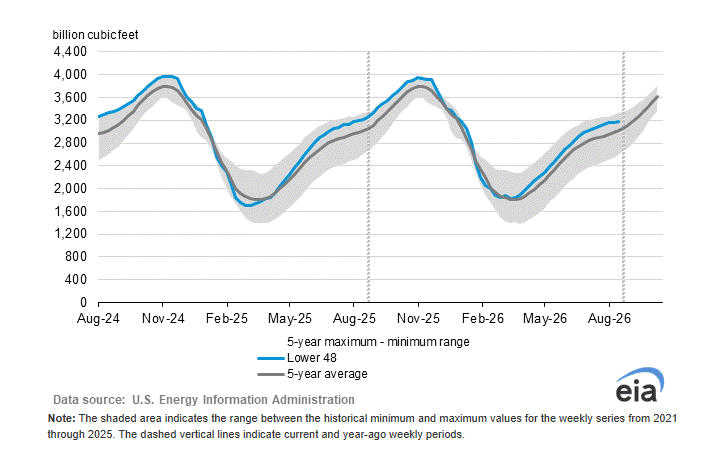
Storage makes the case even harder for the bulls. The EIA expects U.S. inventories to hit 3,985 bcf at the end of October. That would be the highest October level in 10 years and about 5% above the five-year average. As of August 21, storage was 5.5% above the five-year seasonal average. A separate EIA measure put the surplus at 6.7% above normal. The weekly numbers bounce around. The surplus does not.
Heat and LNG Flows Are Holding a Floor, Not Building a Rally
The September forecast saved the bulls from a worse session Friday. NatGasWeather has the southern two-thirds of the country staying hot to very hot through September 2. Highs between the 90s and 110s. Texas and ERCOT near 100 degrees. That is not a mild finish to summer. The Commodity Weather Group picks up where that forecast ends, calling for above-average temperatures across the eastern two-thirds from September 2 through September 11. Power generators are going to keep pulling gas well past the point where cooling demand normally fades.
Lower 48 gas demand hit 78.9 bcf per day Friday, up 8.2% from a year ago. The Edison Electric Institute said lower-48 power generation rose 6.1% year over year in the week ended August 22, reaching 100,895 gigawatt hours. Output over the past 52 weeks was up 2.2%. The burn rate is there. It is also fighting a supply side that keeps adding capacity.
LNG export flows reached 19.5 bcf per day Friday, up 10% from the prior week. The EIA expects U.S. LNG exports to average 16.5 bcf per day in the third quarter. That forecast was lowered from the prior month on ongoing maintenance at Freeport LNG. Reduced feedgas into export terminals leaves more gas sitting in domestic storage, particularly in the South Central region. Longer term, exports should rise through 2027 as Mexico’s Energia Costa Azul terminal begins operations and pipeline flows to Mexico increase. Near term, Freeport downtime and a new Texas pipeline are working against the demand story.
European gas storage stood at 64% full as of August 25, below the five-year seasonal average of 81%. Less cushion than normal across the Atlantic. U.S. gas prices are still being set by domestic production, storage and weather.
What to Watch
The Hugh Brinson pipeline starts September 1 and production is already at multi-year highs with the rig count still climbing. Storage builds are on pace to reach the highest October level in a decade and Freeport maintenance is keeping LNG feedgas below full strength.
The EIA has Henry Hub averaging $2.87 per MMBtu in the third quarter. That number looks generous with a new pipeline adding 2.2 bcf per day of Permian capacity into the system.
September heat is the only thing standing between this market and a faster slide into the shoulder season. If the forecasts for 90s to 110s across the southern two-thirds hold through the first week of September, power burns can keep gas near these levels. The moment that heat breaks, the floor gets a lot harder to defend.
The 50-day moving average rejected Thursday’s spike and sellers came right back Friday. The supply story and the chart are lined up. A break below the retracement zone opens room back toward the contract lows.
More Information in our Economic Calendar.