


Silver Took a Harder Hit Than Gold and the Industrial Side Made It Worse
Spot silver dropped more than 4% Friday after Fed Chair Kevin Warsh told Jackson Hole the Fed is not done. The metal fell from $65.29 at the opening to $62.27 by late afternoon. Gold lost 3% on the same speech. Silver losing more than 4% tells you something beyond the rate trade is working against it.
The 50-day moving average is still a long way below and the 200-day is now overhead resistance.
On Friday, Spot Silver (XAGUSD) settled at $62.49, down $2.72 or 4.17%.
Daily Spot Silver (XAGUSD) Technical Analysis
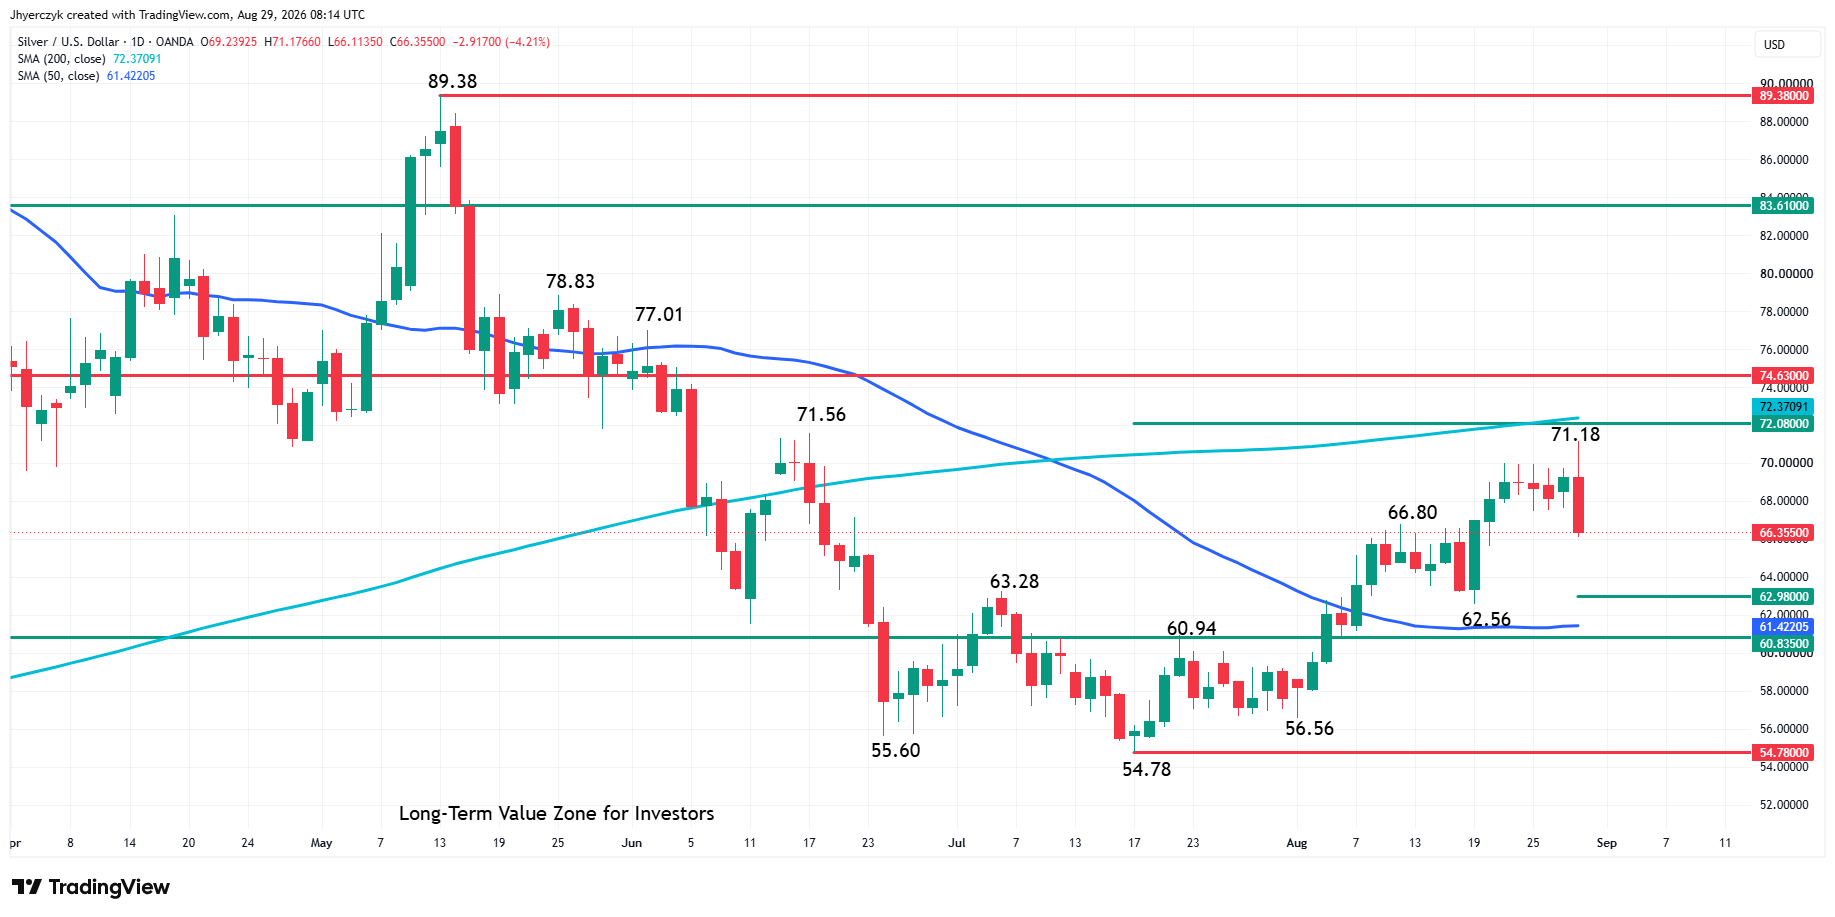
Spot silver finished sharply lower on Friday after giving up early gains. Shortly after the opening, the market surged to $71.18, its highest level since June 17. The rally fell short of an intermediate 50% level at $72.08 and the elusive 200-day moving average at $72.37. Both levels are resistance.
The main range is $54.78 to $71.18. Its 50% level at $62.98 is the primary downside target. This is followed by a short-term main bottom at $62.56 and the 50-day moving average.
50% of the all-time high is $60.835. It is a major long-term support level.
The main trend is up, but momentum shifted to the downside on Friday with the formation of a potentially bearish closing price reversal top. This chart pattern typically leads to a 2 to 3 day correction.
Silver Price Forecast
Every new Silver analysis as it publishes, today's technical signal and key levels, live price — on one page.
See all Silver forecastsThe 2-Year Yield Jumped and the Dollar Followed Warsh Higher
Warsh said the Fed will have work to do if policymakers are not confident underlying inflation is returning to target. He said financial conditions do not appear restrictive. No forward guidance. No list of triggers before September 16.
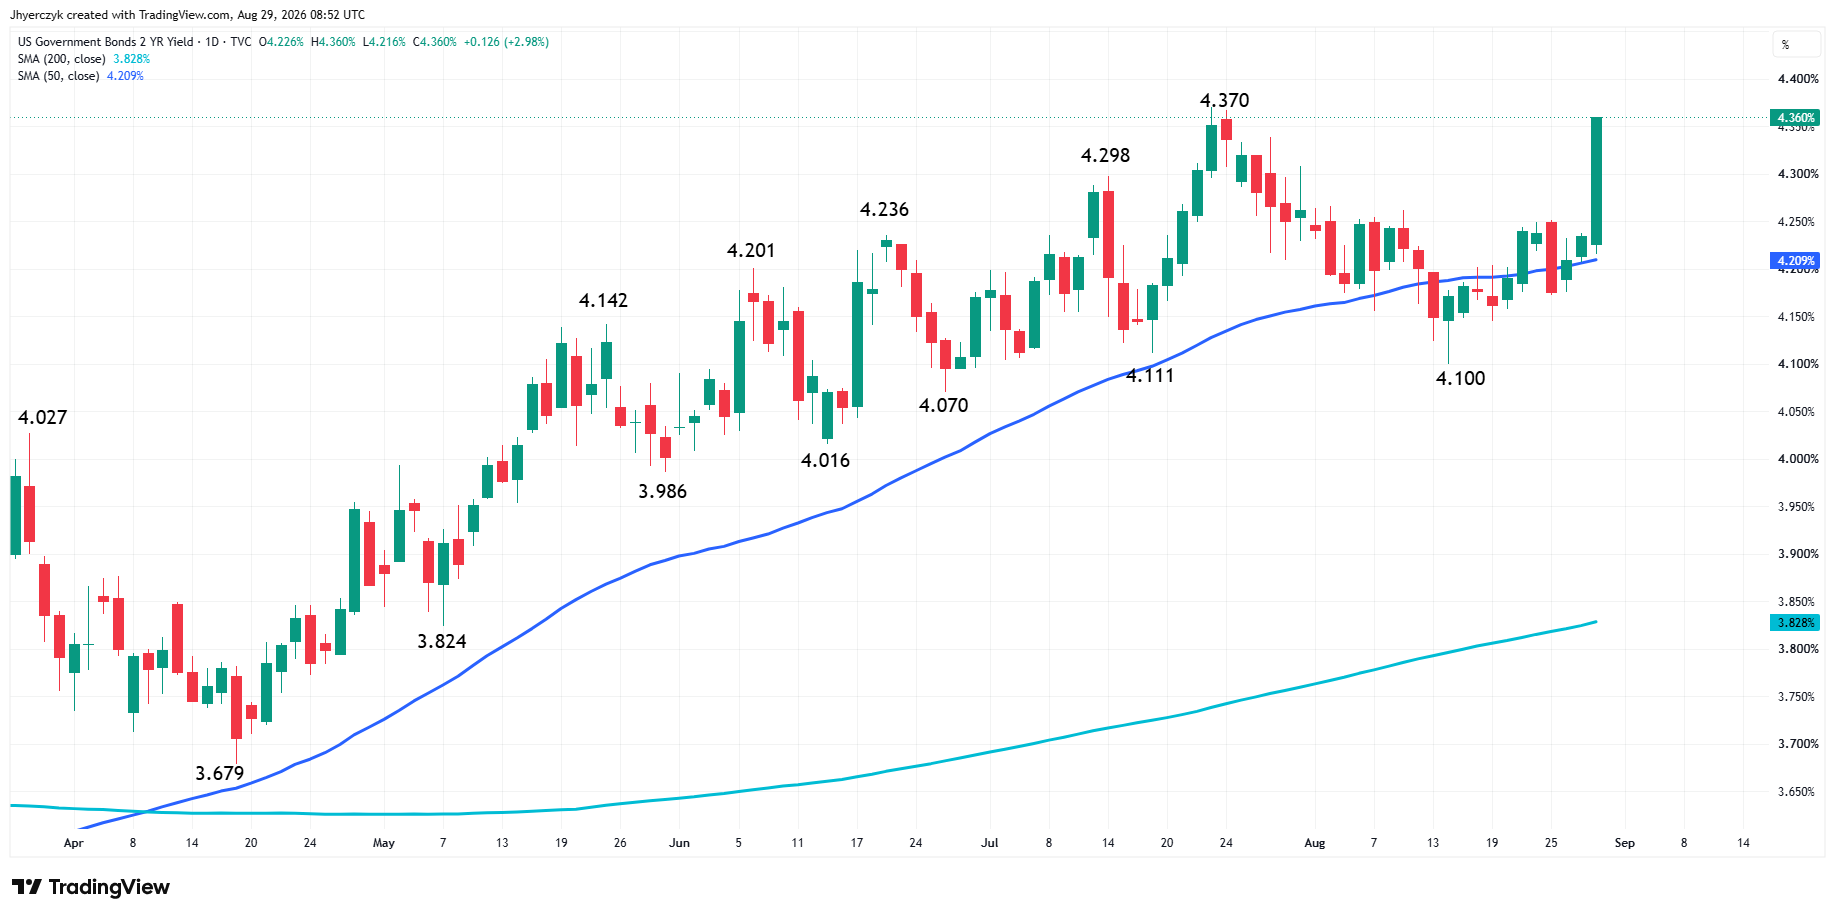
The 2-year yield surged more than 10 basis points to 4.35%, its highest since late July. The dollar index rose 0.56% to 99.688 and hit its best level since August 19, reclaiming the 200-day moving average at 99.160. Fed funds futures repriced September hike odds from 35.4% to 57.5% inside one session.
Silver was already struggling to hold above $64 before the speech. The yield move pushed the dollar through resistance and silver went with it. The metal dropped $3 from the session high to the session low in a few hours. The speed of the move says the long side was not positioned for Warsh to come in that hard.
Silver’s Industrial Exposure Compounds What the Rate Trade Started
Gold lost 3% on the same session. Silver lost more than 4%. The difference is industrial demand. Silver goes into solar panels, electronics, automotive components and industrial applications. Higher rates slow business spending. A hawkish Fed chair making September live again is not just a currency trade for silver. It reaches the manufacturing and construction side of demand at the same time.
The weekly loss for silver was 3.78%. Gold lost 1.58%. That spread widened Friday after narrowing earlier in the week when both metals rallied on the Treasury buyback announcement. The buyback trade lifted silver and gold together. The Warsh trade hit silver harder. The metal that rallied on financial demand gave back less. The metal that needs both financial and industrial demand gave back more.
India’s gold discounts widened this week as physical demand softened on speculation about an import duty rollback. Silver follows gold into the physical market in Asia. Weaker regional demand arriving on the same Friday as a hawkish Fed speech and a surging dollar removed support from underneath both metals at the same time.
What to Watch
Silver enters the weekend with the worst weekly loss since mid-July and the rate trade working against both sides of its demand. The 2-year yield at 4.35% and September hike odds at 57.5% are the numbers that matter heading into the September 16 meeting. Employment and inflation data before that date carry more weight now than they did before Warsh spoke. The Treasury buyback rally gave silver a bid last week. Warsh took it back and added the industrial demand question on top of it.
Silver broke through its retracement zone at $63.96 to $62.87 on the session and found some support near the lower boundary. The 50-day moving average at $61.18 and the long-term 50% level at $60.835 are the next targets if selling continues. The 200-day moving average at $71.51 is now overhead resistance. The gap between the current price and the 200-day tells you how much ground buyers lost this week.
More Information in our Economic Calendar.


