


200-Day Break Leaves Nearby Supports Exposed
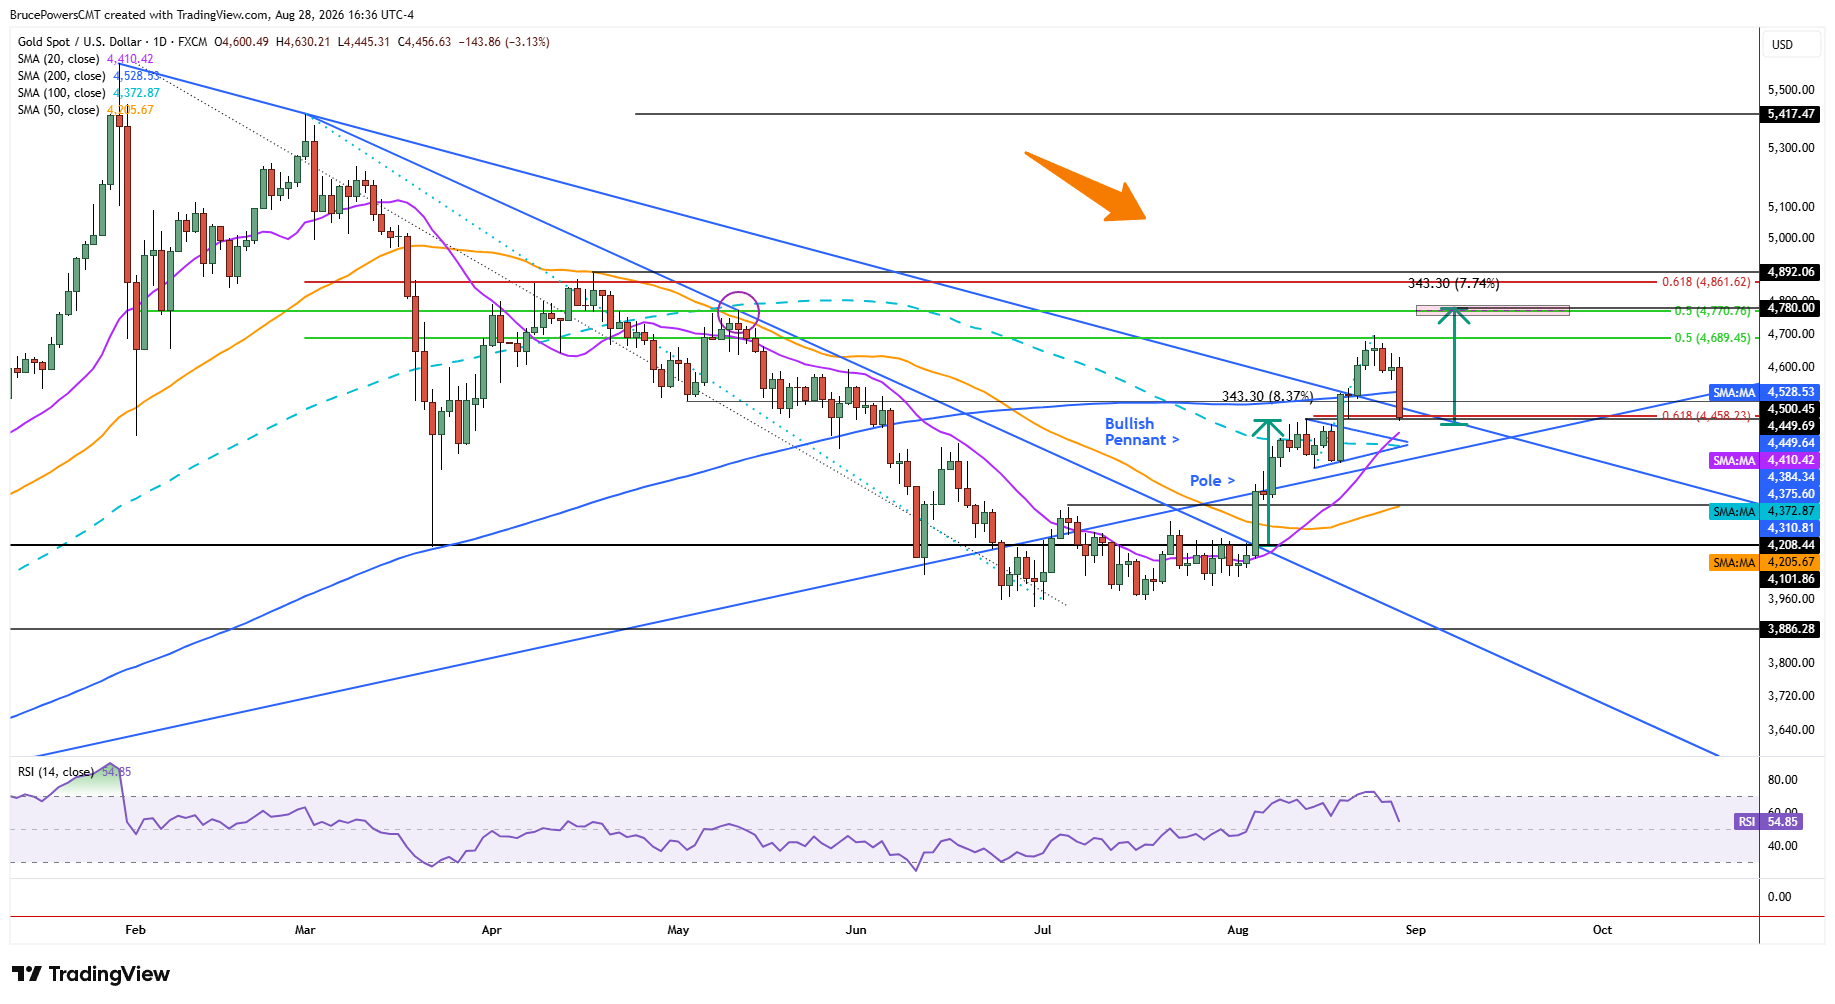
Sellers took control on Friday after gold lost the 200-day moving average, driving the session into a 61.8% Fibonacci retracement of the prior upswing. The session low of $4,445 breached potential support near the prior trend high of $4,450. Trading remains near the session lows at the time of writing, so that $4,445 may not be the low. Just beneath it, the rising 20-day moving average near $4,410 stands out as a potentially significant support area that could decide whether the decline stays corrective.
August 5 Bounce Makes 20-Day the Pivot
From a timing standpoint, the 20-day moving average is rapidly approaching price, so the current pullback may not finish until that average is reached. On the bullish reversal breakout day of August 5, support at the 20-day average was successfully tested at the low of the day. That test launched a rally off the bottom that carried to Tuesday’s trend high of $4,697 and completed a 50% retracement of the prior internal decline that followed the January peak of $5,597. A pullback that tests support near the 20-day moving average before bullish momentum returns would therefore be typical price behavior in a developing uptrend.
Reclaim Near $4,529 Keeps $4,780 Target Alive
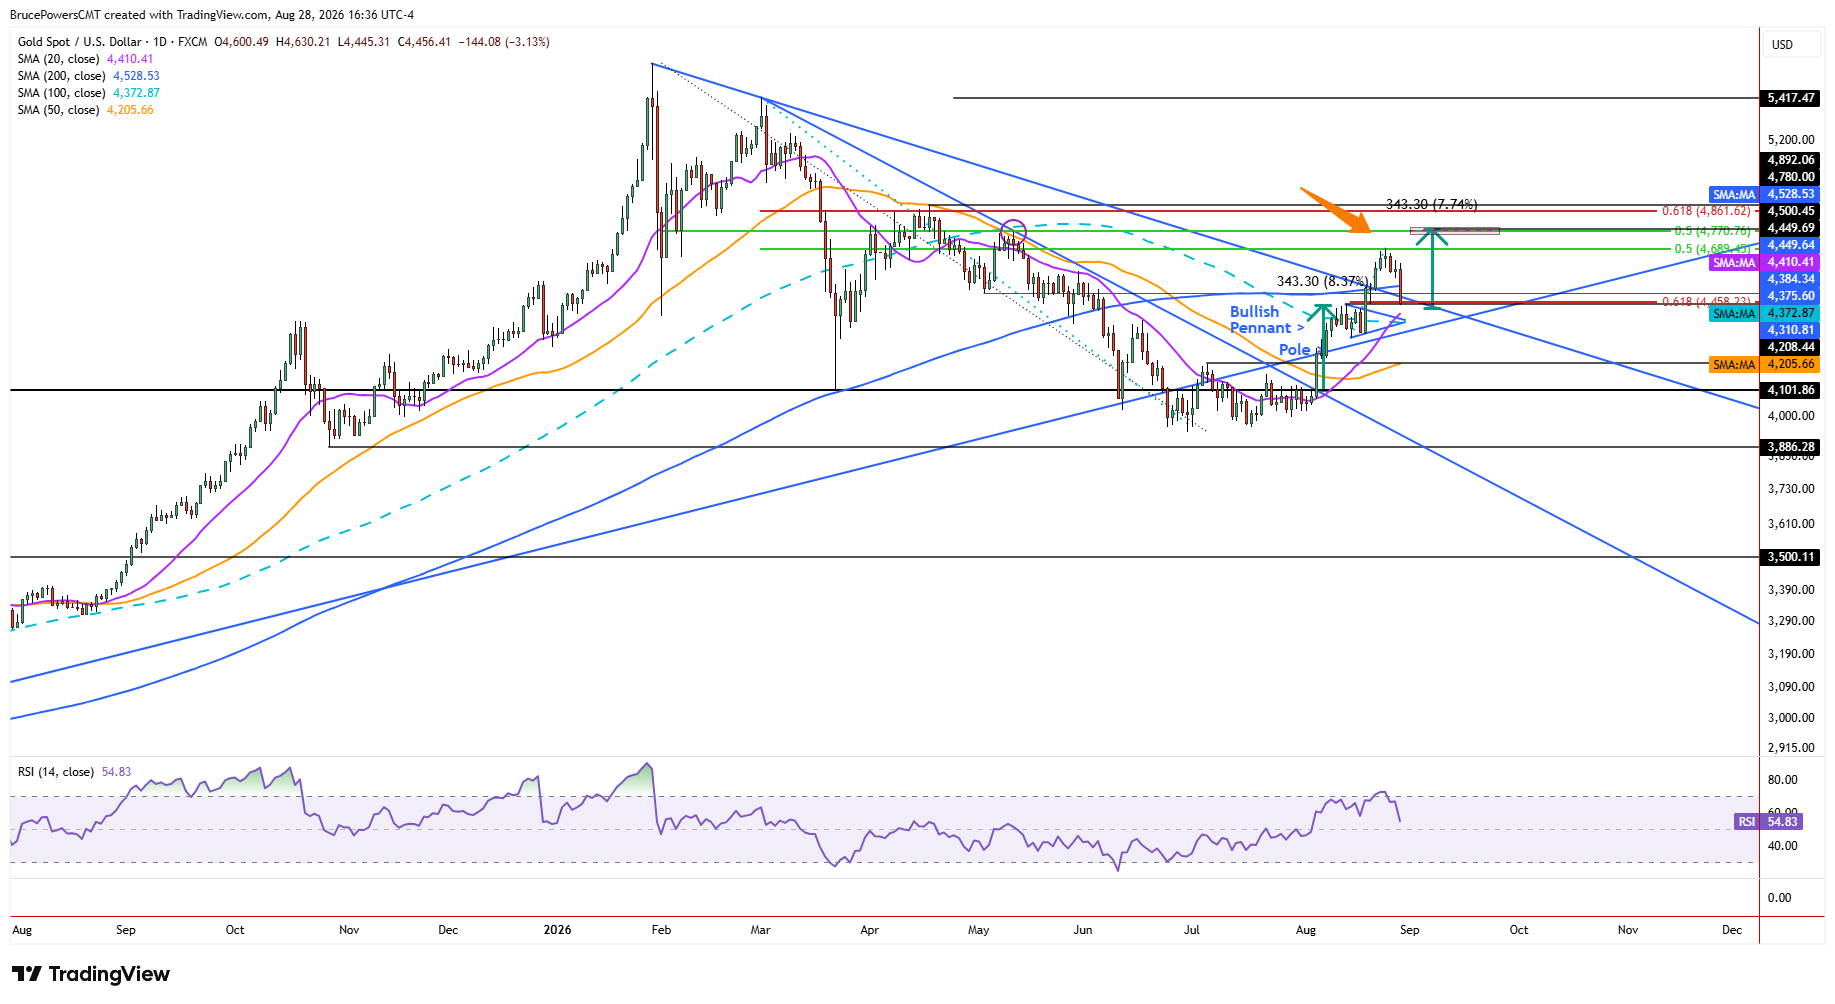
The ability to reclaim the 200-day moving average after this pullback, currently near $4,529, would be a key sign of strengthening and could open the way for sustainable bullish momentum and a third leg higher off the bottom. Until then, gold may remain under pressure from sellers as it tests these support levels and works off momentum from Friday’s breakdown.
A measured move from the recent breakout of a bullish pennant pattern points to $4,780. That target is reinforced by the 50% retracement of the full decline from the January peak and a prior lower swing high from the previous downswing. The confluence of those levels increases its potential as an upside objective.
Because this is the first pullback following a significant breakout above both the downtrend line and the 200-day moving average, an eventual recovery is still anticipated. That outlook begins to change though, if support fails to hold near the 20-day moving average. Should that average give way, Friday’s loss of the 200-day moving average would look like more than a brief interruption in the larger advance.
Gold Price Forecast
Every new Gold analysis as it publishes, today's technical signal and key levels, live price — on one page.
See all Gold forecastsIf you’d like to know more about how to trade gold and silver, please visit our educational area.