Twin Breaks Above $275.44 and $285.36
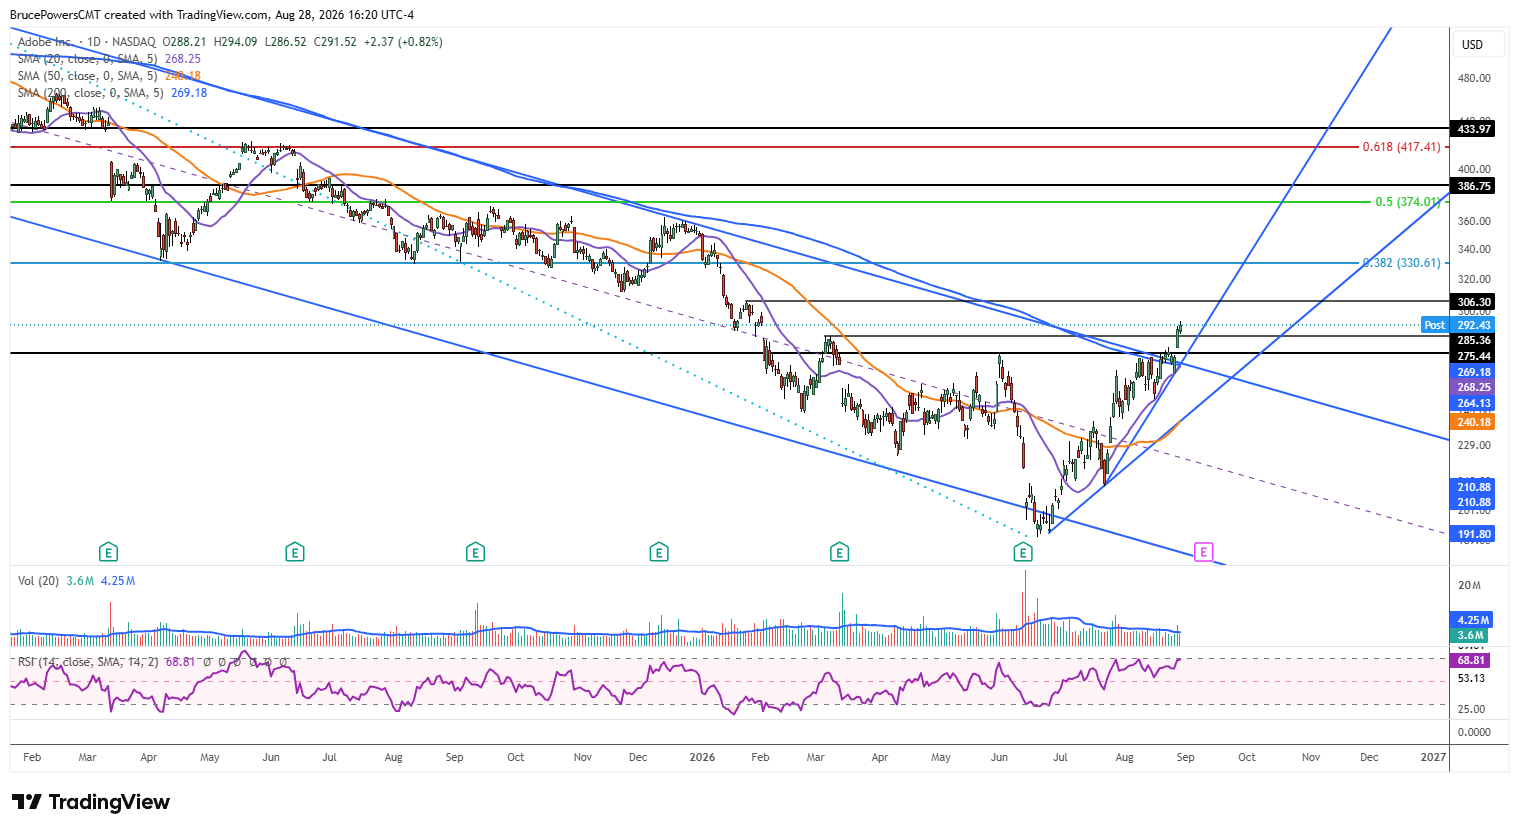
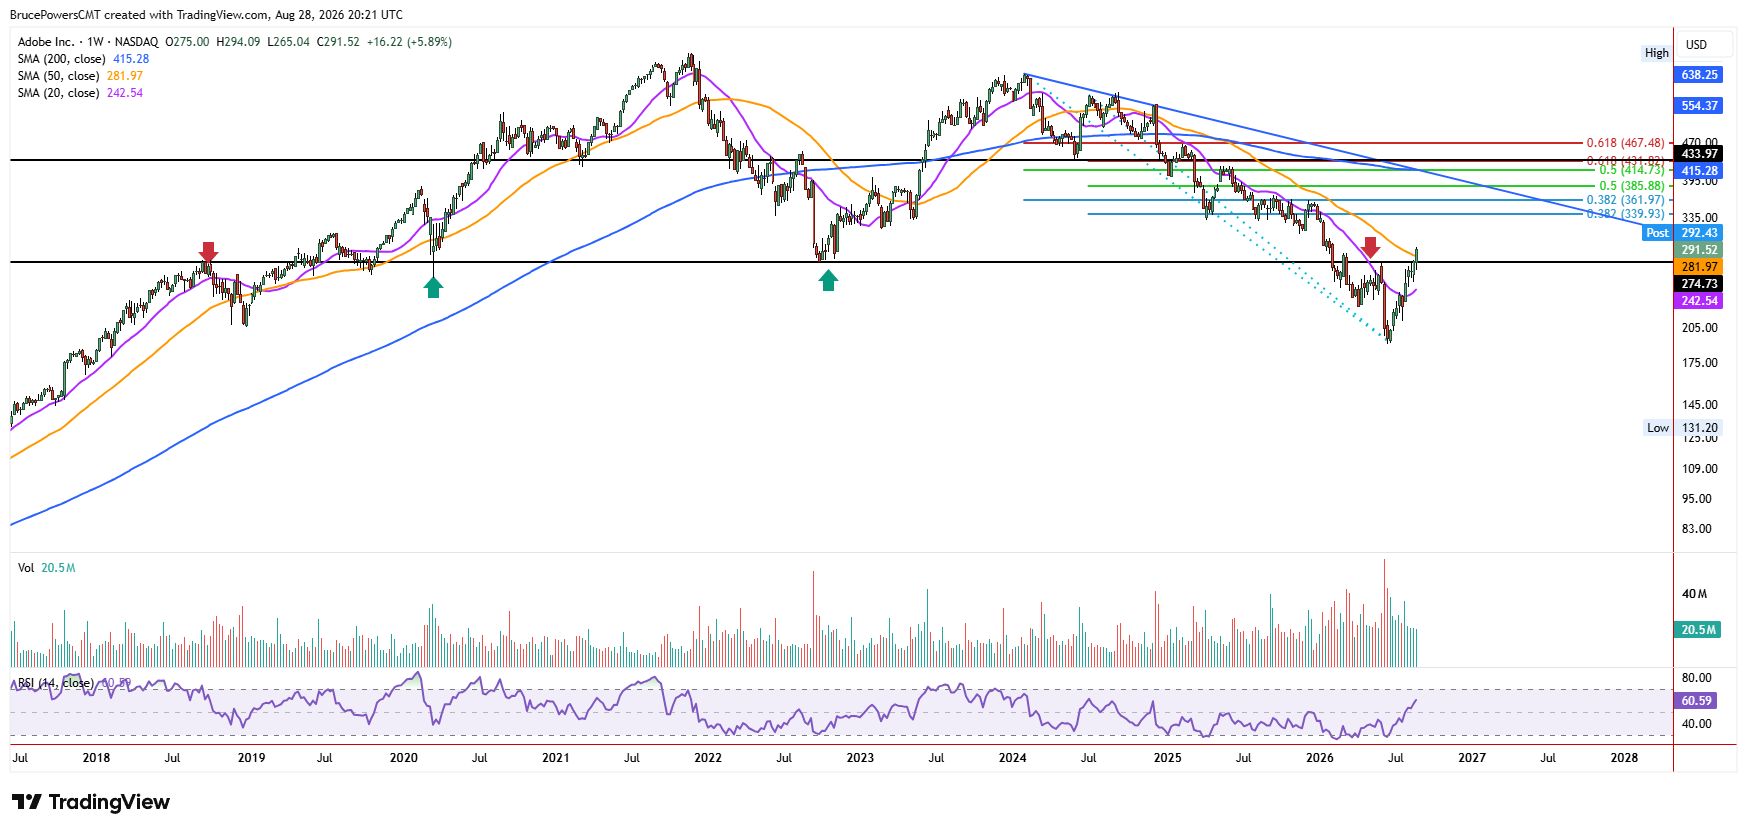
Adobe, Inc. (ADBE), a digital media software company, triggered a bullish reversal of the prior decline this week with a decisive rally above the early-June lower swing high at $275.44. That break was quickly followed by a second reversal signal on a move above the March lower swing high at $285.36. ADBE ended the week above both levels at $291.52, after reaching a high of $294.09, thereby confirming the breakout signals. In addition, a reclaim of the 200-day and 50-week moving averages on their respective charts, confirmed strength and the likely change in character for ADBE.

Twelve-Day Coil Breaks a Long-Term Zone
Resistance near the $275.44 high had been tested as resistance, along with the 200-day moving average, for about 12 days before the trend extension, leaving a relatively narrow consolidation range. That price zone has mattered because it has acted as support or resistance several times since September 2018. Therefore, its recovery may continue to be followed by bullish price action, since it also argues that the recent correction is complete.
20-Day Line Opens Path to $306.30
Dynamic support was confirmed at the 20-day moving average during that consolidation, identifying it as a key near-term dynamic support line for the developing advance. Improving bullish momentum will shortly be signaled if the 20-day moving average crosses above the 200-day moving average, a cross that is now close with the two averages near $258.25 and $269.18.
Near-term, the next upside target is the lower swing high at $306.30. Higher objectives then start around the 38.2% Fibonacci retracement at $330.61, which matches support from April 2025 and adds to that level’s significance. The downswing being measured is contained within a larger decline, so $330.61 remains a conservative estimate rather than an exhaustive ceiling.
First Pullback Tests Fresh Breakout Levels
Traders will be watching for the first pullback following this week’s breakout to test support levels before another anticipated leg higher. That would by typical behavior after a breakout through stacked resistance. Key areas to watch start with the same $285.36 and $275.44 swing highs that were just cleared. The 200-day moving average at $269.18 is also an important area, along with the 20-day moving average, now near $268.25. Those are the levels that will show whether this week’s reversal above $275.44 and $285.36 was only a brief squeeze or the start of a lasting change in character.
If you’d like to know more about technical analysis and how traders use it, please visit our educational area.