Warsh Took $235 Off Gold in One Session
Warsh walked into Jackson Hole and told the market that better summer inflation readings do not mean the fight is over. Gold dropped from $4,601.05 to $4,452.69 between the opening and late afternoon. The 200-day moving average broke. The bear market threshold broke. The dollar hit a session high and September hike odds repriced immediately.
Tuesday gold was at $4,697. Friday it closed at $4,462. That is $235 in four sessions. The Treasury buyback rally that carried the metal 5% higher last week gave it all back once Warsh made clear the Fed is not ready to let inflation data do the work alone.
At 18:03 GMT, Spot Gold (XAUUSD) was trading at $4,462.24, down $139.90 or 3.04%.

Daily Spot Gold (XAUUSD) Technical Analysis
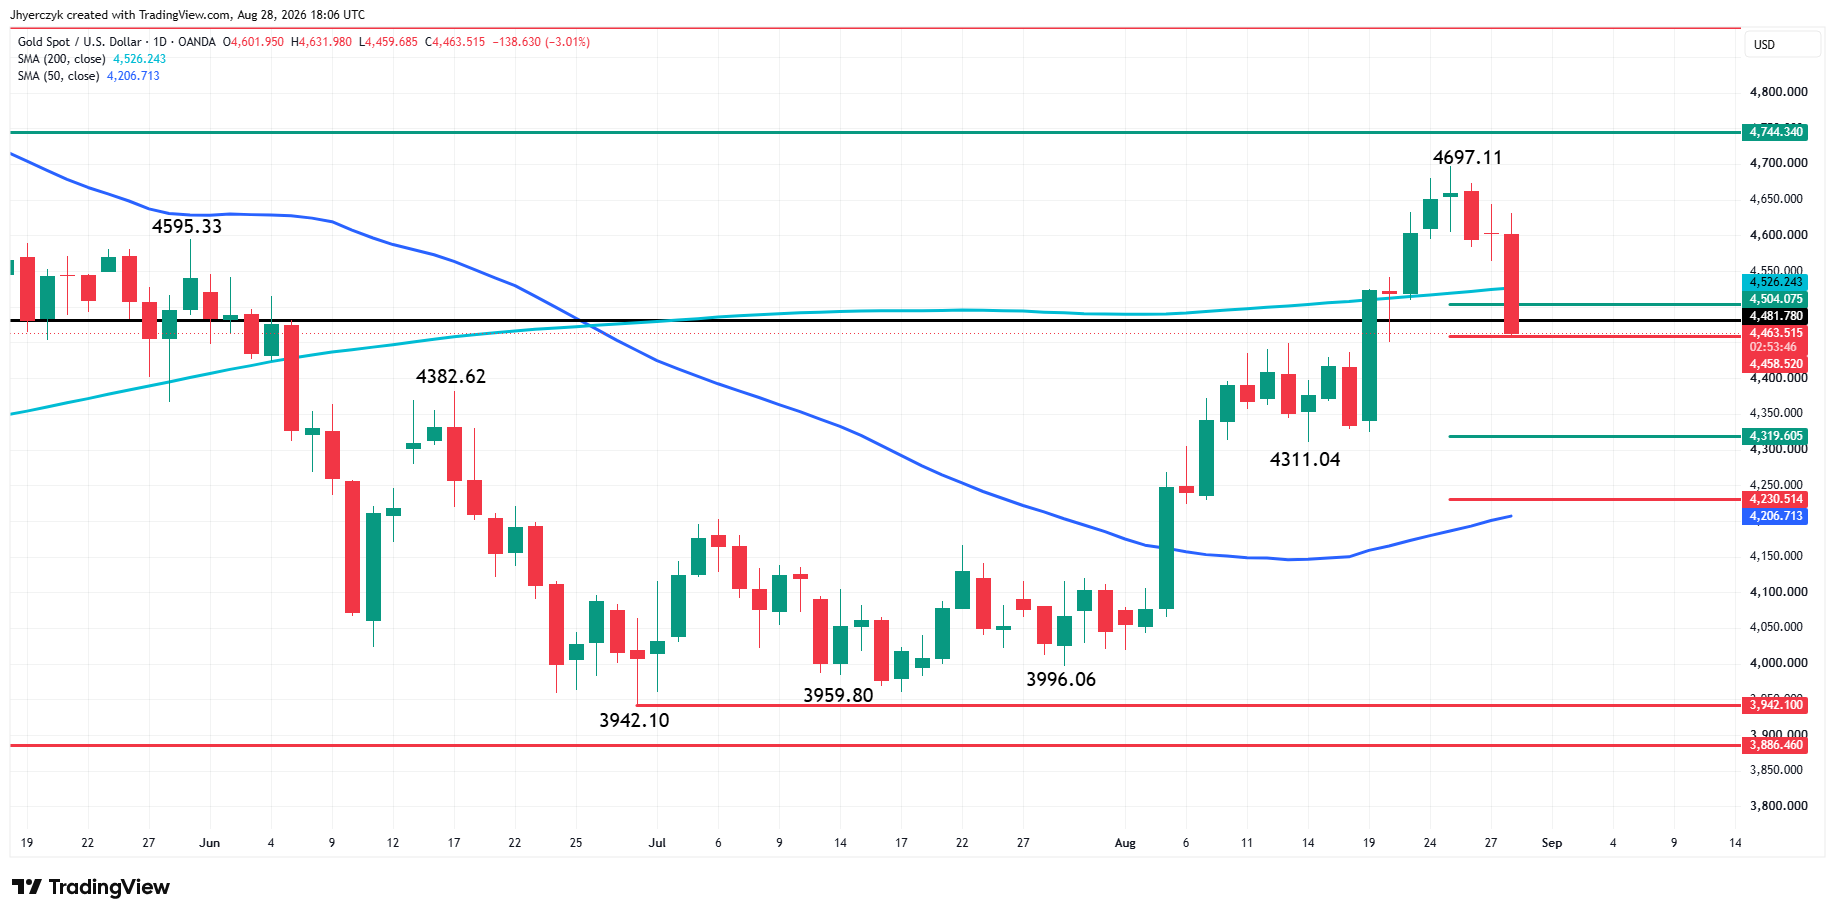
Spot Gold is trading sharply lower late in the session on Friday after crossing to the weak side of the 200-day moving average at $4526.24. This indicator is now potential resistance. The market is also trading below $4481.78, which is 20% lower than the all-time high at $5602.23. To some analysts, the move means that gold has fallen back into bear market territory.
The main trend is up according to the swing chart. A trade through $4697.11 will signal a resumption of the uptrend. A move through $4311.04 will change the main trend to down.
The short-term range is $4311.04 to $4697.11. Spot gold is currently testing its 50% to 61.8% retracement zone at $4504.07 to $4458.52. If there is a technical bounce, traders could take a run at the 200-day MA. If sellers take out $4458.52, then look for a possible acceleration to the downside.
If there is a sharp break, then the intermediate 50% to 61.8% zone will be the next target area at $4319.60 to $4230.51. The next target is the 50-day moving average at $4206.66. This indicator is both support and a trend indicator.
Gold Price Forecast
Every new Gold analysis as it publishes, today's technical signal and key levels, live price — on one page.
See all Gold forecastsWarsh Repriced the Rate Trade and the Dollar Followed
Warsh has been careful with his language since taking the chair. Friday was different. According to one analyst, he delivered the most deliberately hawkish speech since he took the chair. The Fed will have work to do if policymakers are not confident underlying inflation is returning to target. Financial conditions do not appear restrictive. No forward guidance. No list of triggers before September 16. September hike odds jumped from 35% to 61.5% on the day and December reached 80%.
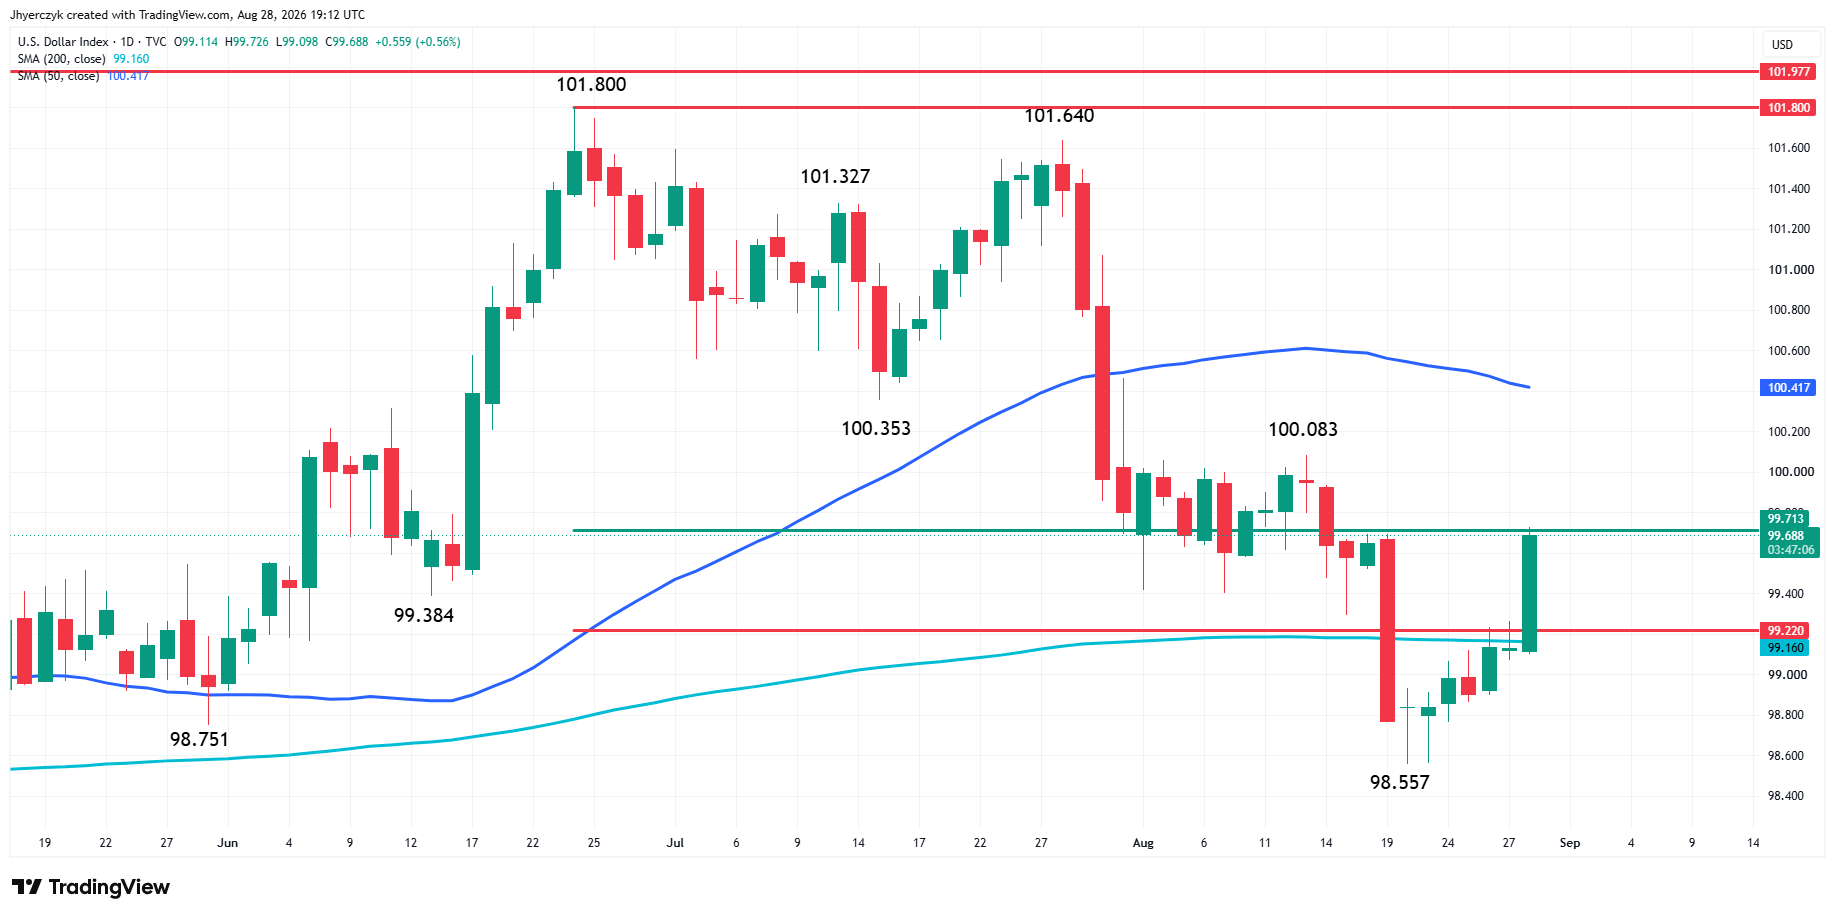
The dollar index rose 0.35% to 99.46 and hit 99.592, its highest since August 19. The greenback is up nearly 0.7% for the week, its biggest weekly gain in five weeks. The euro dropped 0.34% to $1.1611. Sterling weakened. The yen weakened. The Canadian dollar fell as trade talks with the U.S. collapsed. Last week the dollar broke to a three-month low after Bessent’s buyback announcement. This week Warsh took it back.
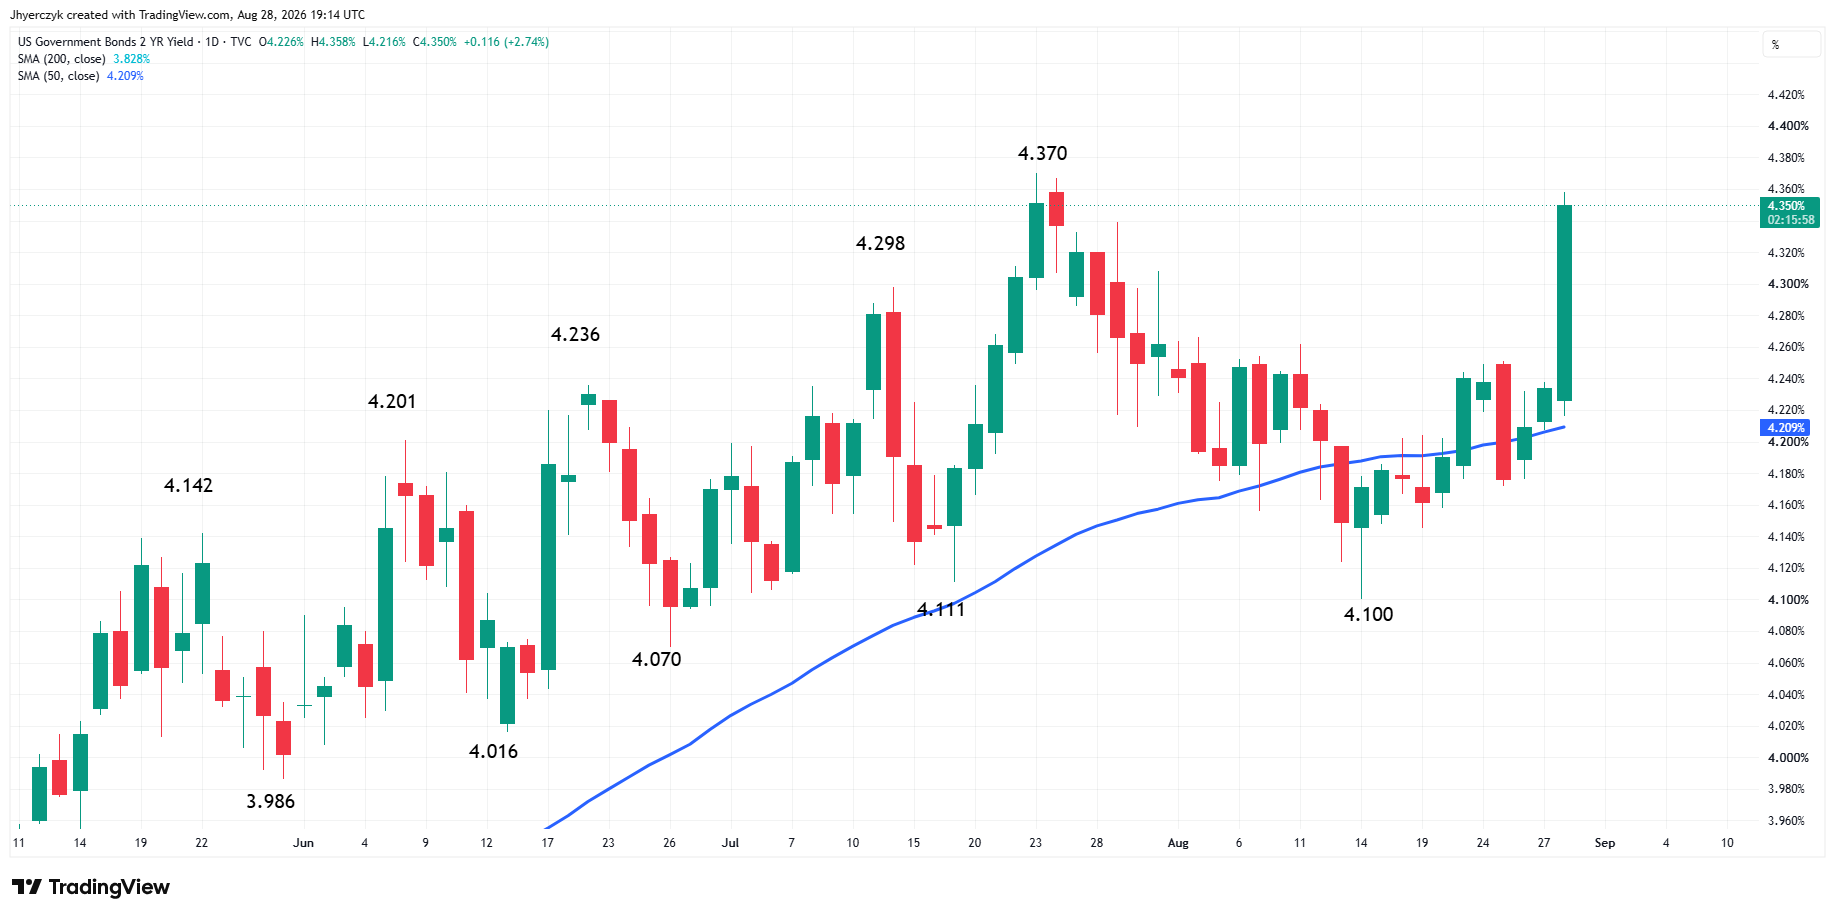
The 2-year yield jumped more than 10 basis points to 4.352%. The 10-year rose to 4.728%. The 30-year was barely higher at 5.207%. The short end did all the work. The buyback trade that weakened the dollar last week is still sitting underneath the long bond. Warsh put pressure on gold from the front end of the curve. Bessent’s program is still working the back end. Gold lost $235 caught between the two.
Three Fed officials had already raised inflation concerns Thursday at Jackson Hole. Kansas City Fed President Jeffrey Schmid said rates are not restrictive. Cleveland Fed President Beth Hammack called for tighter policy. Boston Fed President Susan Collins called the latest inflation reading mixed. Warsh landed on top of all of them Friday and gave the market the strongest signal yet that September is live.
Moneycorp’s Eugene Epstein said Warsh is saying a lot without being substantive and that if the Fed does not follow through, the market will start treating his commentary with a grain of salt. The speech moved positioning hard. The data and the committee still have to back it up before September 16.
Gold discounts in India plunged this week as demand fell sharply on speculation the government could roll back a recent hike in import duties. Weaker Indian demand on the same week as a hawkish Warsh speech and a stronger dollar removed one of the physical floors that had been sitting under the metal.
What to Watch
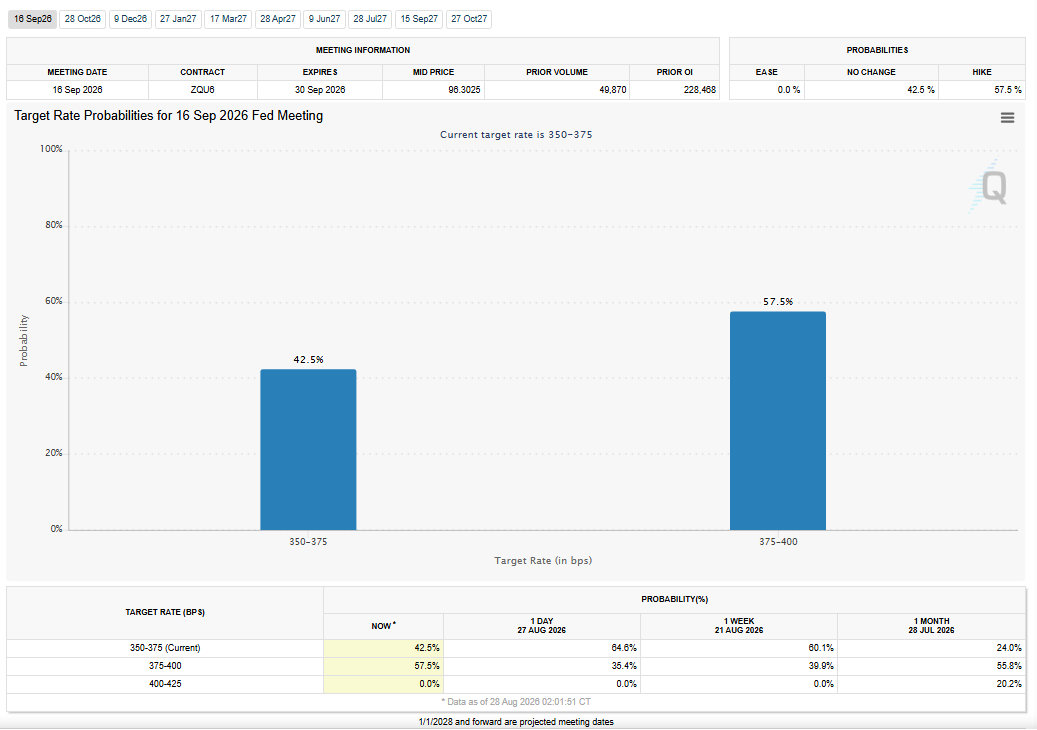
Warsh made clear the Fed can still raise rates. He did not say what would stop it. Consequently, gold gave back the entire Treasury buyback rally in four sessions. September hike odds are at 61.5% and December is at 80%. In response, the dollar had its best week in five weeks.
The swing chart trend is still up even after a $235 drop and a break below the 200-day moving average. The rate trade repriced hard Friday. The chart has not confirmed it yet. Employment and inflation data before September 16 decide which one catches up to the other.
If you’d like to know more about how to trade gold, please visit our educational area.