

ETH/BTC BARR Bottom Points to 40% Relative Upside
ETH/BTC appears to be forming a Bump-and-Run Reversal, or BARR, bottom, a bullish structure that typically emerges after a prolonged decline accelerates into capitulation before price recovers toward its primary downtrend resistance.
The pair’s decline from its 2022 highs represents the pattern’s lead-in phase, with ETH/BTC repeatedly forming lower highs beneath a descending resistance trendline.
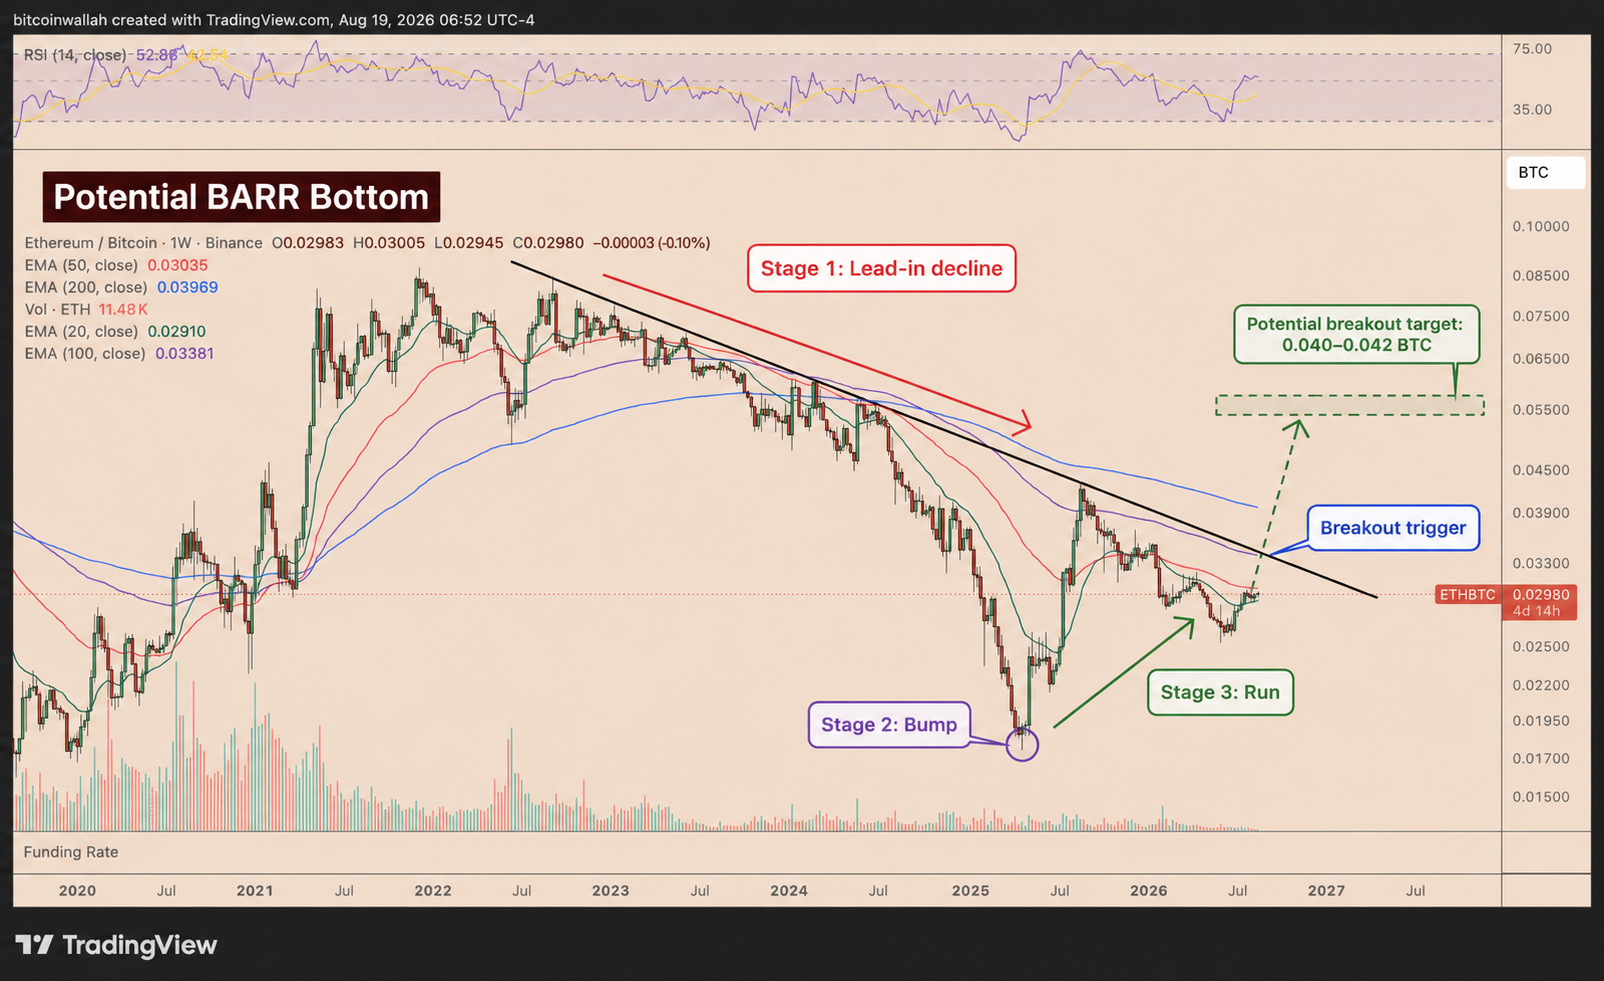
That relatively orderly decline accelerated sharply in early 2025, when ETH/BTC plunged toward approximately 0.018 BTC. The move resembles the pattern’s bump phase, characterized by unusually steep selling pressure before exhaustion.
ETH/BTC has since entered what could become the run phase, rebounding from its 2025 low and returning toward the same long-term descending trendline.
As of Wednesday, Aug. 19, the pair was trading near 0.0298 BTC, holding above its 20-week EMA (green) near 0.0291 BTC but facing resistance from the 50-week EMA (red) around 0.0303 BTC.
A decisive weekly close above this resistance cluster would strengthen the BARR bottom thesis and signal improving relative strength for Ethereum versus Bitcoin.
The next major upside zone sits around 0.040–0.042 BTC, representing approximately 34%–41% relative upside from current levels.
The target is based on a confluence of resistance. ETH/BTC’s 200-week EMA sits near 0.0397 BTC, while the 0.040–0.041 BTC area also capped the pair’s previous rebound.
Failure to clear the descending trendline, however, would keep ETH/BTC within its broader multi-year downtrend and weaken the bullish reversal case.
Ethereum Price Forecast
Every new Ethereum analysis as it publishes, today's technical signal and key levels, live price — on one page.
See all Ethereum forecasts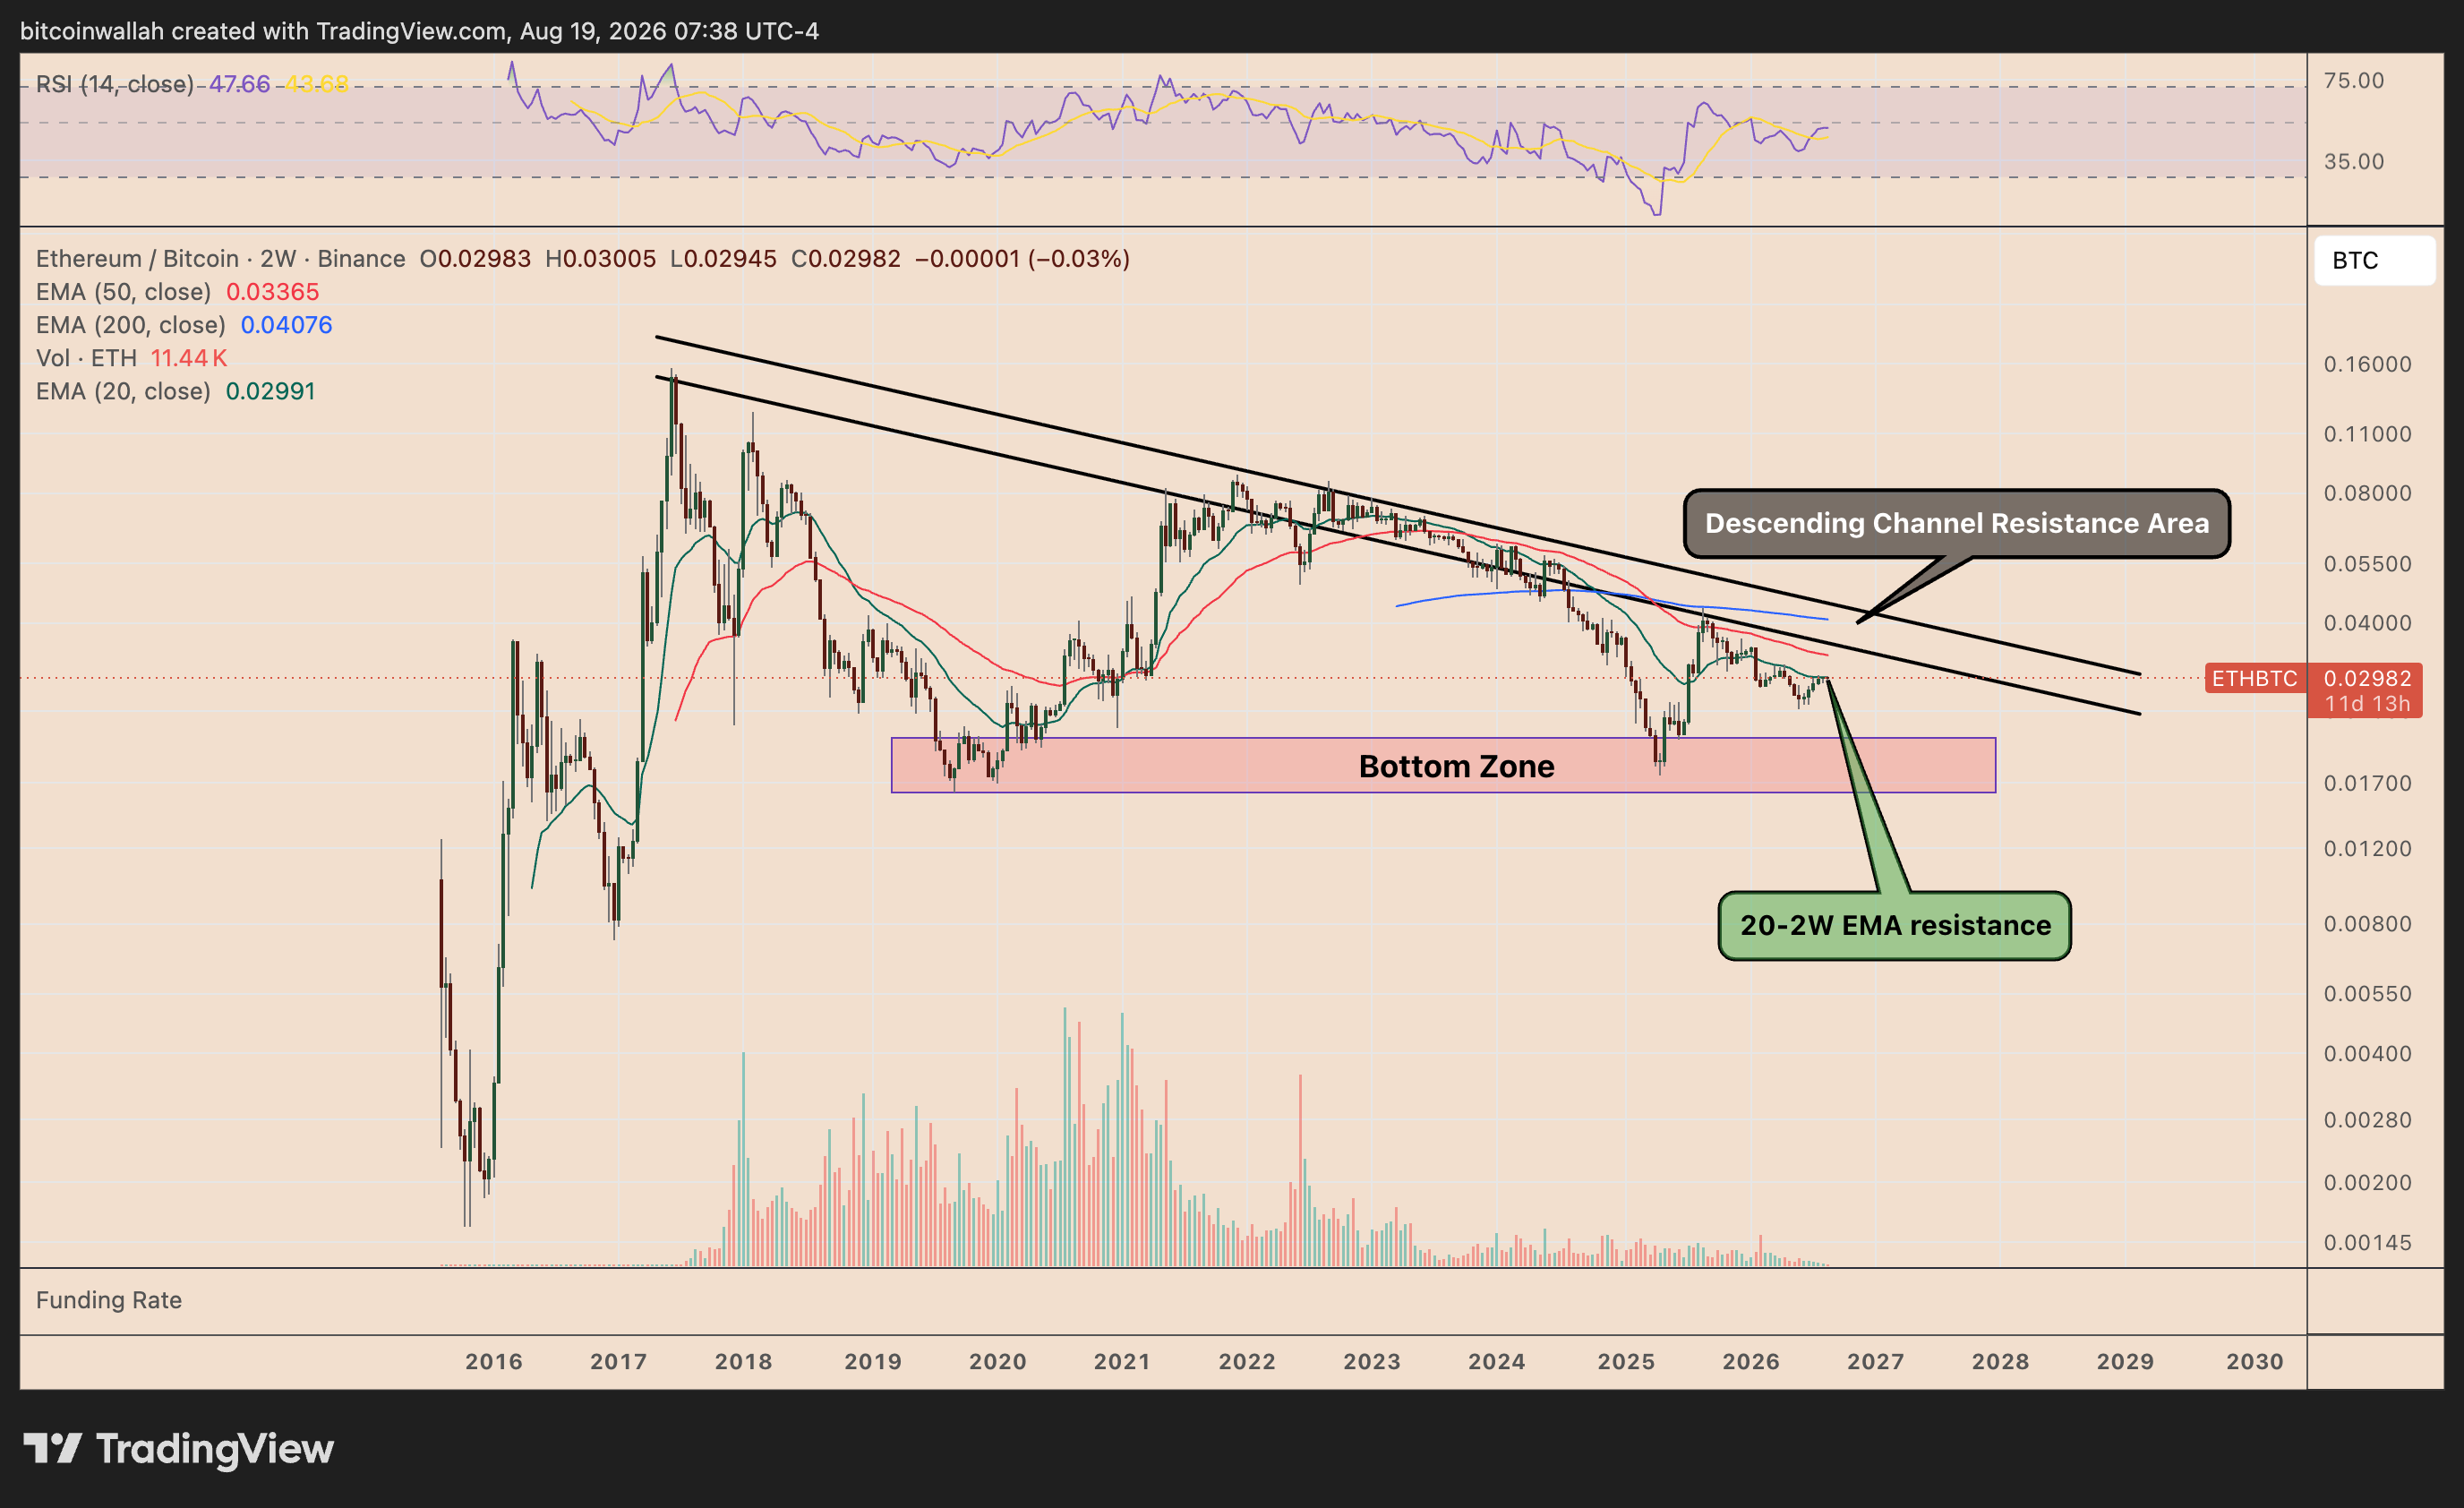
The rebound is constructive, but the pair is now approaching a key resistance confluence. ETH/BTC is testing both the channel’s upper trendline and its 20-period EMA on the two-week chart, which has capped upside during the broader downtrend.
A decisive breakout above this area would strengthen the case that Ethereum is beginning to regain relative strength against Bitcoin. It would also add confirmation to the BARR bottom setup visible on the weekly chart.
Until then, however, ETH/BTC remains technically inside its broader descending structure, leaving room for another rejection and pullback.