
Oil News: Hormuz Export Uncertainty Meets Softer U.S. Inventories
Uncertainty over the Strait of Hormuz continues to dominate oil markets on August 19, following conflicting analysis from the U.S. and Iran over whether the waterway actually is open. President Trump has contended there are no ongoing negotiations with Iran, and that Hormuz is open. Meanwhile, Iran has continued to hold that there are restrictions. With the end of the ceasefire on August 17, there is now no clear diplomatic path for the restoration of Gulf exports.
The oil market continues to adapt to the disruptions. Iraq has developed new mechanisms for exports at alternative locations beginning in September, while two large Chinese shipping companies are not sending tankers to Hormuz or Bab al-Mandeb, and are instead loading cargoes outside the Gulf. The EIA estimates that the disruptions in the Middle East likely accounted for 5.5 million barrels per day of shut-ins in July, with about 600,000 barrels per day expected to remain shut-in for the rest of 2020.
U.S. inventories have eased slightly. Compared to API data, EIA has the total commercial crude inventories falling by about 600,000 barrels in the week ending August 14.
The domestic natural gas marketfundamentals are better than in other regions. Production in the Lower 48 in August averaged around 108.5 Bcf/d, an increase from July’s record. Inventories are also much higher than normal. Above-average production and healthy inventory levels across the country still leave a significant buffer. Demand from LNG (liquefied natural gas) feedgas is recovering from recent copious maintenance, but the supply of natural gas is still better than needed.
In the energy markets for August 19, there is a clear division. While there are uncertain gas exports in the Gulf, crude oil and global LNG fundamentals are firmly in place. There are plentiful supplies of natural gas in the United States and weaker domestic inventories are limiting the broader concerns of excess supply.

Natural Gas Technical Analysis: NG Tests Descending Trendline Near $2.80
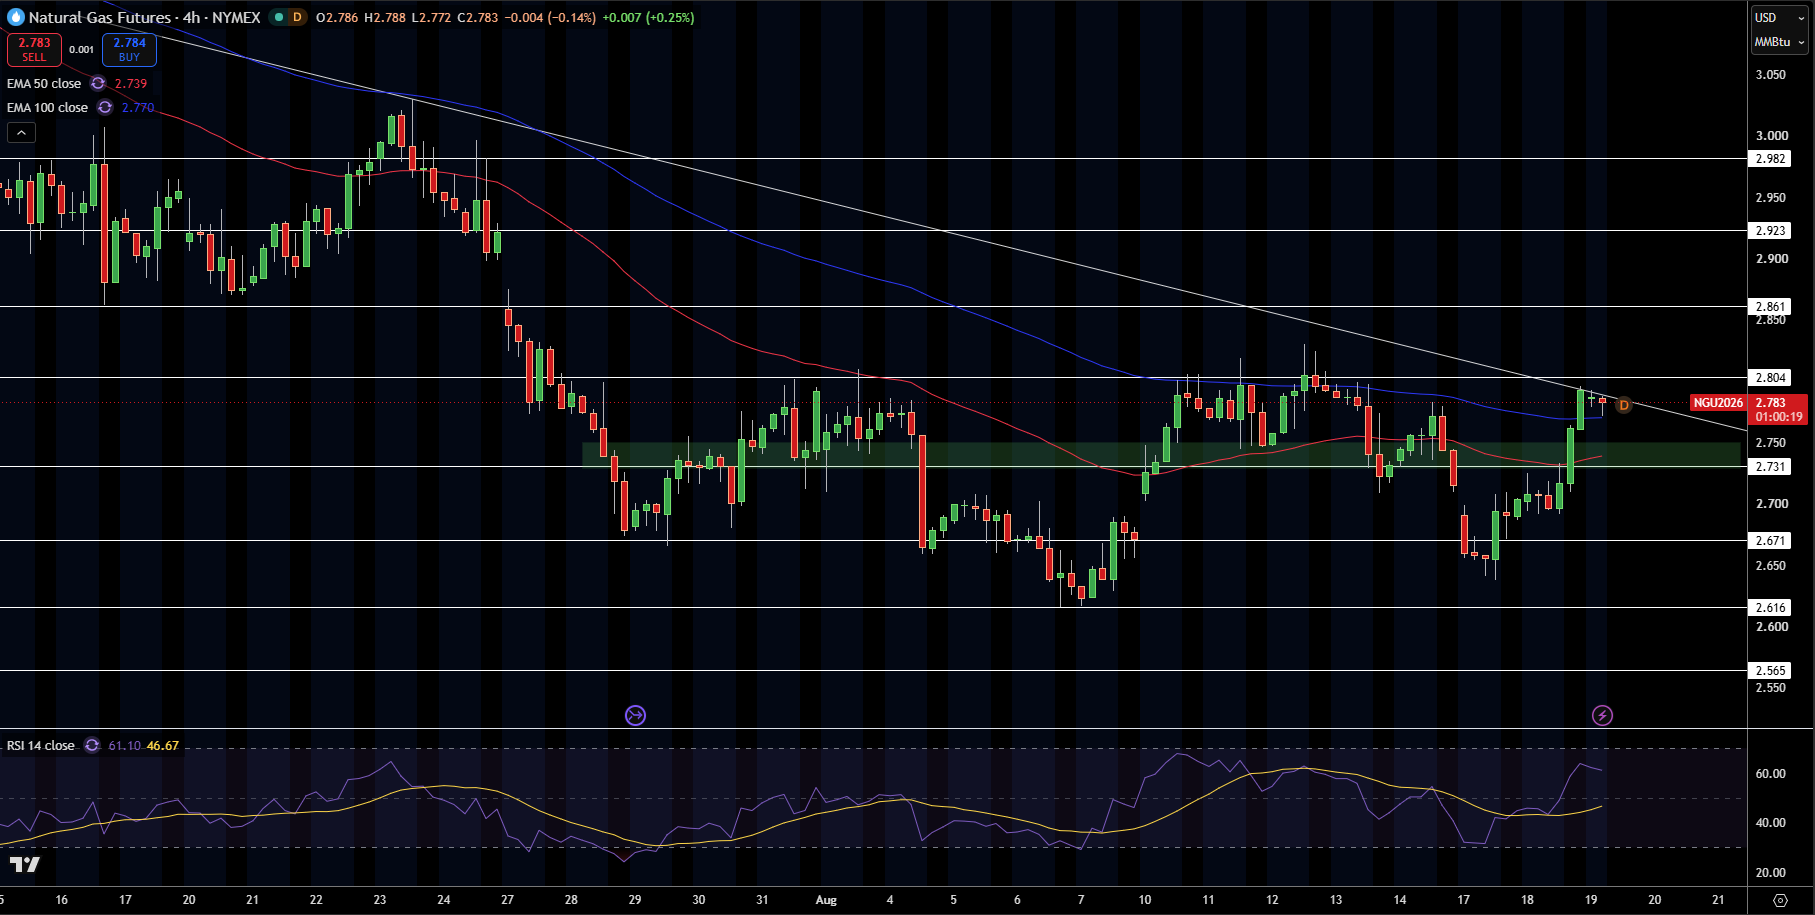
Natural gas moved back up to $2.78 from the $2.62 – $2.67 support zone after a very strong rebound. Price moved above the 50-EMA at $2.74 and is now testing the 100-EMA at $2.77 and the descending trend line that has been limiting rallies of the recent move lower. The area of $2.78 – $2.80 may be a key technical decision area.
RSI is at roughly 61, and is improving, but is not overbought. Immediate resistance may come in at $2.80, and $2.86, $2.92 and $2.98 may come in as resistance above that. Potential supports may be at $2.73, $2.67, and $2.62.
In my opinion, a break above $2.80 would bring a very short term bullish view and may bring possible price targets of $2.86 – $2.92. If the trendline resistance holds, then price may fall towards $2.73 or $2.67.
Natural Gas Price Forecast
Every new Natural Gas analysis as it publishes, today's technical signal and key levels, live price — on one page.
See all Natural Gas forecastsWTI Crude Oil Technical Analysis: WTI Holds Above $83.79 as Buyers Eye $86.87
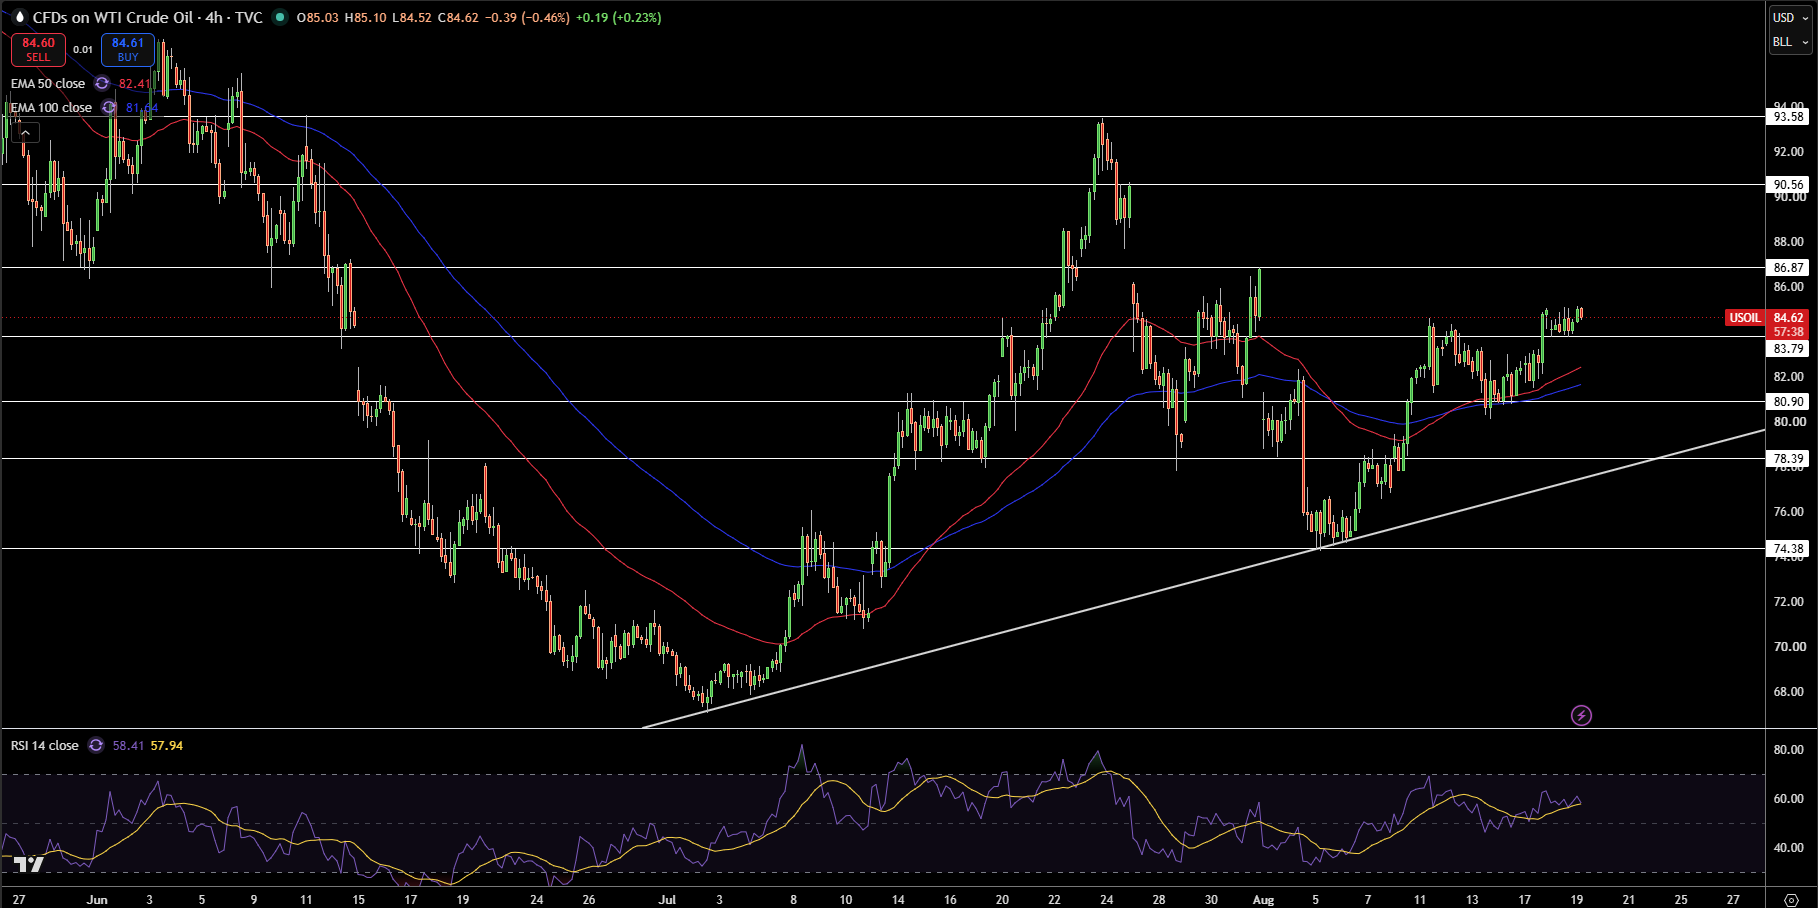
As of the 4-hour chart, WTI oil is trading at $84.62 and is holding well above the 50-EMA at $82.41 and the 100-EMA at $81.64. The price has begun recovering from the August lows and is currently trading in a consolidation range just above the $83.79 support level. Recently formed lower highs are bullish and continue to form above the rising trend line, however, the latest push higher has caused some momentum to slow.
The RSI is sitting at 58, and has crossed back above the midline indicating positive bullish momentum. Immediate resistance can be found at $86.87, with $90.56 and $93.58 providing resistance levels above. Price action support can be found at $83.79 with $80.90 providing additional support below.
WTI remains technically bullish above $83.79 and a break above $86.87 would be bullish and lead to a test of the $90.56 level. A break back below $80.90 would lead to an extension of the current consolidation range.
Brent Crude Oil Technical Analysis: Brent Holds Above $90.17 With $93.78 Next in Focus
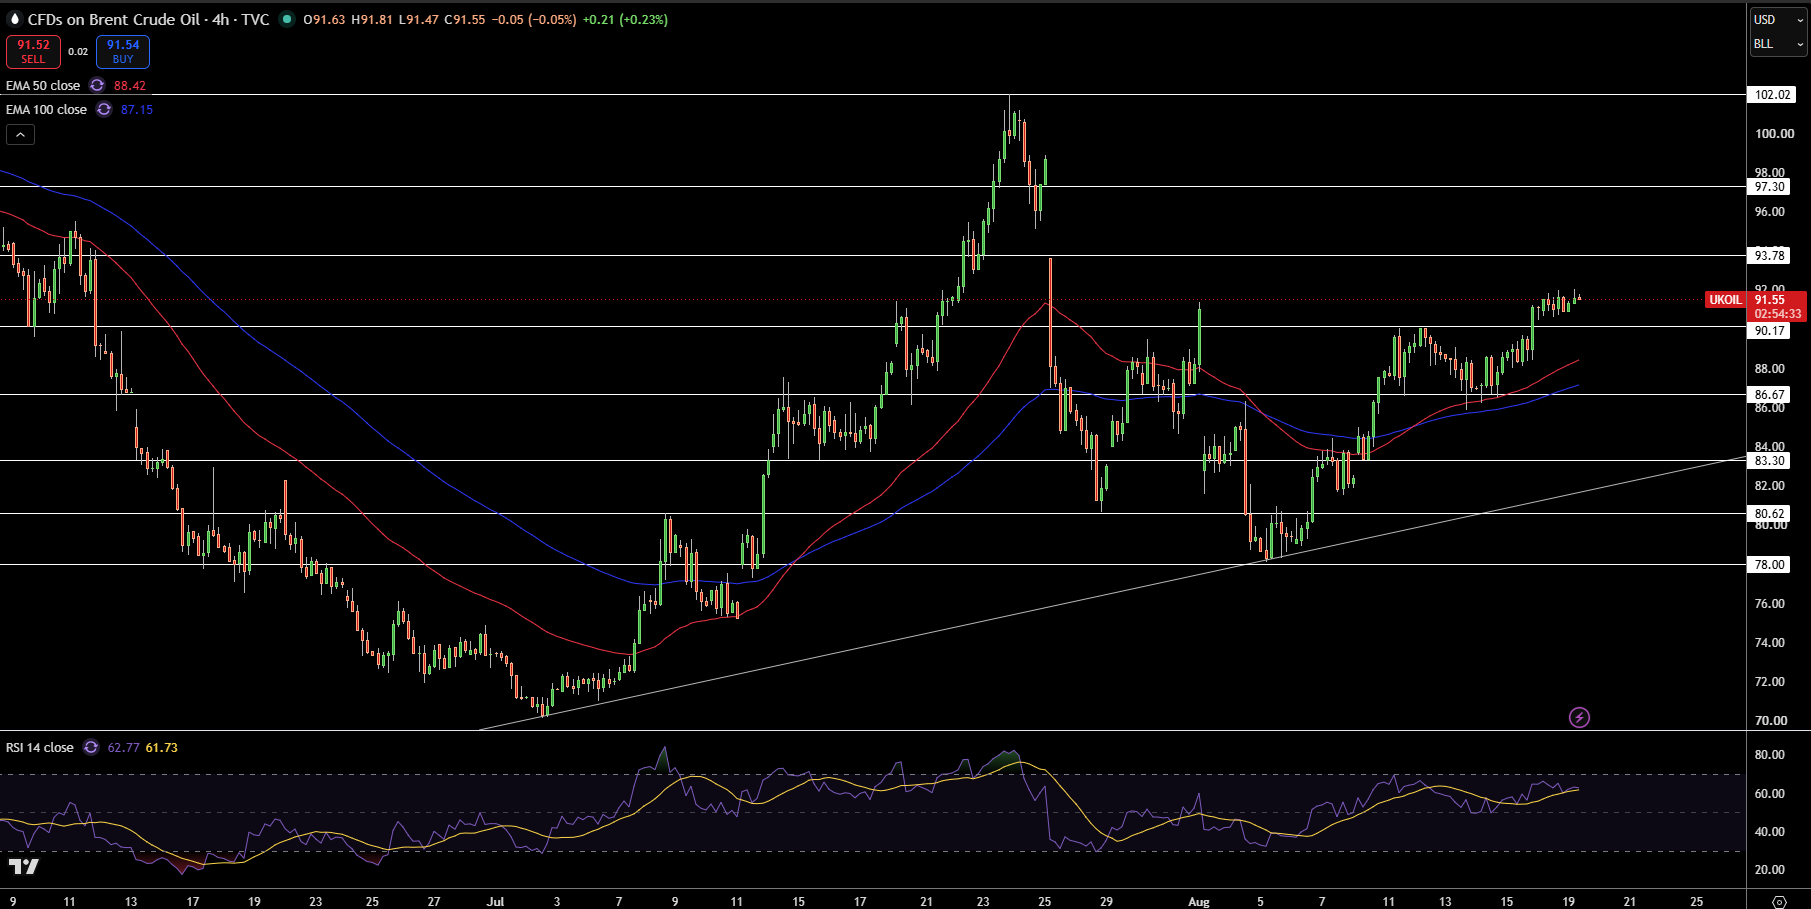
Brent crude is currently trading at $91.55 on the 4-hour chart having extended its recovery from the $78.00 trading level. Brent crude oil has confirmed that the bulls are in control of the short-term trend as the price is now trading well above the 50-EMA which is at $88.42 and the 100-EMA which is at $87.15. The latest candlesticks have consolidated above $90.17 indicating that the bulls are looking to build a base before attempting to travel even higher.
RSI is at 63 showing decent bullish momentum, but is still below terrifying overbought territory. The first resistance level is at $93.78, next is $97.30 and $102.02. The first support level is at $90.17, next is $86.67 and $83.30.
Brent keeps showing signs of ‘technical constructiveness’ in my opinion, above the level of $90.17. A break above $93.78 would be a confirmation for an upward move to $97.30. A fall from the level of $86.67 would lose the bullish structure.