
US Dollar News: Fed Minutes, ECB Hike Bets and UK Inflation Drive FX
Opening today, the focus is on upcoming minutes from the July Fed meeting. These will offer insight on how divided members were on the call regarding another potential rate hike. Although recent domestic data has shown signs of slowing (i.e. negative jobs report, milder inflation reports, lack of retail spending) current markets lean towards a chance of the Fed holding rates at the September meeting at about 65%, whereas a potential tightening is at 35%. Middle East supply concerns also mean that the dollar is not safe from another surprise inflation surge and a potential for more rate hikes.
On the other hand, the Euro has the potential to harden against the dollar given that, although inflation in the EU is at 2.9% (compared to the ECB’s target of 2%), eurozone inflation is still due to energy costs, which of course are transitory. A Reuters survey shows that 57 out of the 69 economists surveyed anticipate an increase of 25 basis points in the interest rate by the ECB from 2% to 2.5% in September, with a pause on interest rate hikes until the middle of 2027 at least.
Although inflation is falling in the UK as seen in the cooling of labor put in (i.e. dip in job vacancies and private sector wage growth), it is still signaling a negative outlook for GBP.
Investors are waiting for UK July inflation data coming Wednesday lunchtime. Analysts expect an increase in headline inflation to 2.9% from 2.6%. 56 of 64 economists surveyed by Reuters expect the BoE to maintain Bank Rate at 3.75% through the end of 2023.
For August 19, the main FX theme is policy divergence: fading Fed-hike expectations, a more hawkish ECB, and a BoE becoming more constrained by cooling jobs data, even with mounting inflationary pressures.

U.S. Dollar Index Technical Analysis: DXY Pressures $99.38 Support as Momentum Stays Weak
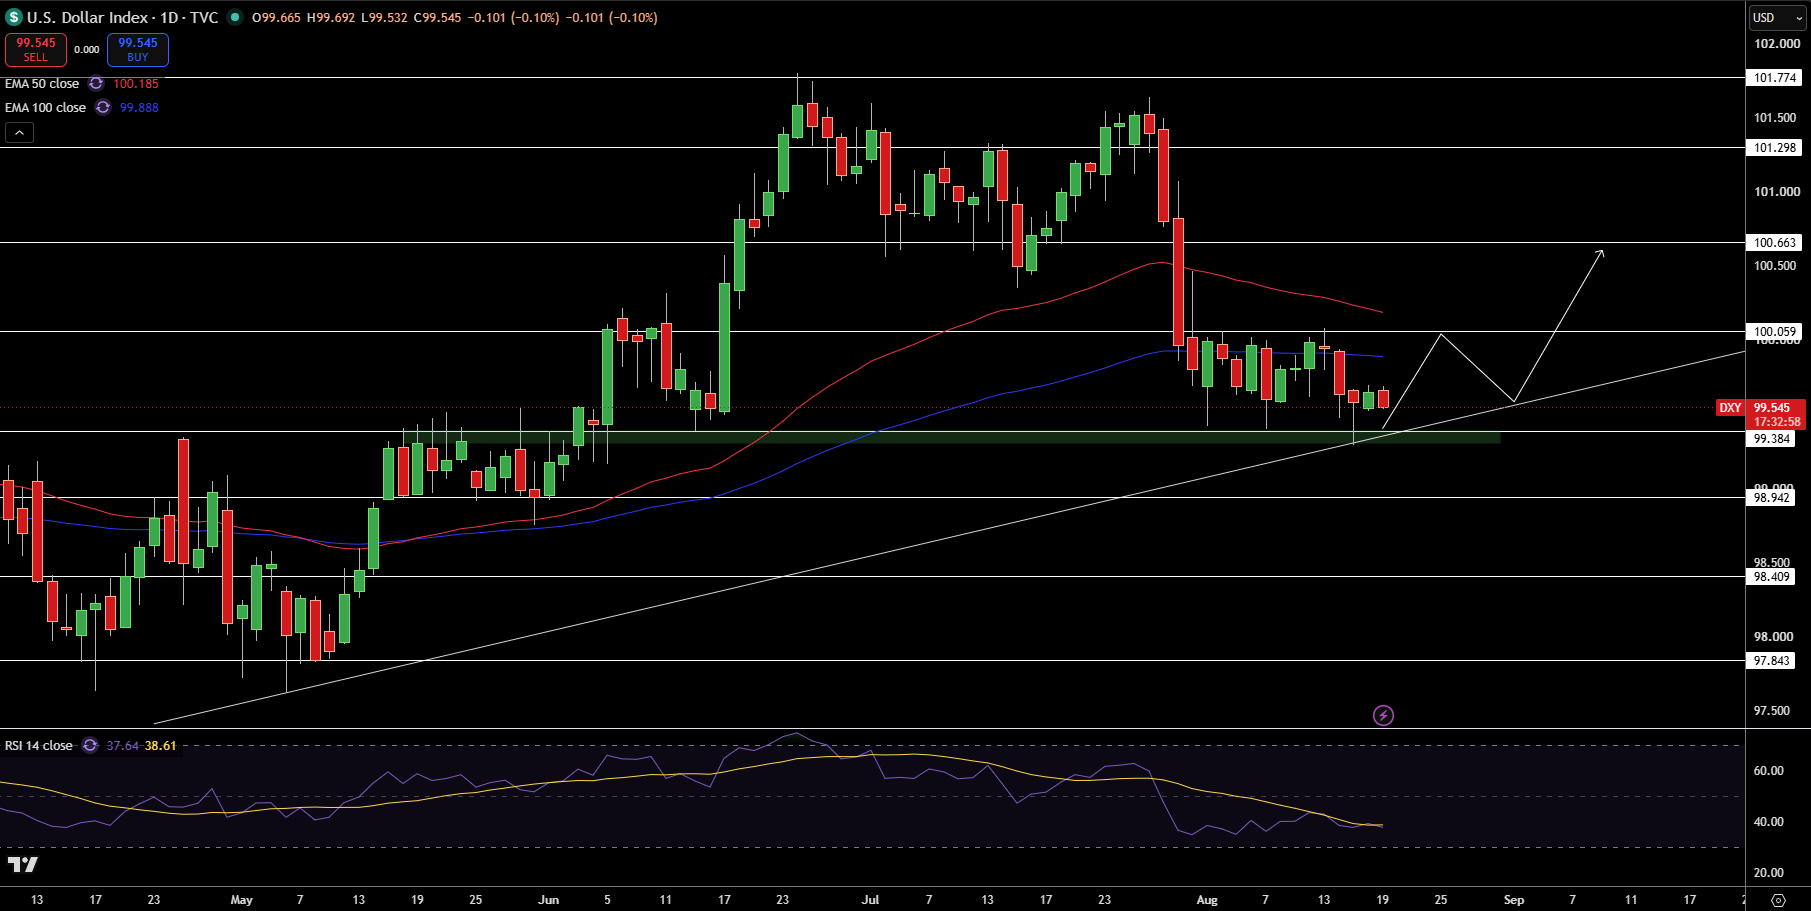
The U.S. Dollar Index is trading at approximately $99.55 after a long slide from the $101.60 zone. The price, which remains below the 50 and 100-day EMAs positioned at $100.19 and $99.89, respectively, keeps the short term outlook negative. The last few candles are clustering above the ascending trendline and the $99.38 support zone, making this area crucial for the potential continuation of the broader recovery.
The RSI line is at 38, indicating weak momentum and raising the risk for another test to the downside. Immediate resistance is at $100.06, then at $100.66, $101.30 and $101.77. In the case of a confirmed break below $99.38, we may see $98.94, $98.41 and $97.84
While the DXY is trading below the $99.89 – $100.19 zone, it is vulnerable in my opinion. The DXY can bounce to $100.06 if it holds $99.38, however, a daily close below $99.38 would be a much stronger bearish signal.
EUR/USD Price Forecast
Every new EUR/USD analysis as it publishes, today's technical signal and key levels, live price — on one page.
See all EUR/USD forecastsGBP/USD Technical Analysis: Pound Consolidates Above Rising Trendline Near $1.3540
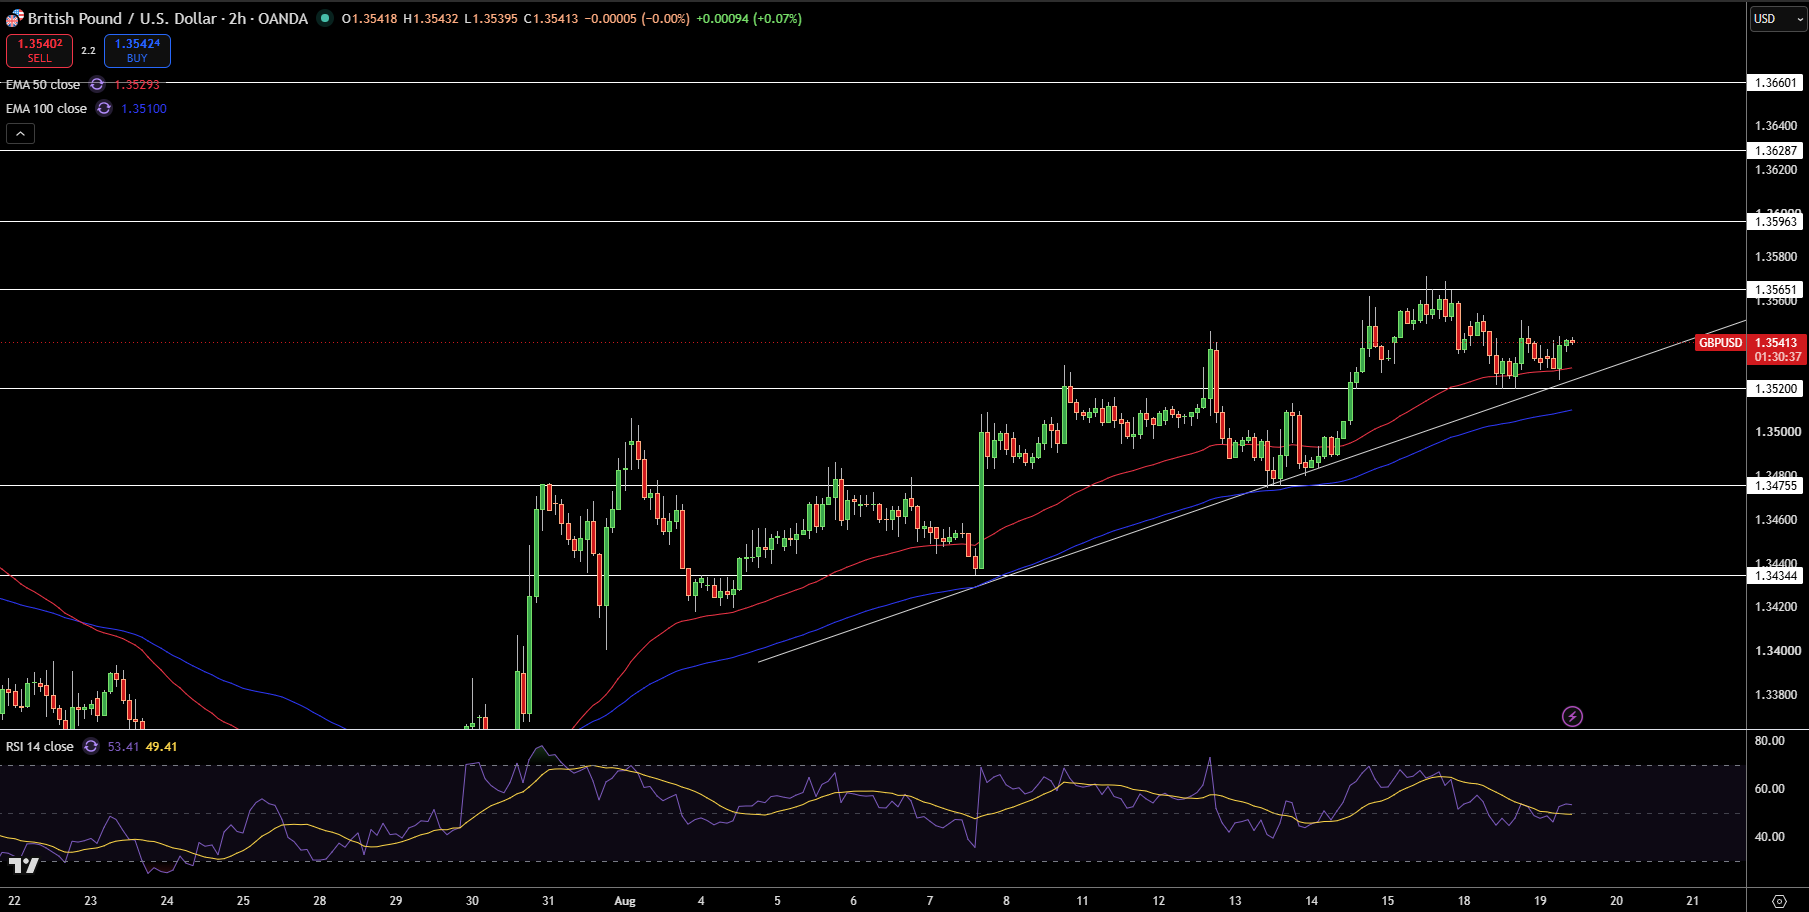
GBP/USD stands at $1.3541 in the 2-hour chart, consolidating after moving towards the resistance area of $1.3565. For now, price resides above the 50-EMA at $1.3529 and the 100-EMA at $1.3510. The bullish structure is supported by an ascending trendline. The recent price action in the form of sideways candlesticks is signaling a pause in the price action rather than a reversal.
At the momentistics index (RSI) stands at the 53 level, which indicates neutral momentum after a decline from higher level. The price area of $1.3565 is the next resistance zone, followed by $1.3596, $1.3629 and $1.3660. On the opposite side, we see support zone at $1.3520, $1.3476, and $1.3434.
GBP/USD is bullish above $1.3510 – $1.3520. A break above $1.3565 will stimulate the buying amongst traders and push the price higher towards $1.3596, while a move below the trendline will likely push the price down towards $1.3476.
EUR/USD Technical Analysis: Euro Holds Rising Trendline Above $1.1570
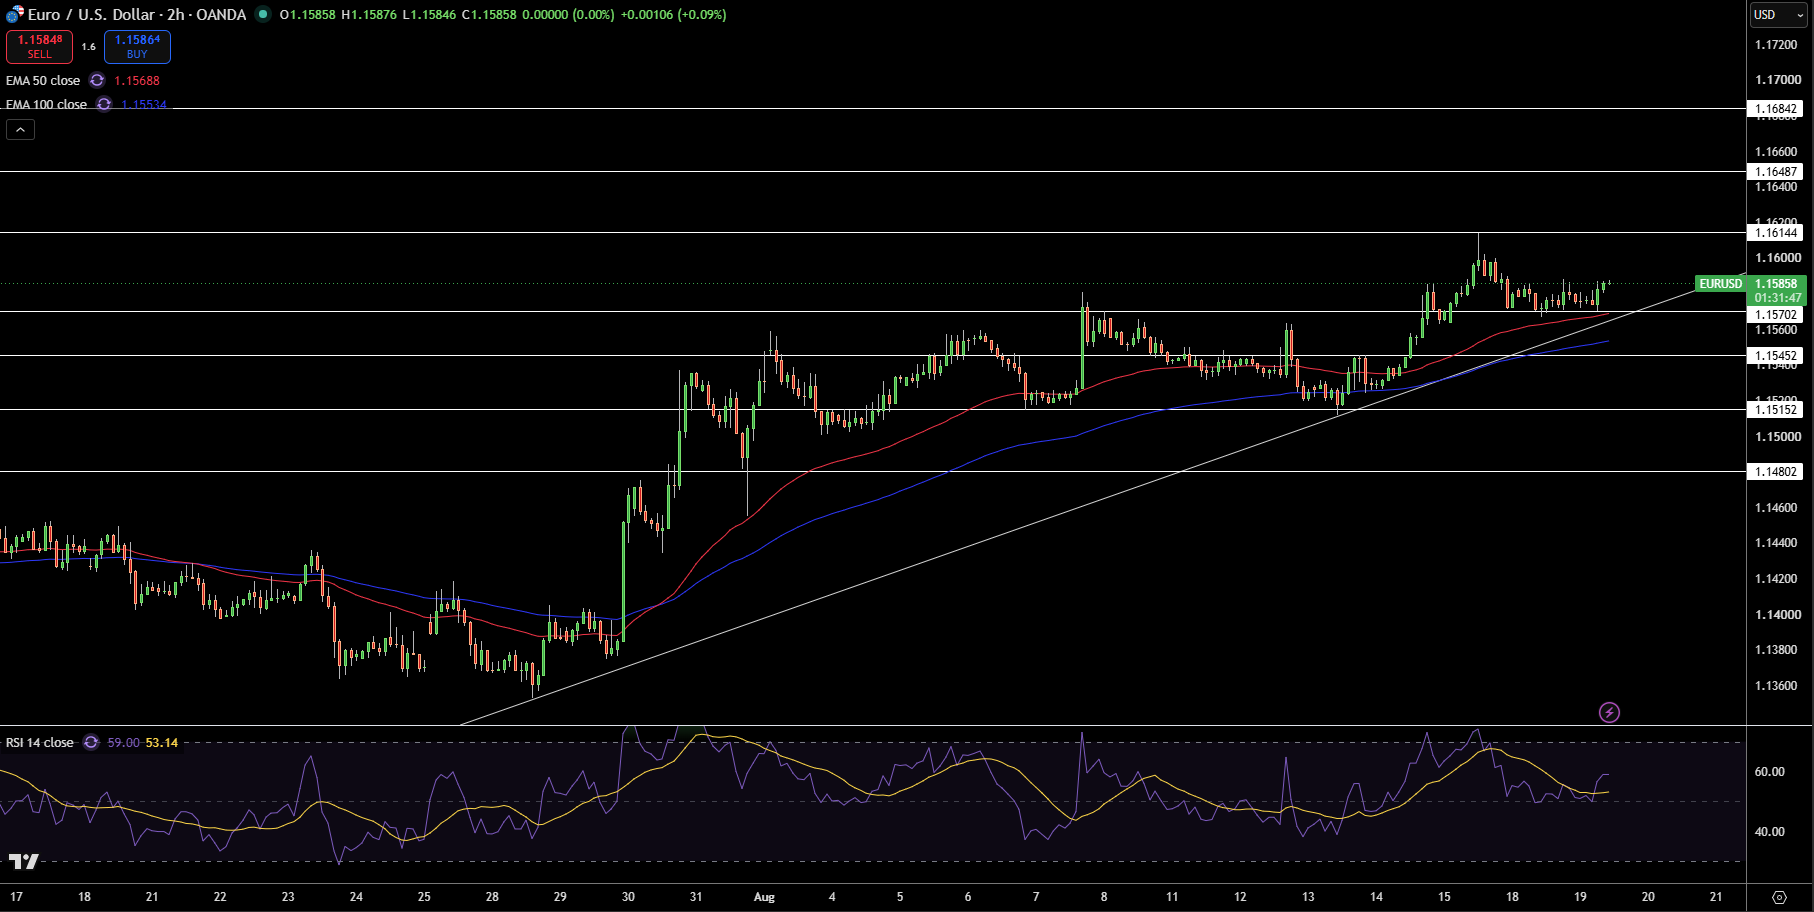
The price of EUR/USD is at $1.1586, while the broader bullish structure is above the rising trendline. The price is above the 50 EMA and 100 EMA located at $1.1569 and $1.1553, respectively. The latest price consolidation shows buyers are supporting the pullbacks after the advance to $1.1614
The RSI line is at 59 and is a good indicator of momentum as it is not in the overbought area. The next resistance price levels are at $1.1614, $1.1649 and $1.1684. Support levels are at $1.1570, $1.1545, $1.1515 and $1.1480.
I think that EUR/USD is technically positive above $1.1545-$1.1570 and the rising trendline. If $1.1614 is broken to the upside, then the $1.1649 level comes next. Selling EUR/USD below $1.1545 will shift the bias to the downside and target the lower EMAs.