Gold News: Fed Minutes and Bond Yields Put Bullion in Focus
Gold and silver fundamentals today are in a tug-of-war between lower expectations for the Fed and higher global bond yields. Traders are waiting for today’s release of the July FOMC minutes to get a better idea of how the Fed staff view the three officials that chose to dissent and vote for a rate hike. Right now, futures are indicating that there is a 65% chance that the Fed holds rates steady in September, while the probability of a rate hike is sitting at around 35%.
The main pressure on gold and silver is coming from the bond market. The 30-year U.S. Treasury yield reached 5.3371%, getting close to a 20-year high concern for government finances and inflation and a record-breaking amount of government borrowing. Higher yields make holding gold and silver more expensive, and there was a significant sell off in the precious metals on Tuesday.
Geopolitical conditions also have an effect. The U.S. Navy says the Strait of Hormuz is open, but Iran says the Strait is closed and the U.S. Navy is in violation of international law. There is still a question about the flow of oil and the flow of inflation. Gold buying would help protect against inflation, but this would probably cause more disruptions to the flow of oil.
There is still a great sense of demand for gold. Central banks bought a record of 289 metric tons in Q2 worth almost $45 billion. China purchased 20 metric tons of gold in July. Also, global gold ETFs recorded $3 billion of net inflows in July, 23 metric tons more of gold were purchased and held at a record high of 4,068 metric tons.
Silver’s fundamentals remain tight on the physical side. The Silver Institute projects a sixth consecutive deficit for 2026 at 67 million ounces. Although industrial fabrication is expected to decline by 2 percent to 650 million ounces, thrifty use of silver by solar manufacturers will be more than offset by demand from AI infrastructure, data centers, electronics, and the automotive sector which will provide overall structural support.

Gold Technical Analysis: XAU/USD Holds $4,320 Pivot but Trendline Keeps Bulls in Check
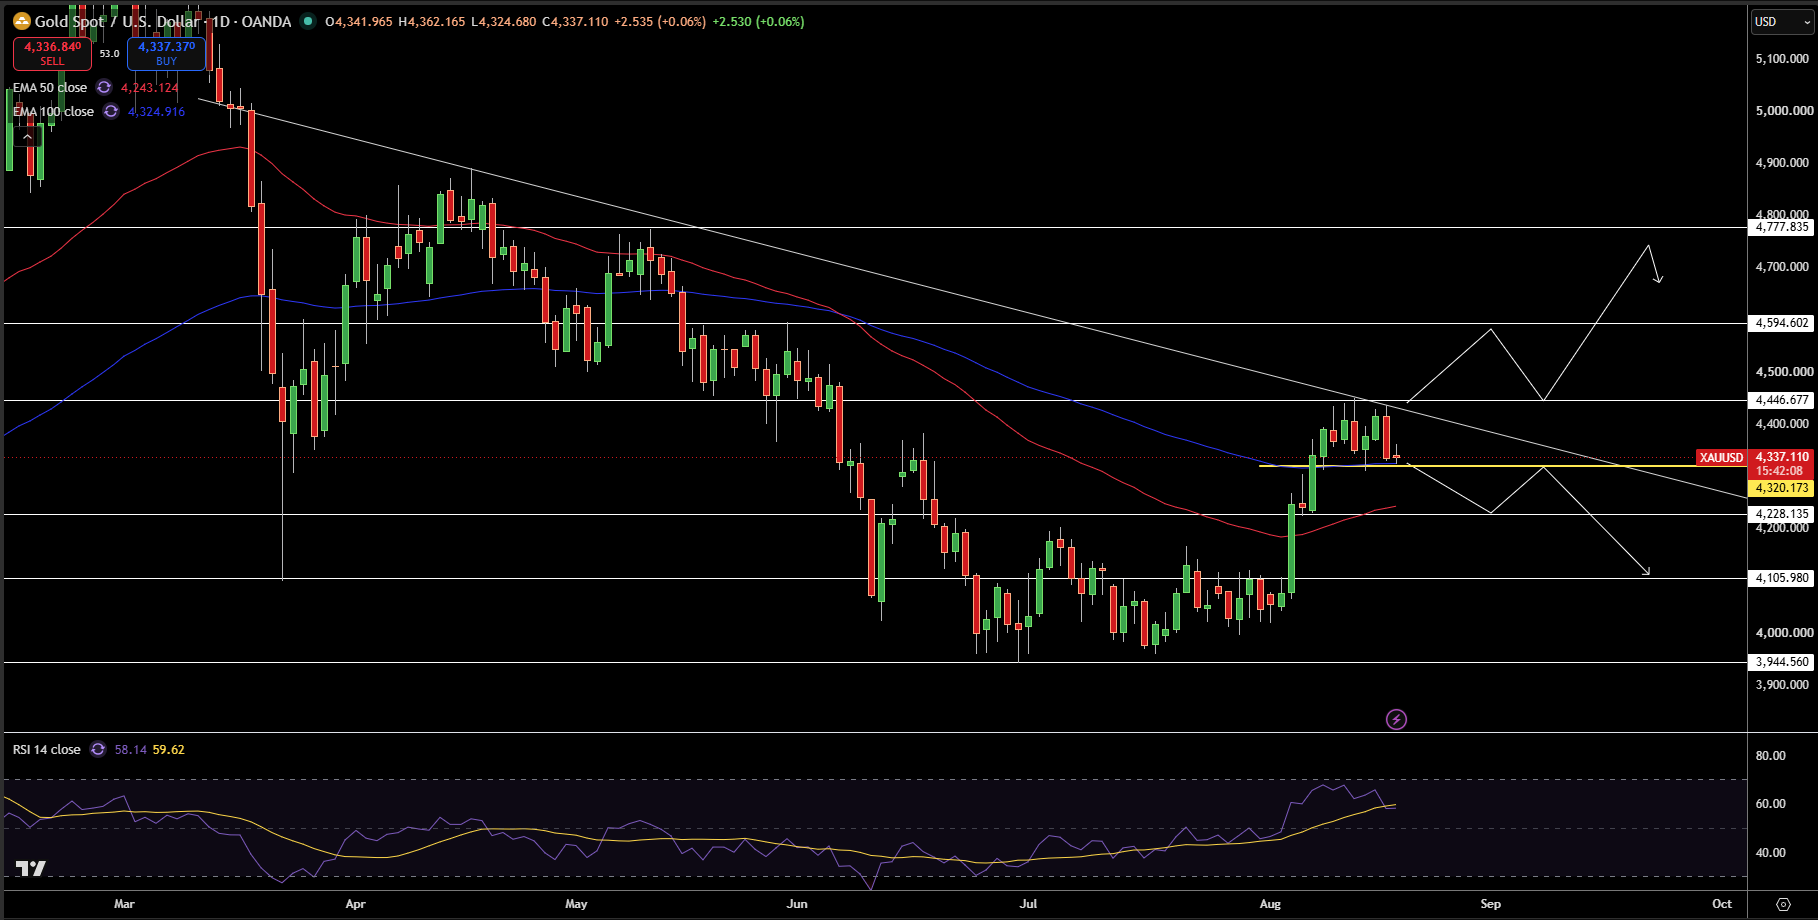
Gold has climbed to about $4,337 on the daily chart where it is above the 100-day EMA slightly below at $4,325 as well as the pivot around $4,320. The recovery from the July base continues to hold, but price remains under a long-standing falling trendline around $4,446. In light of the recovery and the structure, bulls are faced with the dilemma of whether to break out.
RSI remains around 58, which indicates bullish momentum while avoiding overbought levels. $4,446 is the first major resistance level, followed by $4,595 and $4,778. If we look on the other side, $4,320 to $4,325 is the first key support area and is followed by $4,228 and $4,106. In my view, a break over $4,320 continues to help the bullish case while a break of $4,228 would allow for the selling to accelerate.
Gold Price Forecast
Every new Gold analysis as it publishes, today's technical signal and key levels, live price — on one page.
See all Gold forecastsSilver Technical Analysis: XAG/USD Breaks Rising Channel as $62.75 Support Comes Under Pressure
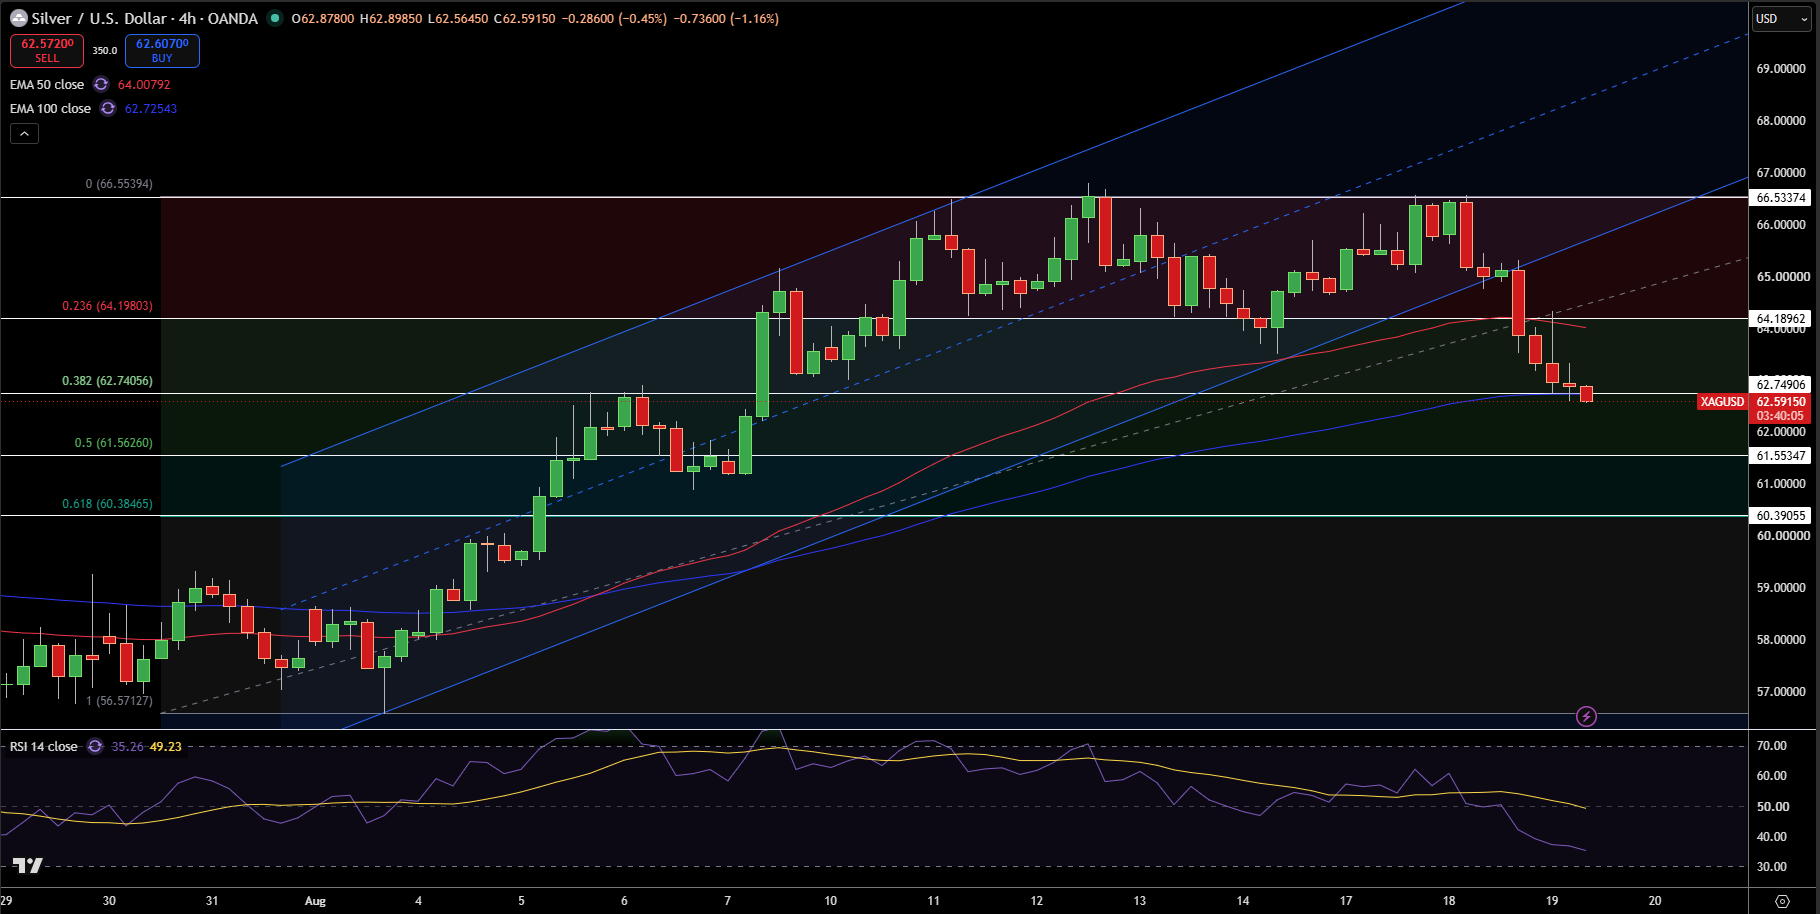
Silver is currently at $62.59 on the 4-hour chart after breaking below the lower bound of its rising channel and closing below the $62.75 area. Price is now also below the 50-EMA at $64.01 and over the 100-EMA at $62.73. The most recent price action has been bearish towards the $66.55 region.
RSI has now reached the 35 region, which makes this a strong bearish case and starts us in oversold territory. The first major resistance zone is $62.75, and beyond that is $64.20 and $66.55. The first significant support is $61.55, although support clusters quickly at $60.39 and the broader $59.00 region. As it stands, sub $62.75-$64.20 makes silver vulnerable. A silver recover to $64.20 and higher would be more bullish, whereas a slip to $62.75 would encourage a slip of the price toward $61.55 and even $60.39.