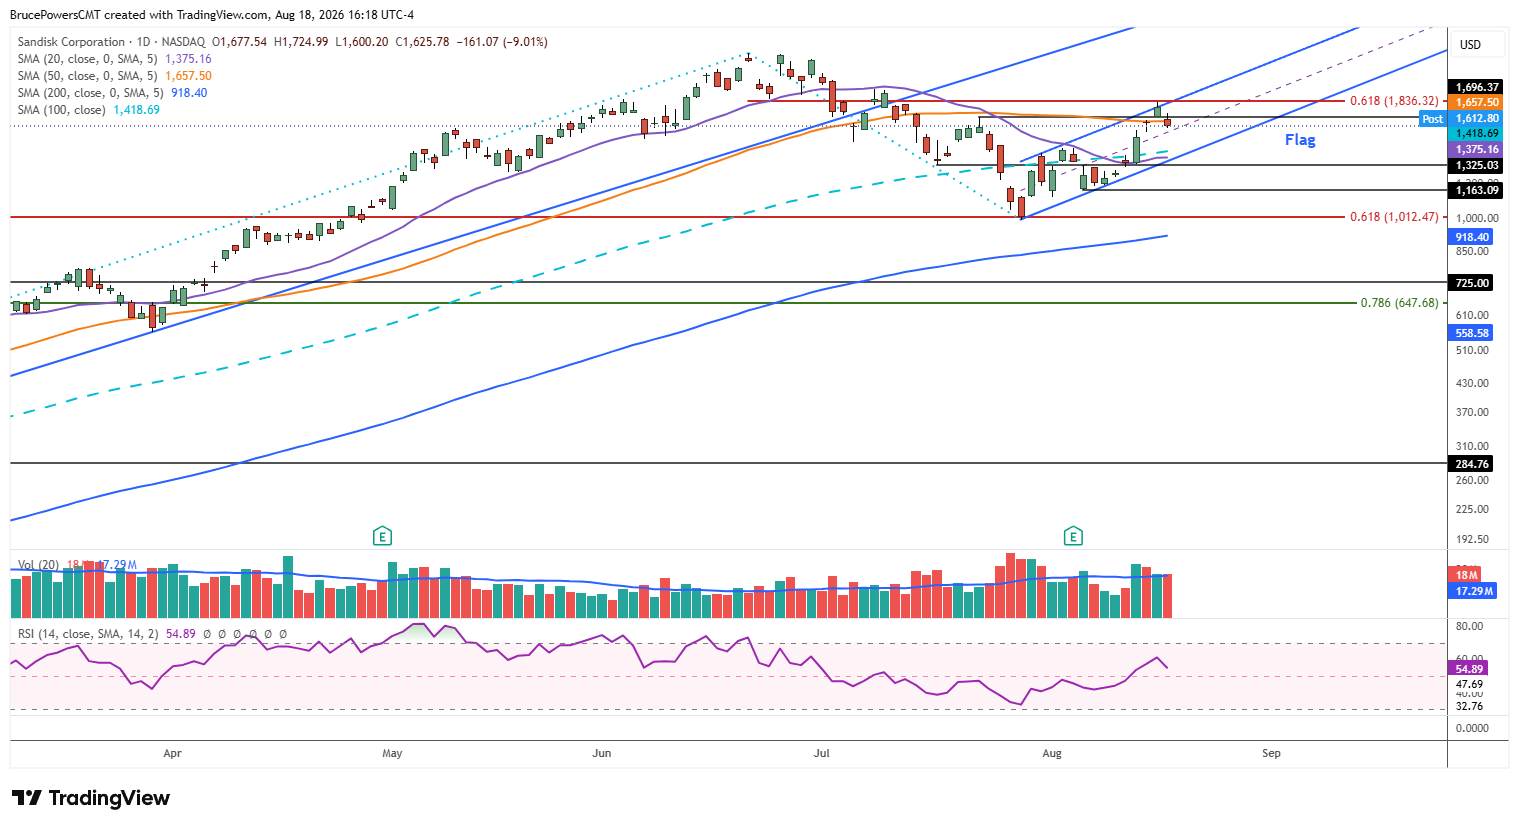
There are a couple of ways to consider the stock of Sandisk Corporation (SNDK), a leader in NAND flash technology, from a technical perspective. Either the recent advance will exhaust itself and lead to an eventual second leg down for the bearish correction, or recent signs of strength that followed the late-July low of $1,012.47 will be retained overall.

Rebound Builds Momentum
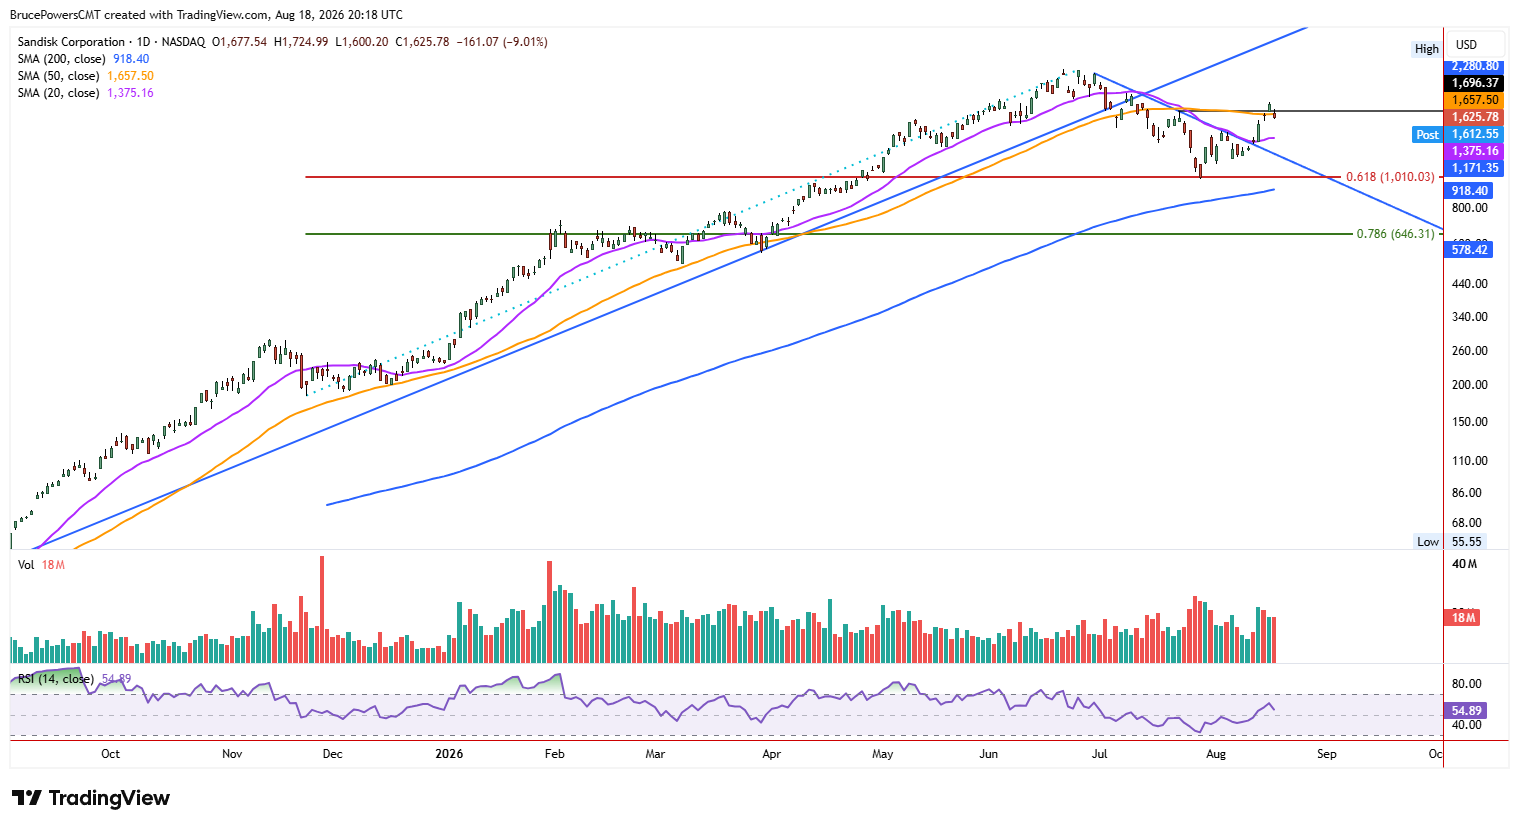
The July low completed a 61.8% Fibonacci retracement of a prior advance, and it was followed by a counter-trend rally into an initial key potential resistance zone this week. Strength during the advance was indicated by a reclaim of key moving averages, including the 20-day and 100-day moving averages, while a trend reversal signal triggered on Monday with a rally above the lower swing high of $1,696.37 from mid-June.
Resistance Comes Into Focus
SNDK reached a high of $1,827.99 for the advance on Monday, completing a 61.8% Fibonacci retracement of the prior decline and testing resistance at the top boundary of a rising short-term channel. Moreover, a one-day reclaim of the 50-day moving average failed on Tuesday as the stock weakened. This confluence of resistance increases the risk that the recent advance was corrective rather than the start of a sustained new uptrend, making lower initial potential support zones more likely to be tested before buyers take back control in any meaningful way.
A Flag With a Larger Question
The counter-trend rally in SNDK has taken the form of a rising channel and therefore can be viewed as a potential bearish flag, given its position in the larger trend structure. Monday’s high completed the first pullback to test the 50-day moving average as resistance after it had previously represented dynamic support for the uptrend until a breakdown occurred in mid-July. The 50-day moving average is particularly significant because SNDK has traded above it since it was reclaimed a year ago in August 2025. A sustained failure to regain it would therefore represent a notable change in the stock’s longer-term technical behavior.
Support Holds Key to Next Leg
Regardless of the longer-term implications of this week’s high, key support lies near the lower boundary of the rising channel. The 100-day moving average near $1,419.69 and the 20-day moving average around $1,375.16 provide reference points for that boundary area. A decisive decline below this moving-average support zone, followed by a break of the prior daily low of $1,308.53, would signal a breakdown of the flag formation and increase the likelihood of a second leg down following the $2,354.39 peak in June. That would favor the first scenario outlined above, while a successful defense of support and renewed strength would keep the bullish interpretation alive.