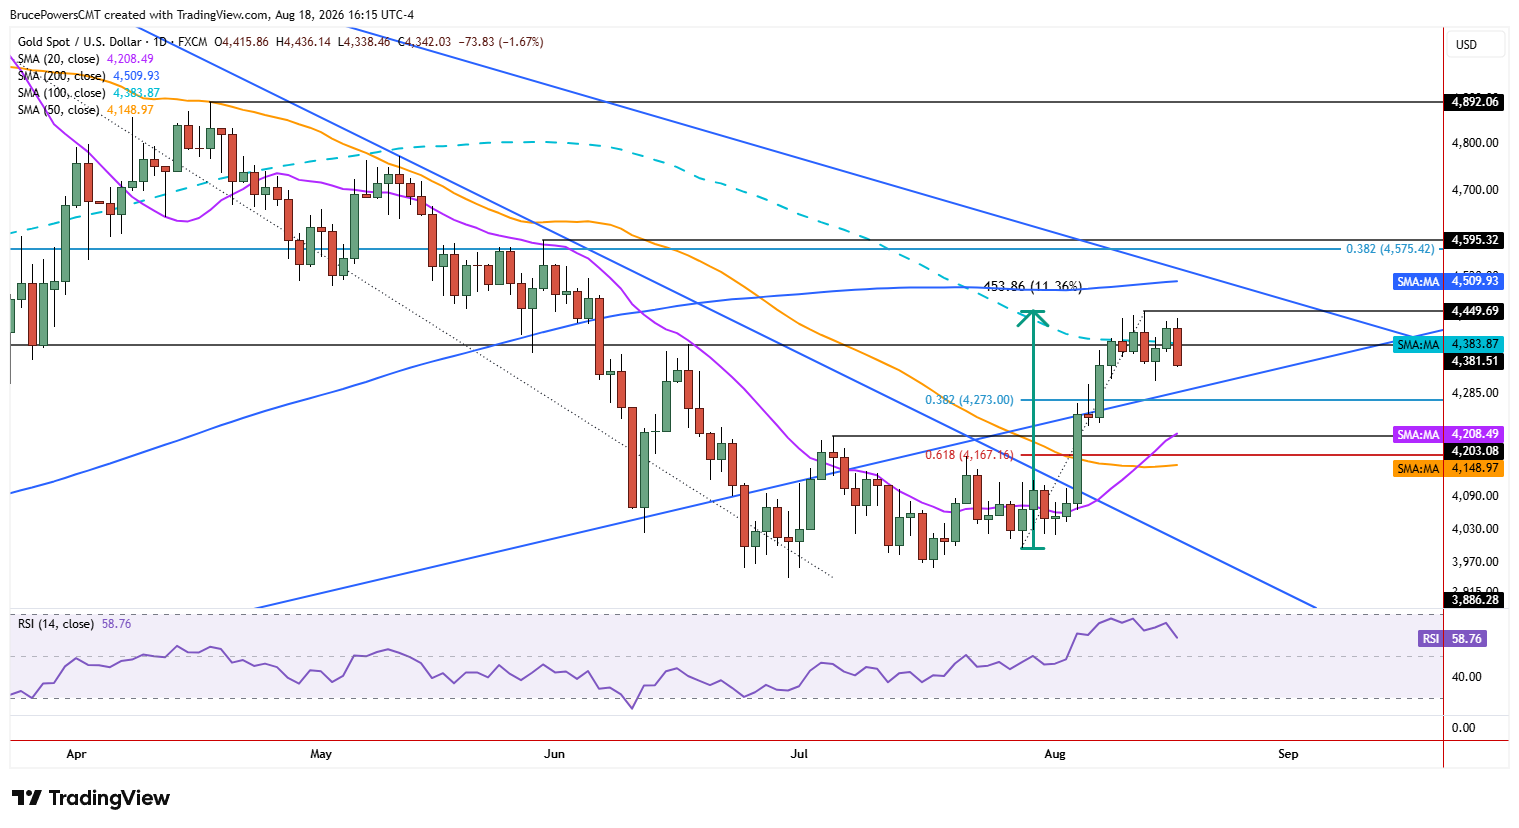
Gold established a lower swing high of $4,436 on Tuesday along with several other short-term bearish indications. The reclaim of the 100-day moving average that occurred on Monday failed on Tuesday since a one-day bearish reversal triggered, and the session is set to close below Monday’s low of $4,367. That would complete a bearish outside day and put last week’s higher swing low of $4,311 at risk of failure as support. Having said that, price action is contained within a short-term consolidation pattern, and therefore the implications need further confirmation. For now, the pattern leaves room for either a deeper pullback or another attempt to break higher.

Consolidation Keeps Breakout Case Alive
A relatively narrow range seven-day consolidation pattern has been testing resistance near the lower swing high of $4,382 and the 100-day moving average at $4,384. Consistent upward pressure during its formation suggests the potential for an extension above $4,450. Given Tuesday’s lower swing high of $4,436, an earlier sign of strength is indicated. The next upside target is the 200-day moving average near $4,510, along with the downtrend line. Potential resistance from structure is near the lower swing high of $4,595, supported by the 38.2% Fibonacci retracement at $4,575. A sustained breakout above the consolidation would therefore shift attention toward this higher resistance zone.
$4,311 Defines Downside Risk
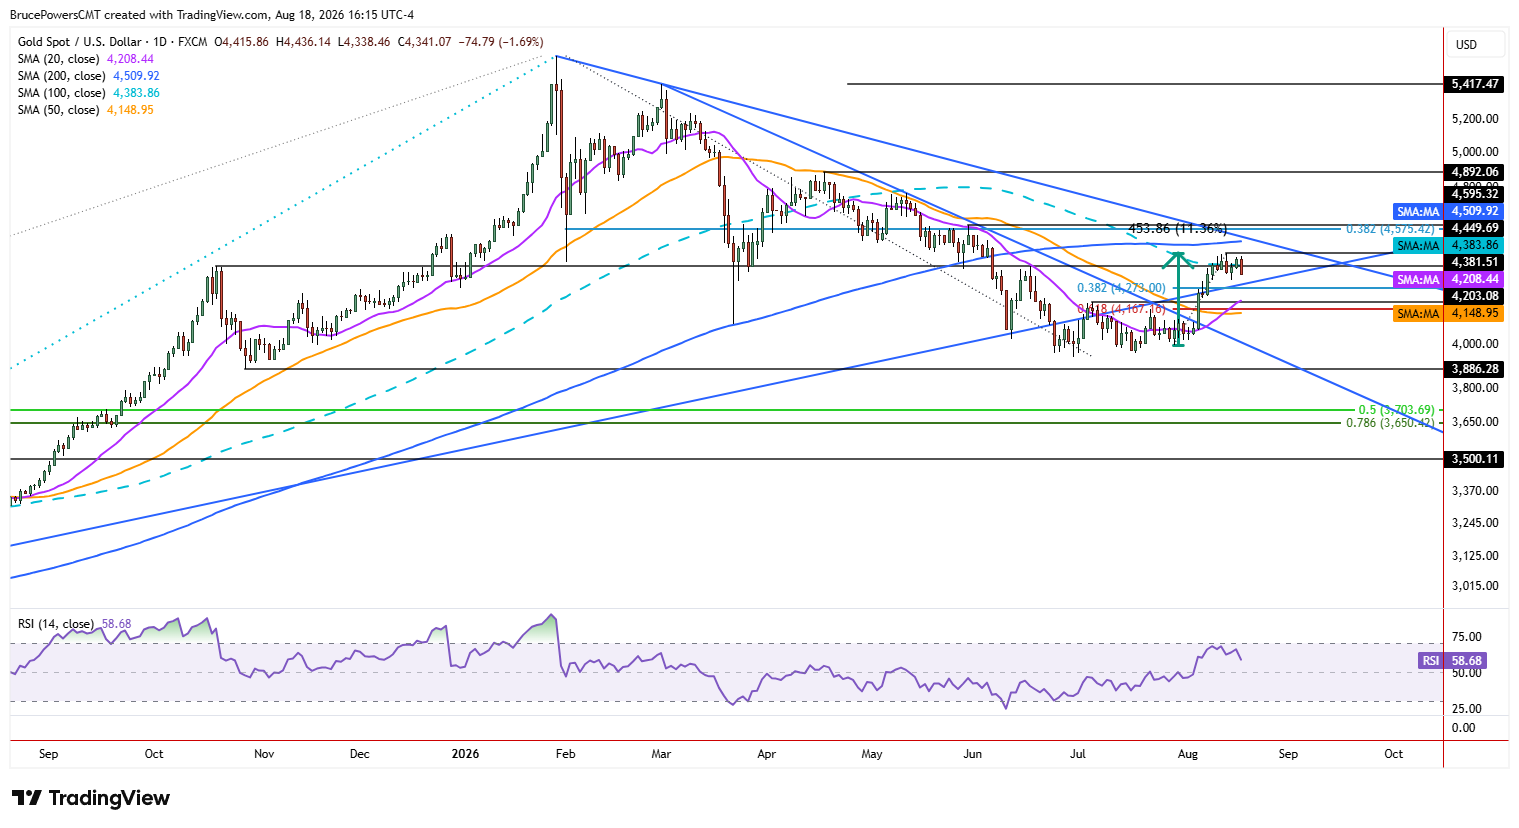
Last week’s higher swing low at $4,311 is key support since a decline below it puts gold in a position to possibly test lower support levels. Several potential support areas stand out if a deeper pullback occurs. The 38.2% Fibonacci retracement is at $4,273 and supported by an uptrend line. A bullish reversal signal occurred during the recent advance above the lower swing high of $4,203 from early July, and it now may represent support. Then there is the 61.8% Fibonacci retracement of the prior advance at $4,167. These levels provide progressively lower areas where buyers could attempt to regain control if $4,311 fails.
200-Day Moving Average Holds Bigger Clue
The current advance is the first notable pullback to test the 200-day moving average as resistance since gold broke below it in early June. Therefore, signs of resistance are anticipated on the first approach. However, given the signs of sustained strength in the current rally, there is also the possibility that the 200-day moving average is reclaimed. There has been only one leg up from the recent bottom so far, and a measured move for a second leg up before a notable pullback would suggest a target clearly above the 200-day moving average. That possibility keeps the bullish case alive despite Tuesday’s reversal, making $4,311 the key level to watch as the consolidation resolves.