Last week’s release of employment data negatively impacted the stock market, while gold (XAU) remained steady above key levels. The data indicates rising inflation expectations, suggesting the Fed will delay rate cuts. Gold’s strength comes from its role as a hedge against inflation, and ongoing uncertainty around interest rates supports its appeal.
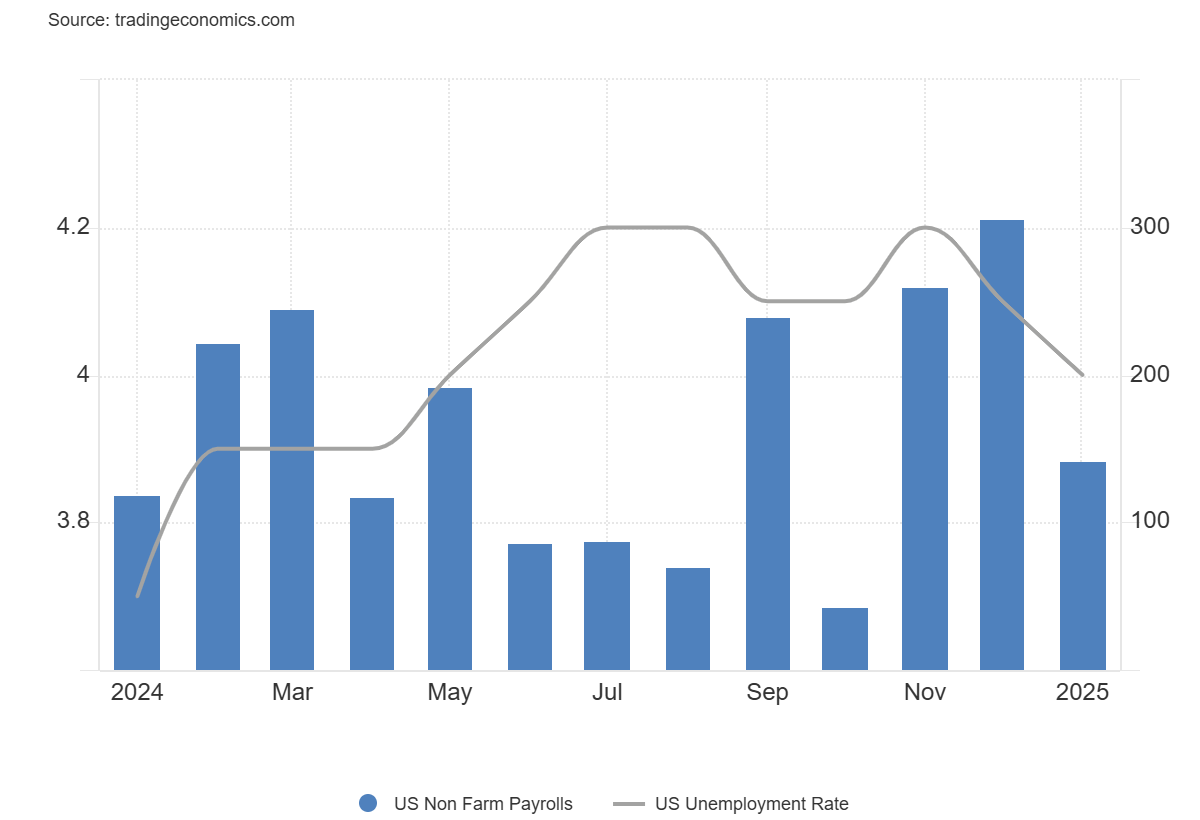
The employment data was mixed, with job growth in January at a modest 143K, while the unemployment rate fell to 4.0%, as shown in the chart below.
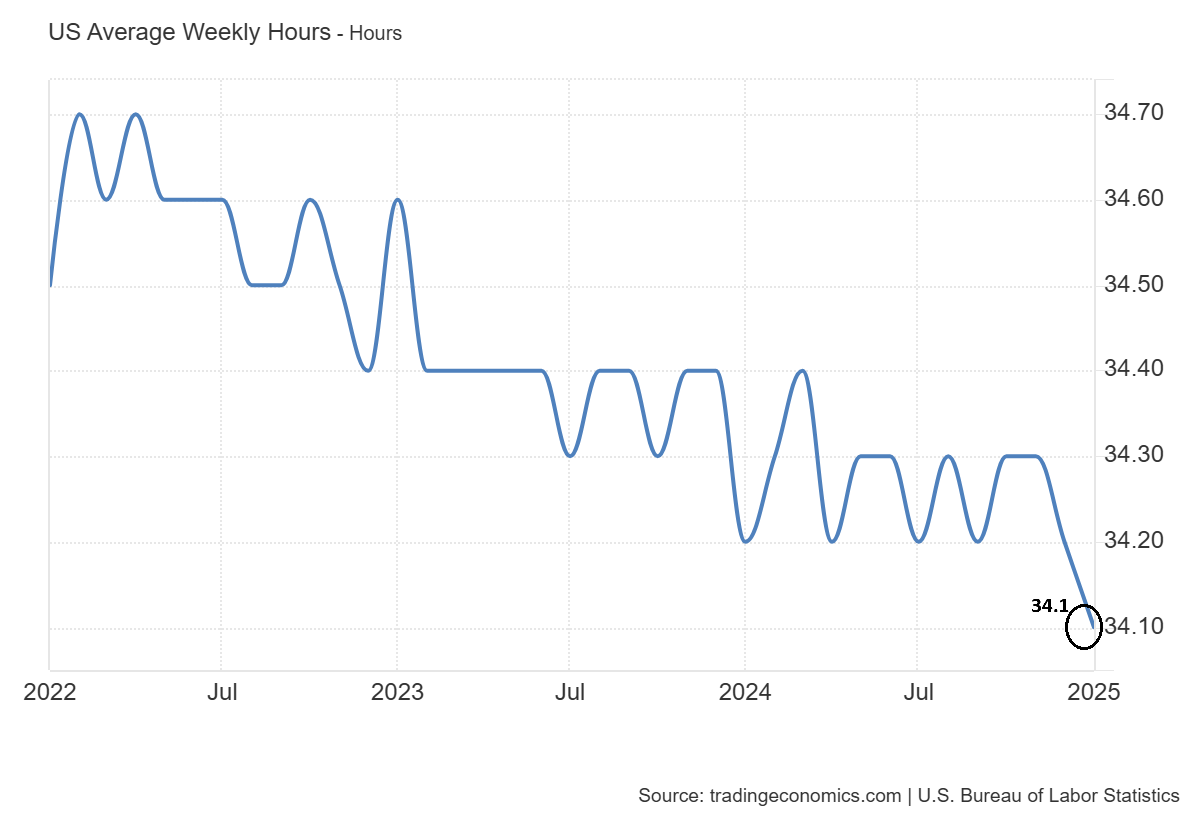
On the other hand, a drop in average weekly hours to 34.1 signals potential layoffs ahead.
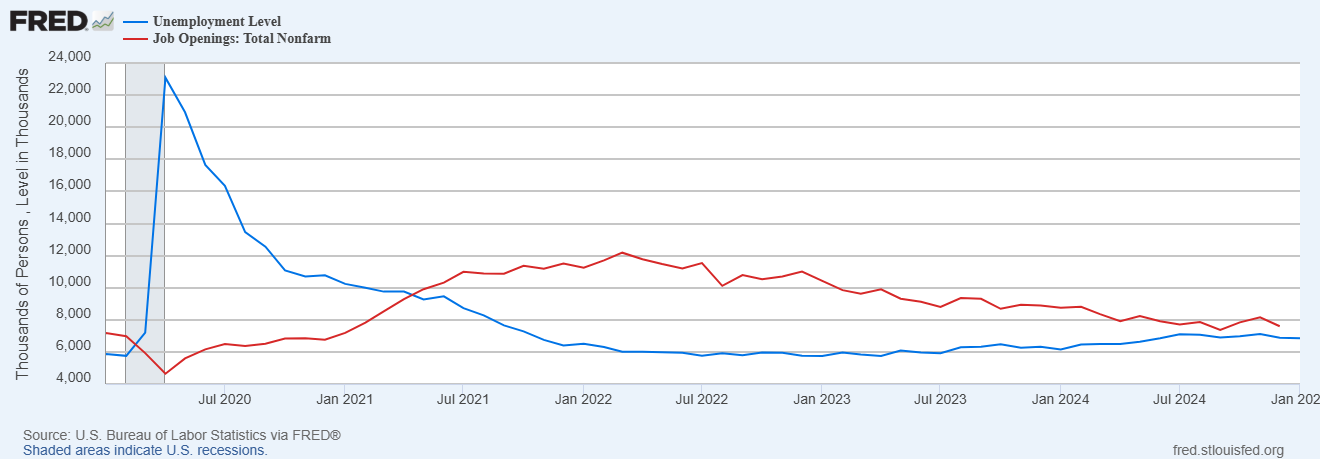
However, the JOLTS report contradicts the drop in the average weekly hours, showing more job openings than unemployed workers. The chart below shows that there are more job openings than unemployed workers. This uncertainty complicates the Fed’s decision-making.
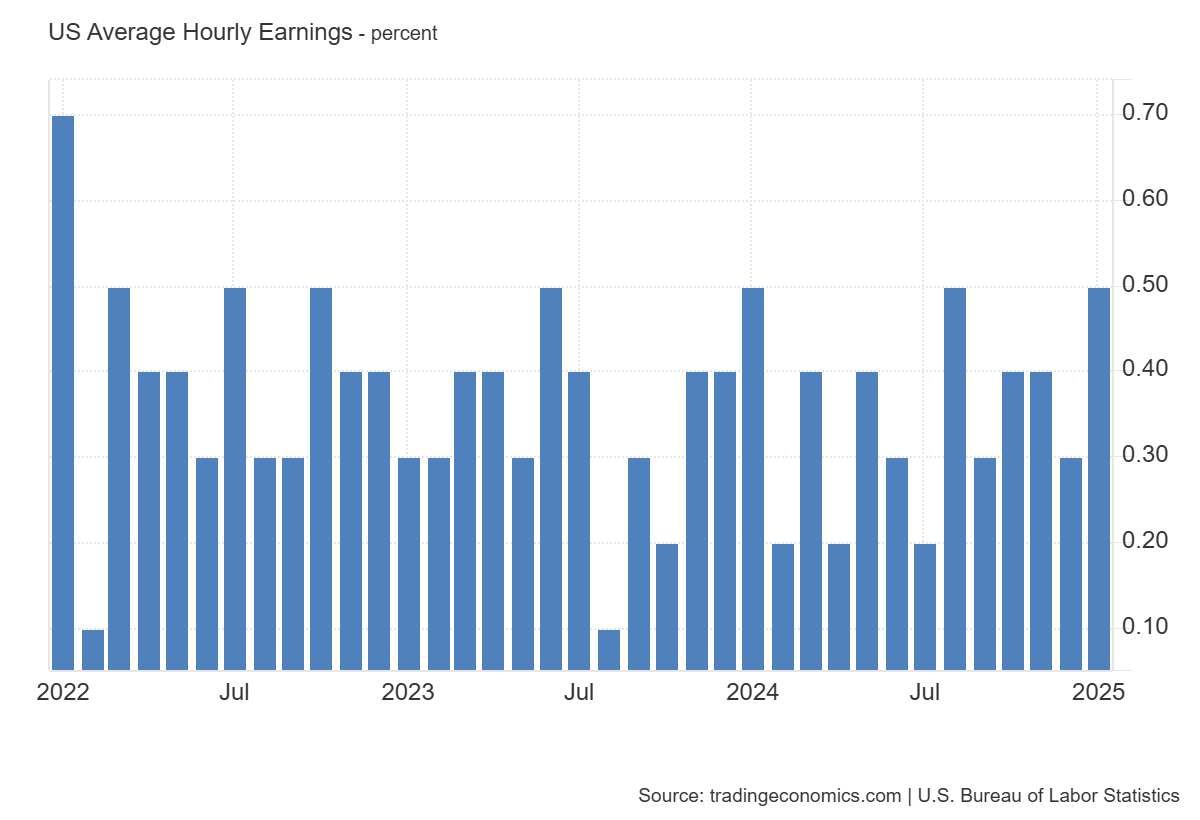
The chart below shows that average hourly earnings increased by 0.5% in January, with a 4.1% year-over-year increase. This sharp increase signals inflation concerns. If wages continue rising, consumer spending could drive further inflation. This reduces the likelihood of early rate cuts, keeping interest rates stable.
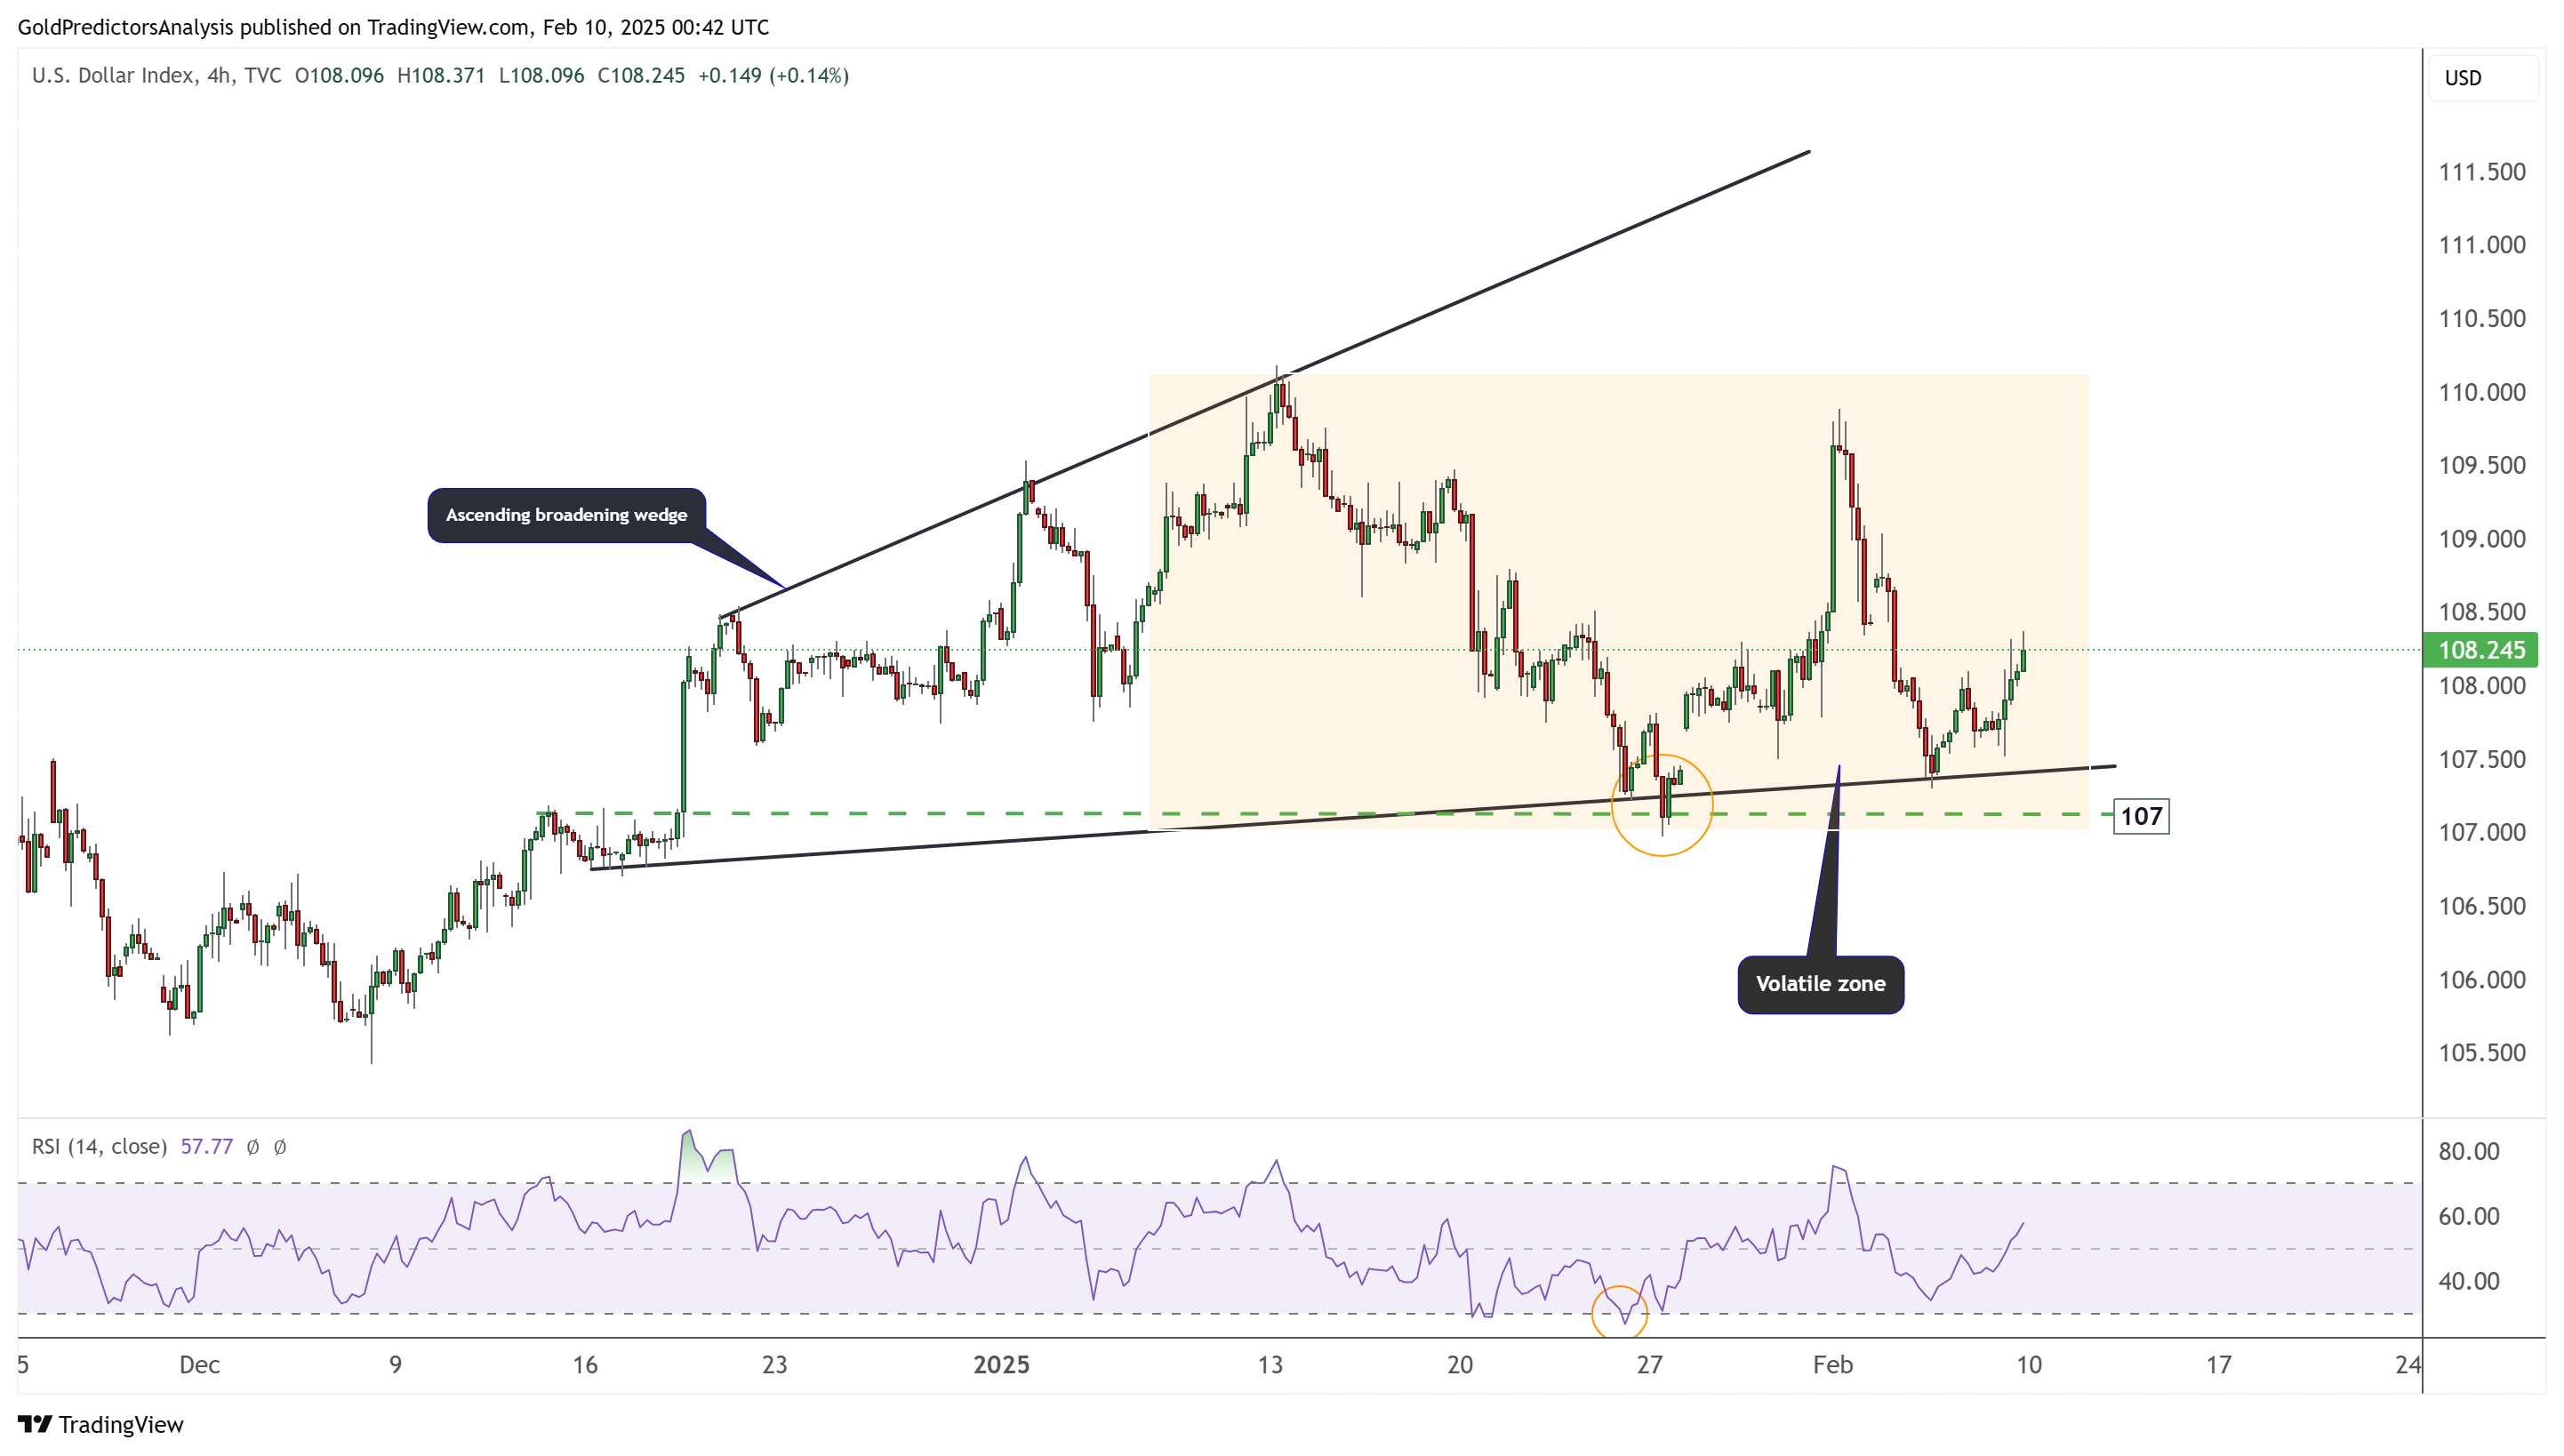
This phenomenon strengthens the dollar, which recently tested resistance at 108, with a potential breakout targeting 110. However, recent tariff concerns have added volatility to the US dollar.
On the other hand, gold is retracing toward support levels, but the overall trend remains bullish. Rising inflation expectations and foreign central bank gold purchases will likely sustain demand. The physical gold market remains tight, reinforcing the metal’s long-term uptrend. This week’s release of CPI and PPI data will provide further direction on U.S. inflation and impact interest rate decisions.

Gold (XAU) Technical Analysis
Gold Daily Chart – Bullish Momentum
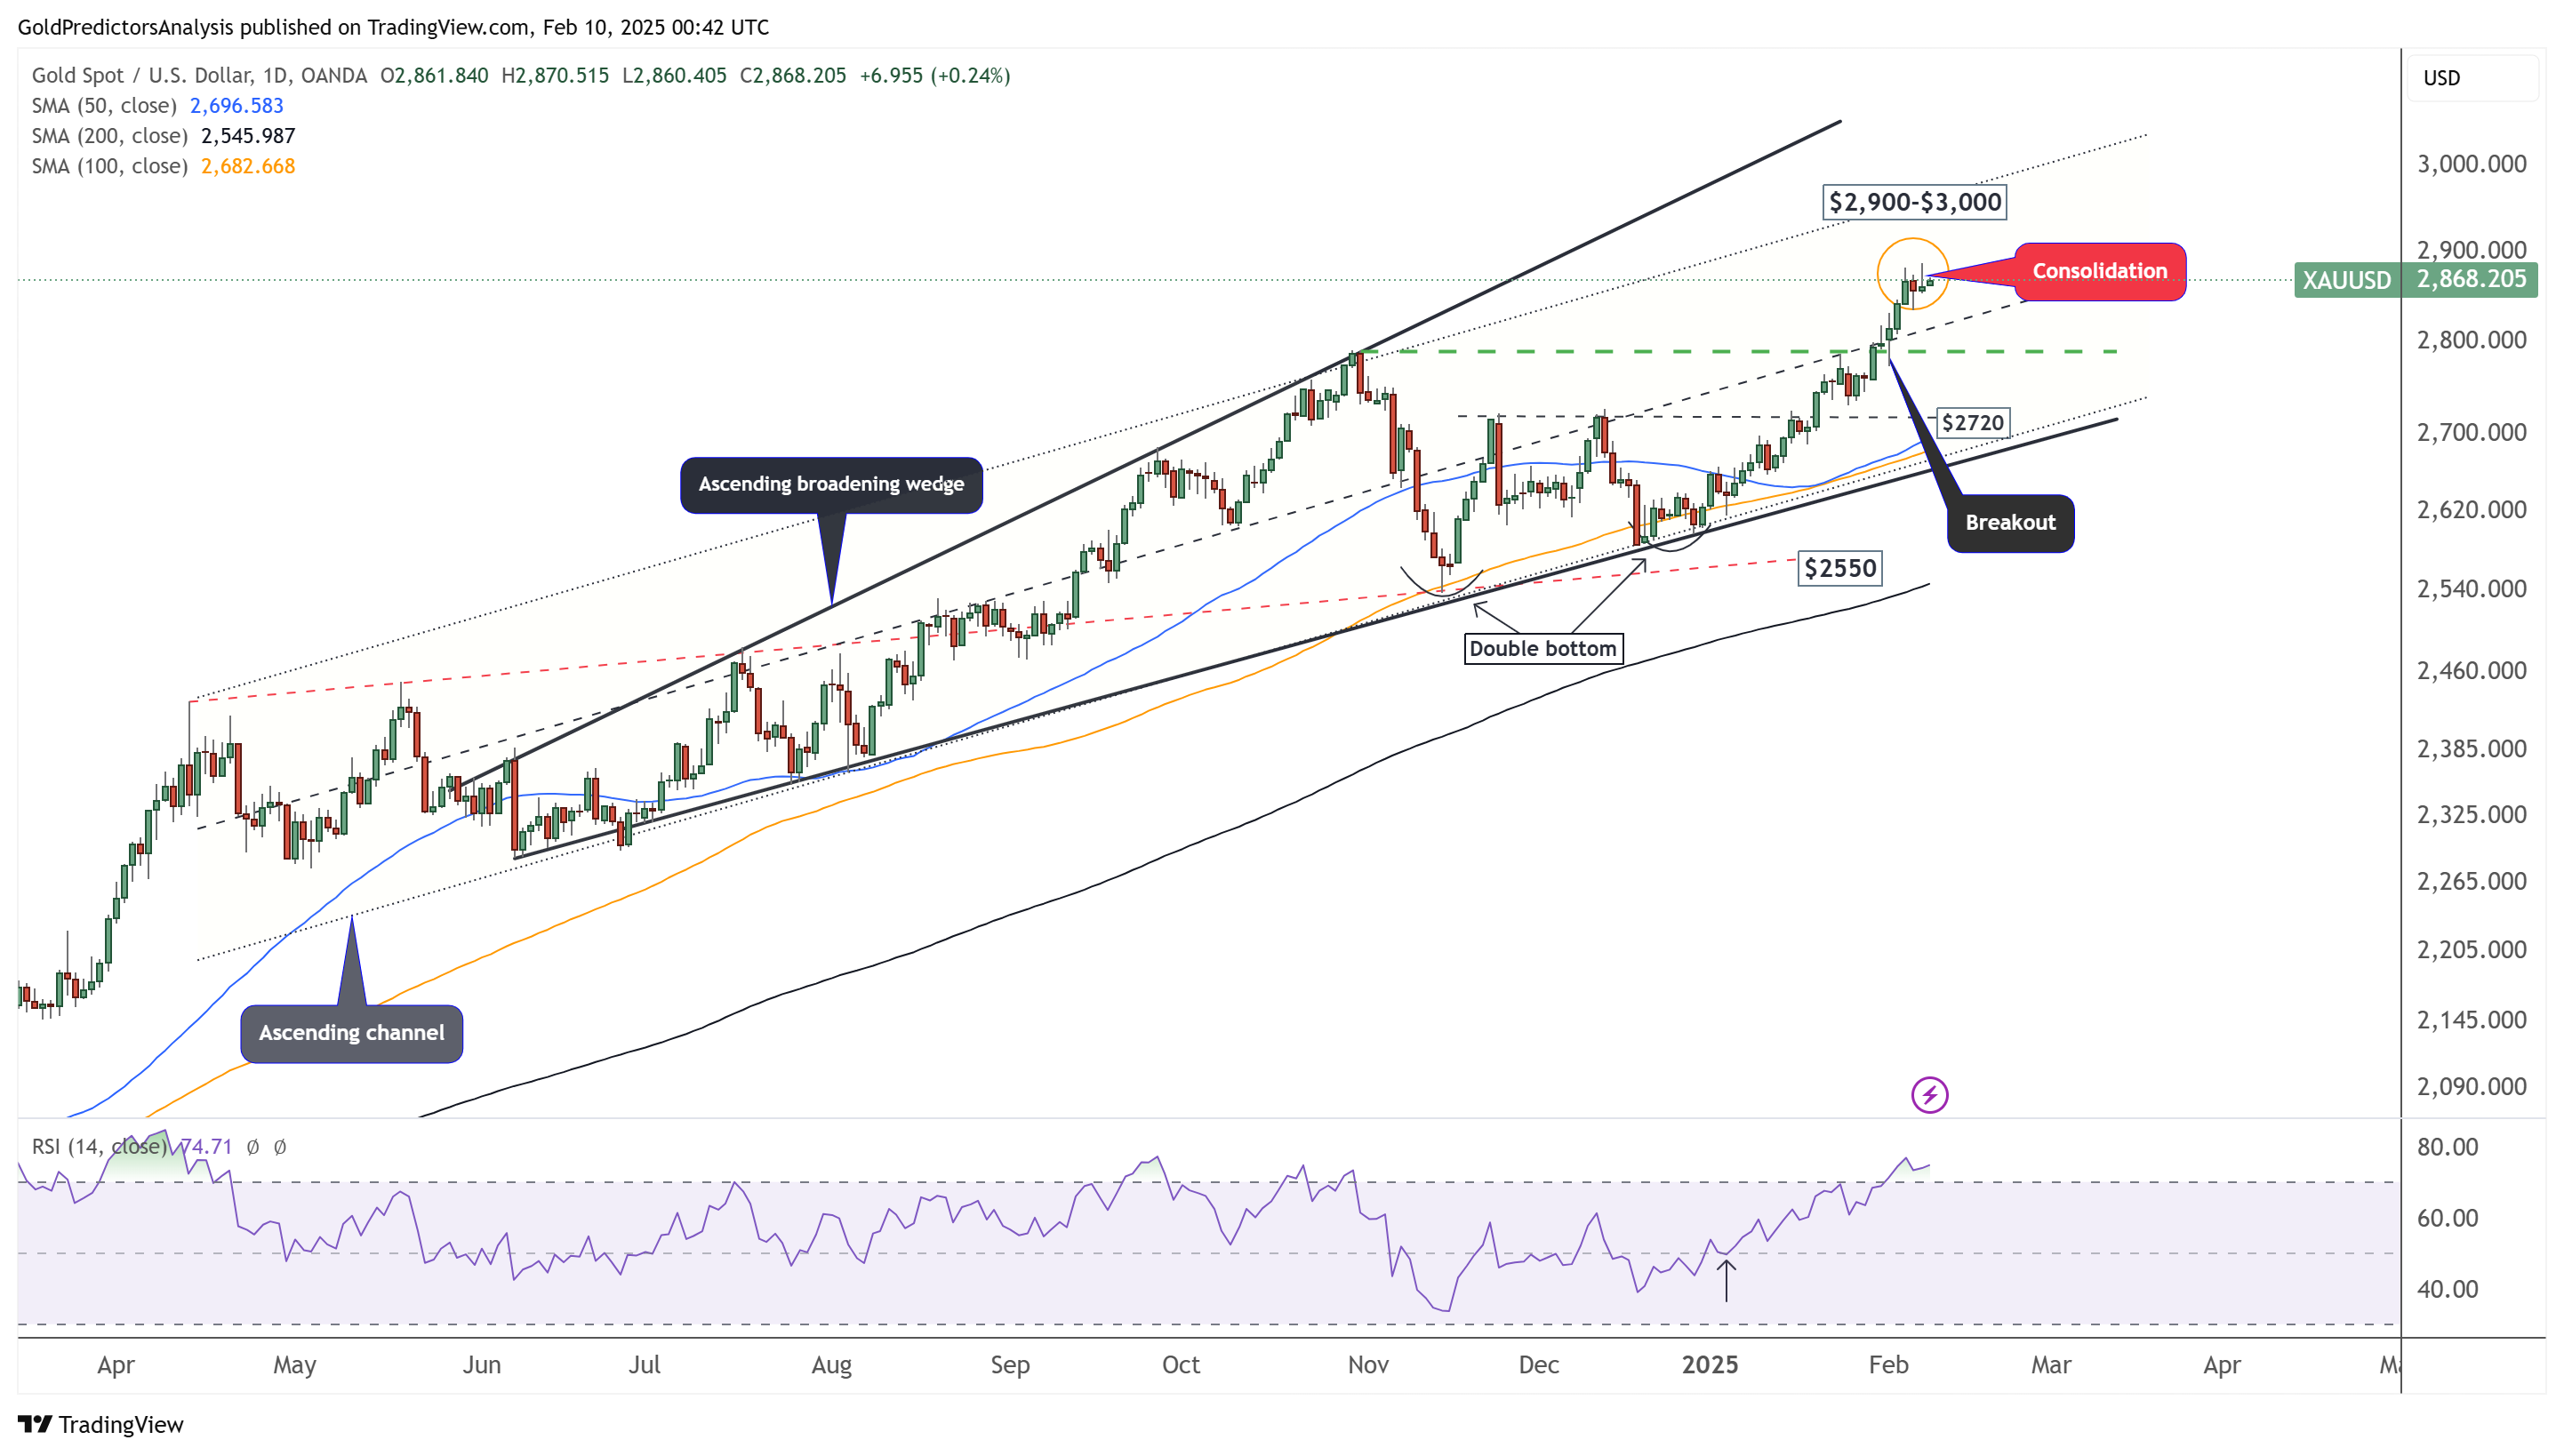
The daily chart for gold shows that the price trades within an ascending broadening wedge pattern and continues to move higher. The price correction from the record level on Friday suggests further consolidation before continuing the upward move.
The breakout from $2,795 indicates that gold will likely continue toward the $3,000 price zone. However, the RSI has reached its highest level since September 26, 2024, signaling a possible price correction before the next move. Strong support remains at the $2,795 zone. This price correction from record levels might be a good strategy to execute a trade in gold.
Gold Price Forecast
Every new Gold analysis as it publishes, today's technical signal and key levels, live price — on one page.
See all Gold forecastsGold 4-Hour Chart – Ascending Channel
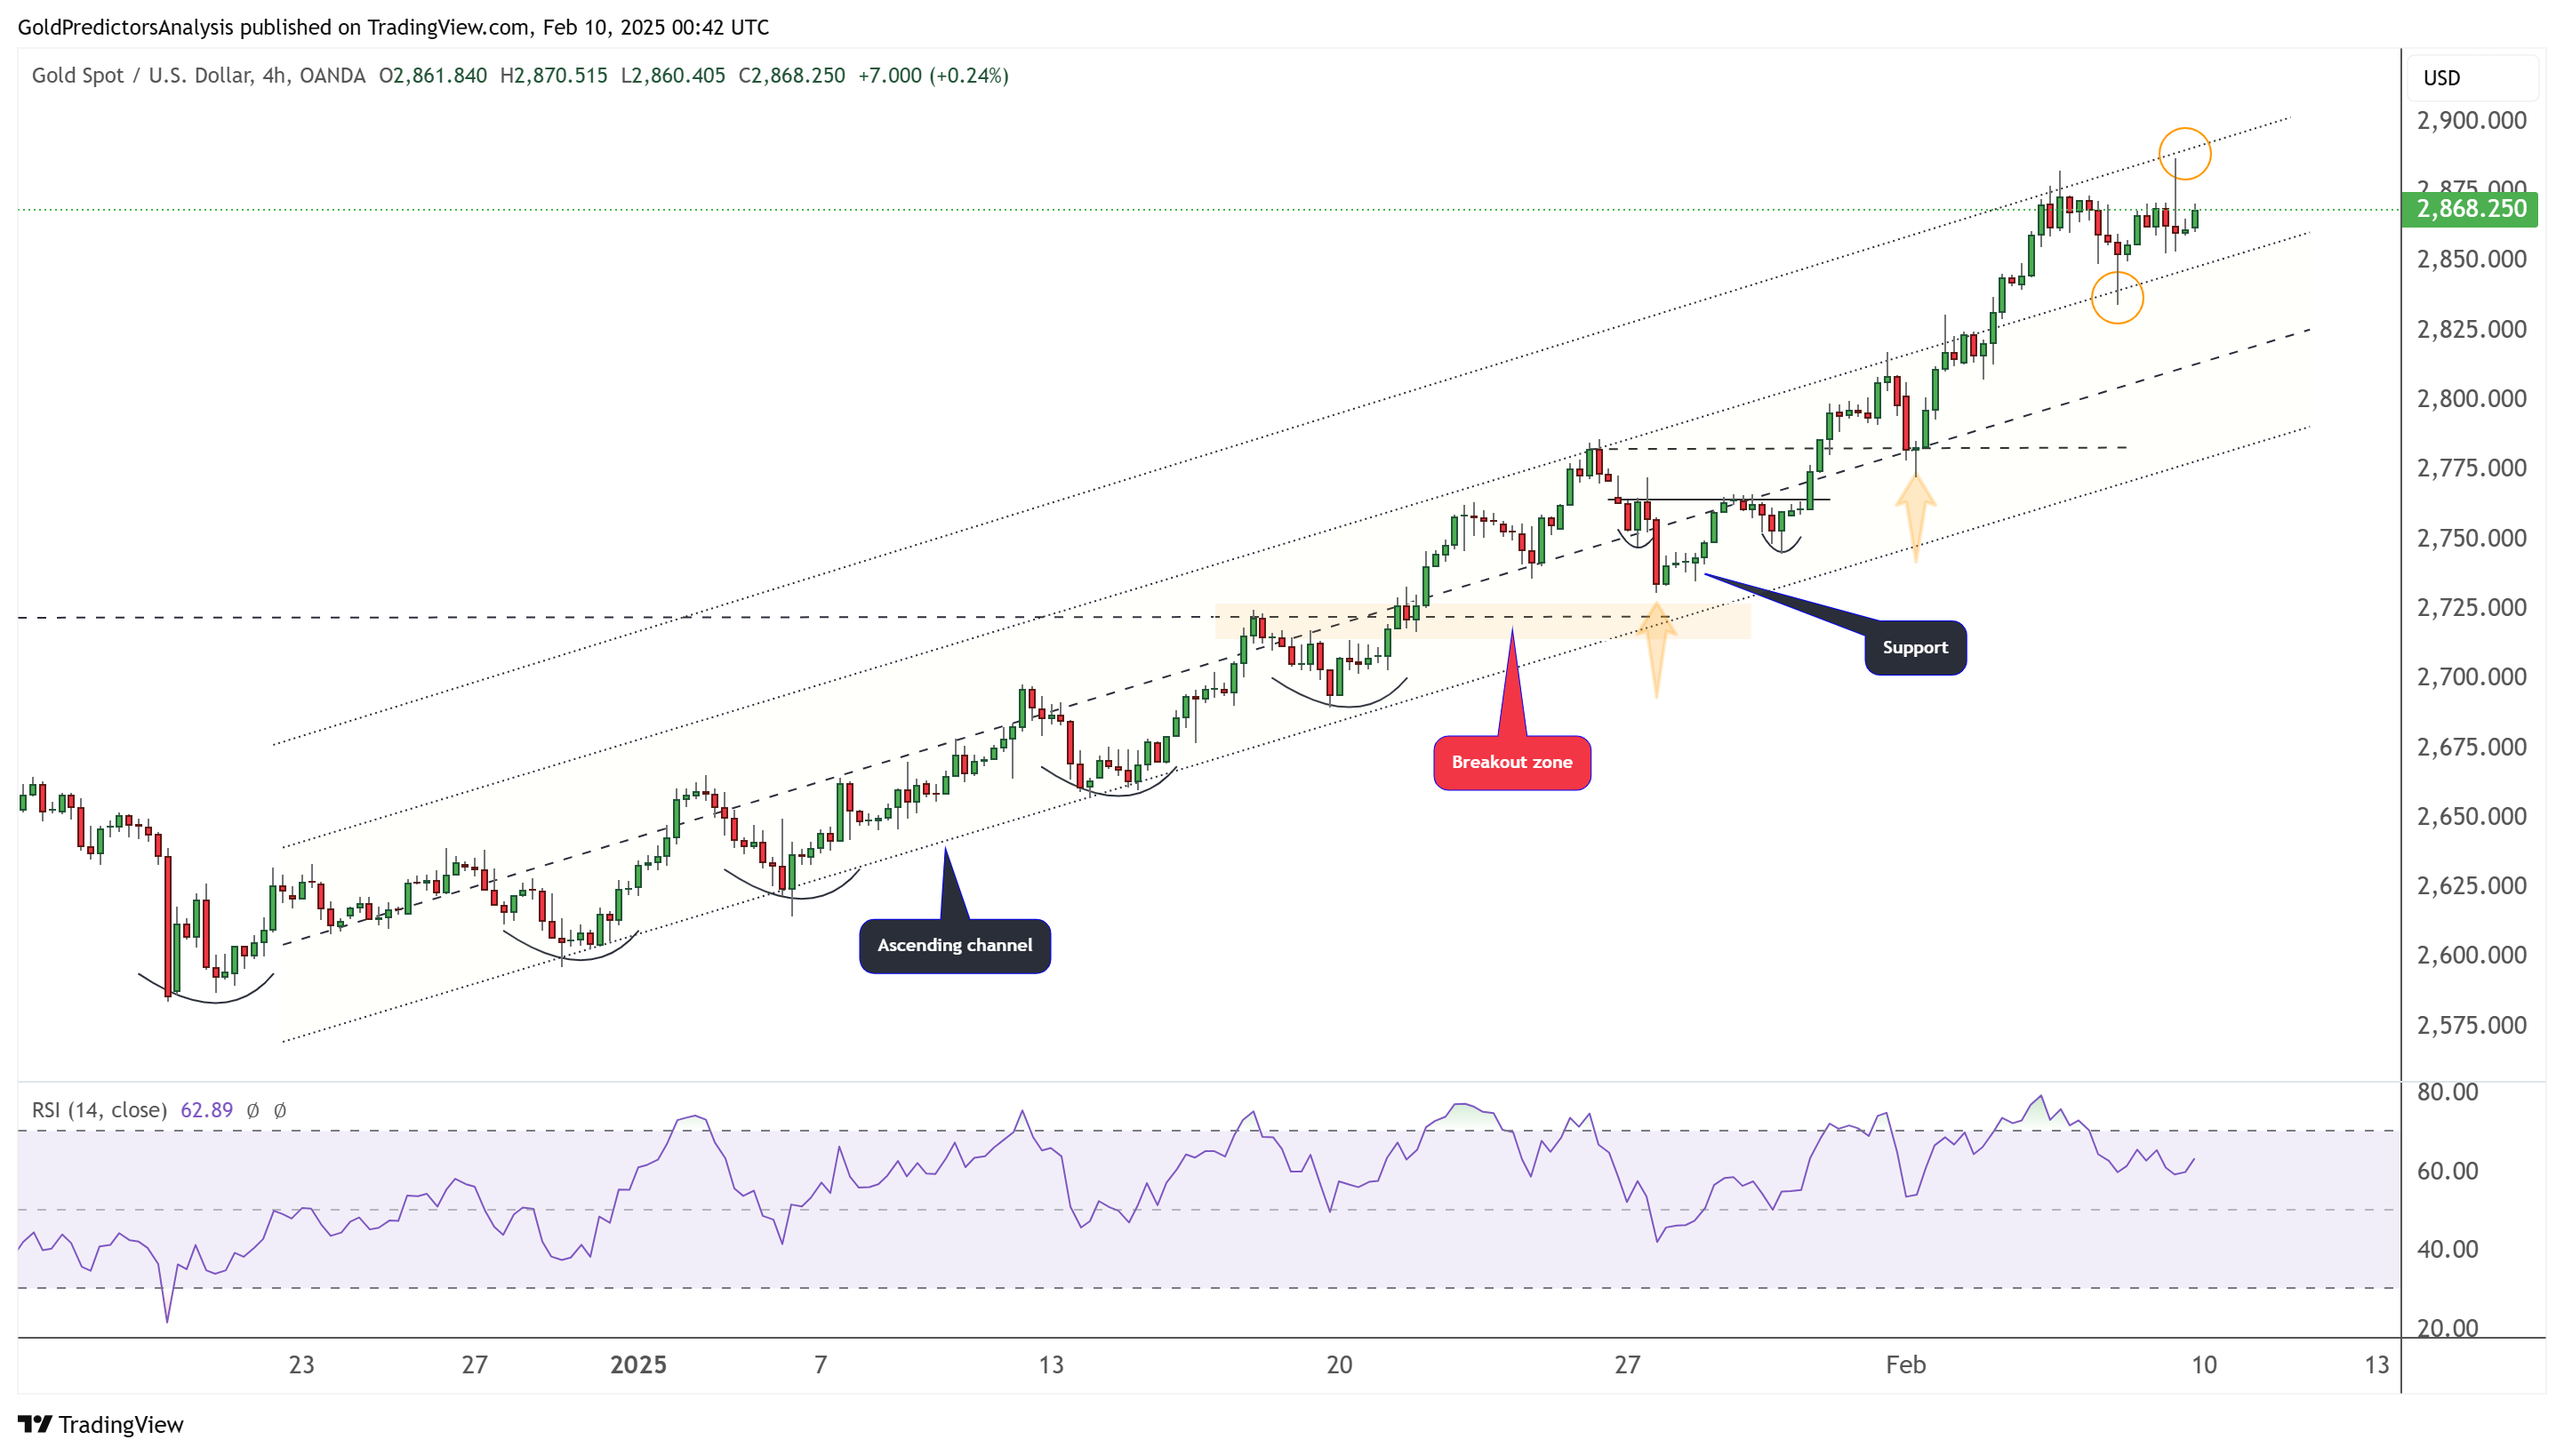
The 4-hour chart for gold shows that the price has hit the extended level of the ascending channel at $2,886 and is consolidating above the ascending channel support. The RSI is correcting lower as the price pulls back from the resistance zone. However, the trend remains upward, and the price will likely continue higher after the correction. Immediate support levels for spot gold remain at $2,820 and $2,795.
Silver (XAG) Technical Analysis
Silver Daily Chart – Bearish Hammer
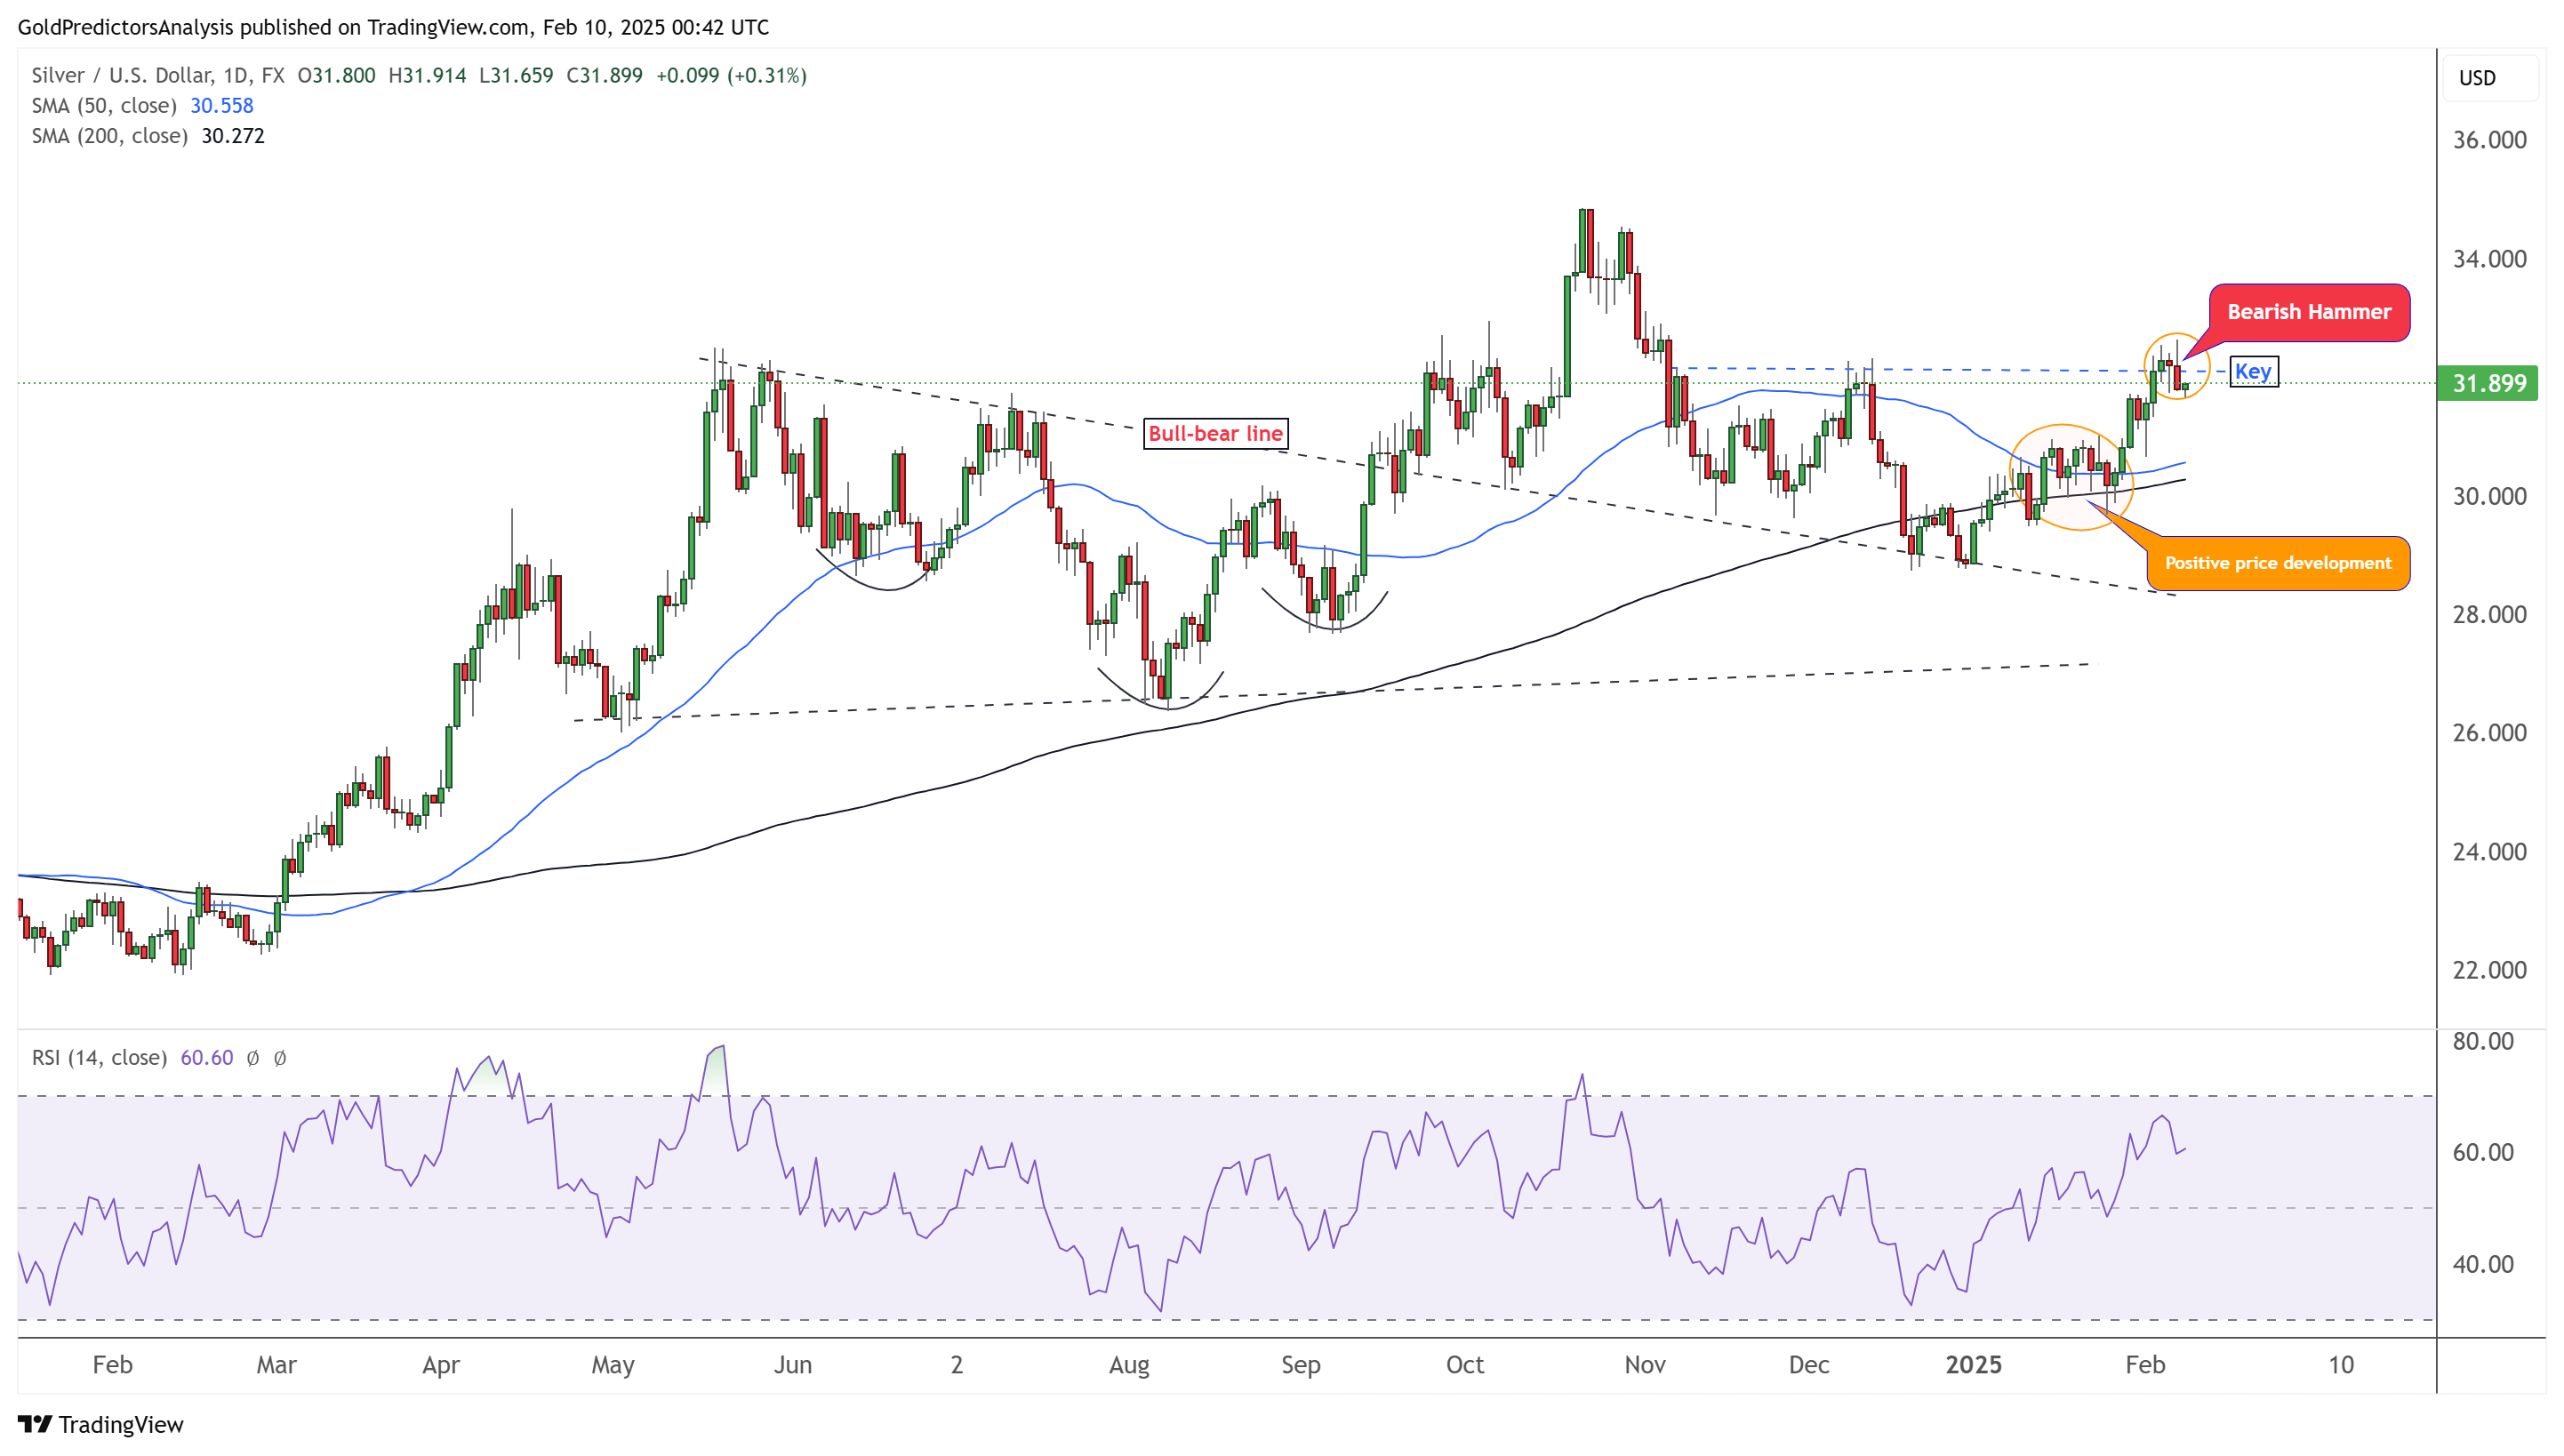
Friday’s price correction in the silver (XAG) market formed a bearish hammer on the daily chart. This pattern suggests that silver may correct lower before the next move. The price failed to break above the $32.50 level. However, the overall trend remains upward.
Silver 4-hour Chart – Key Zone
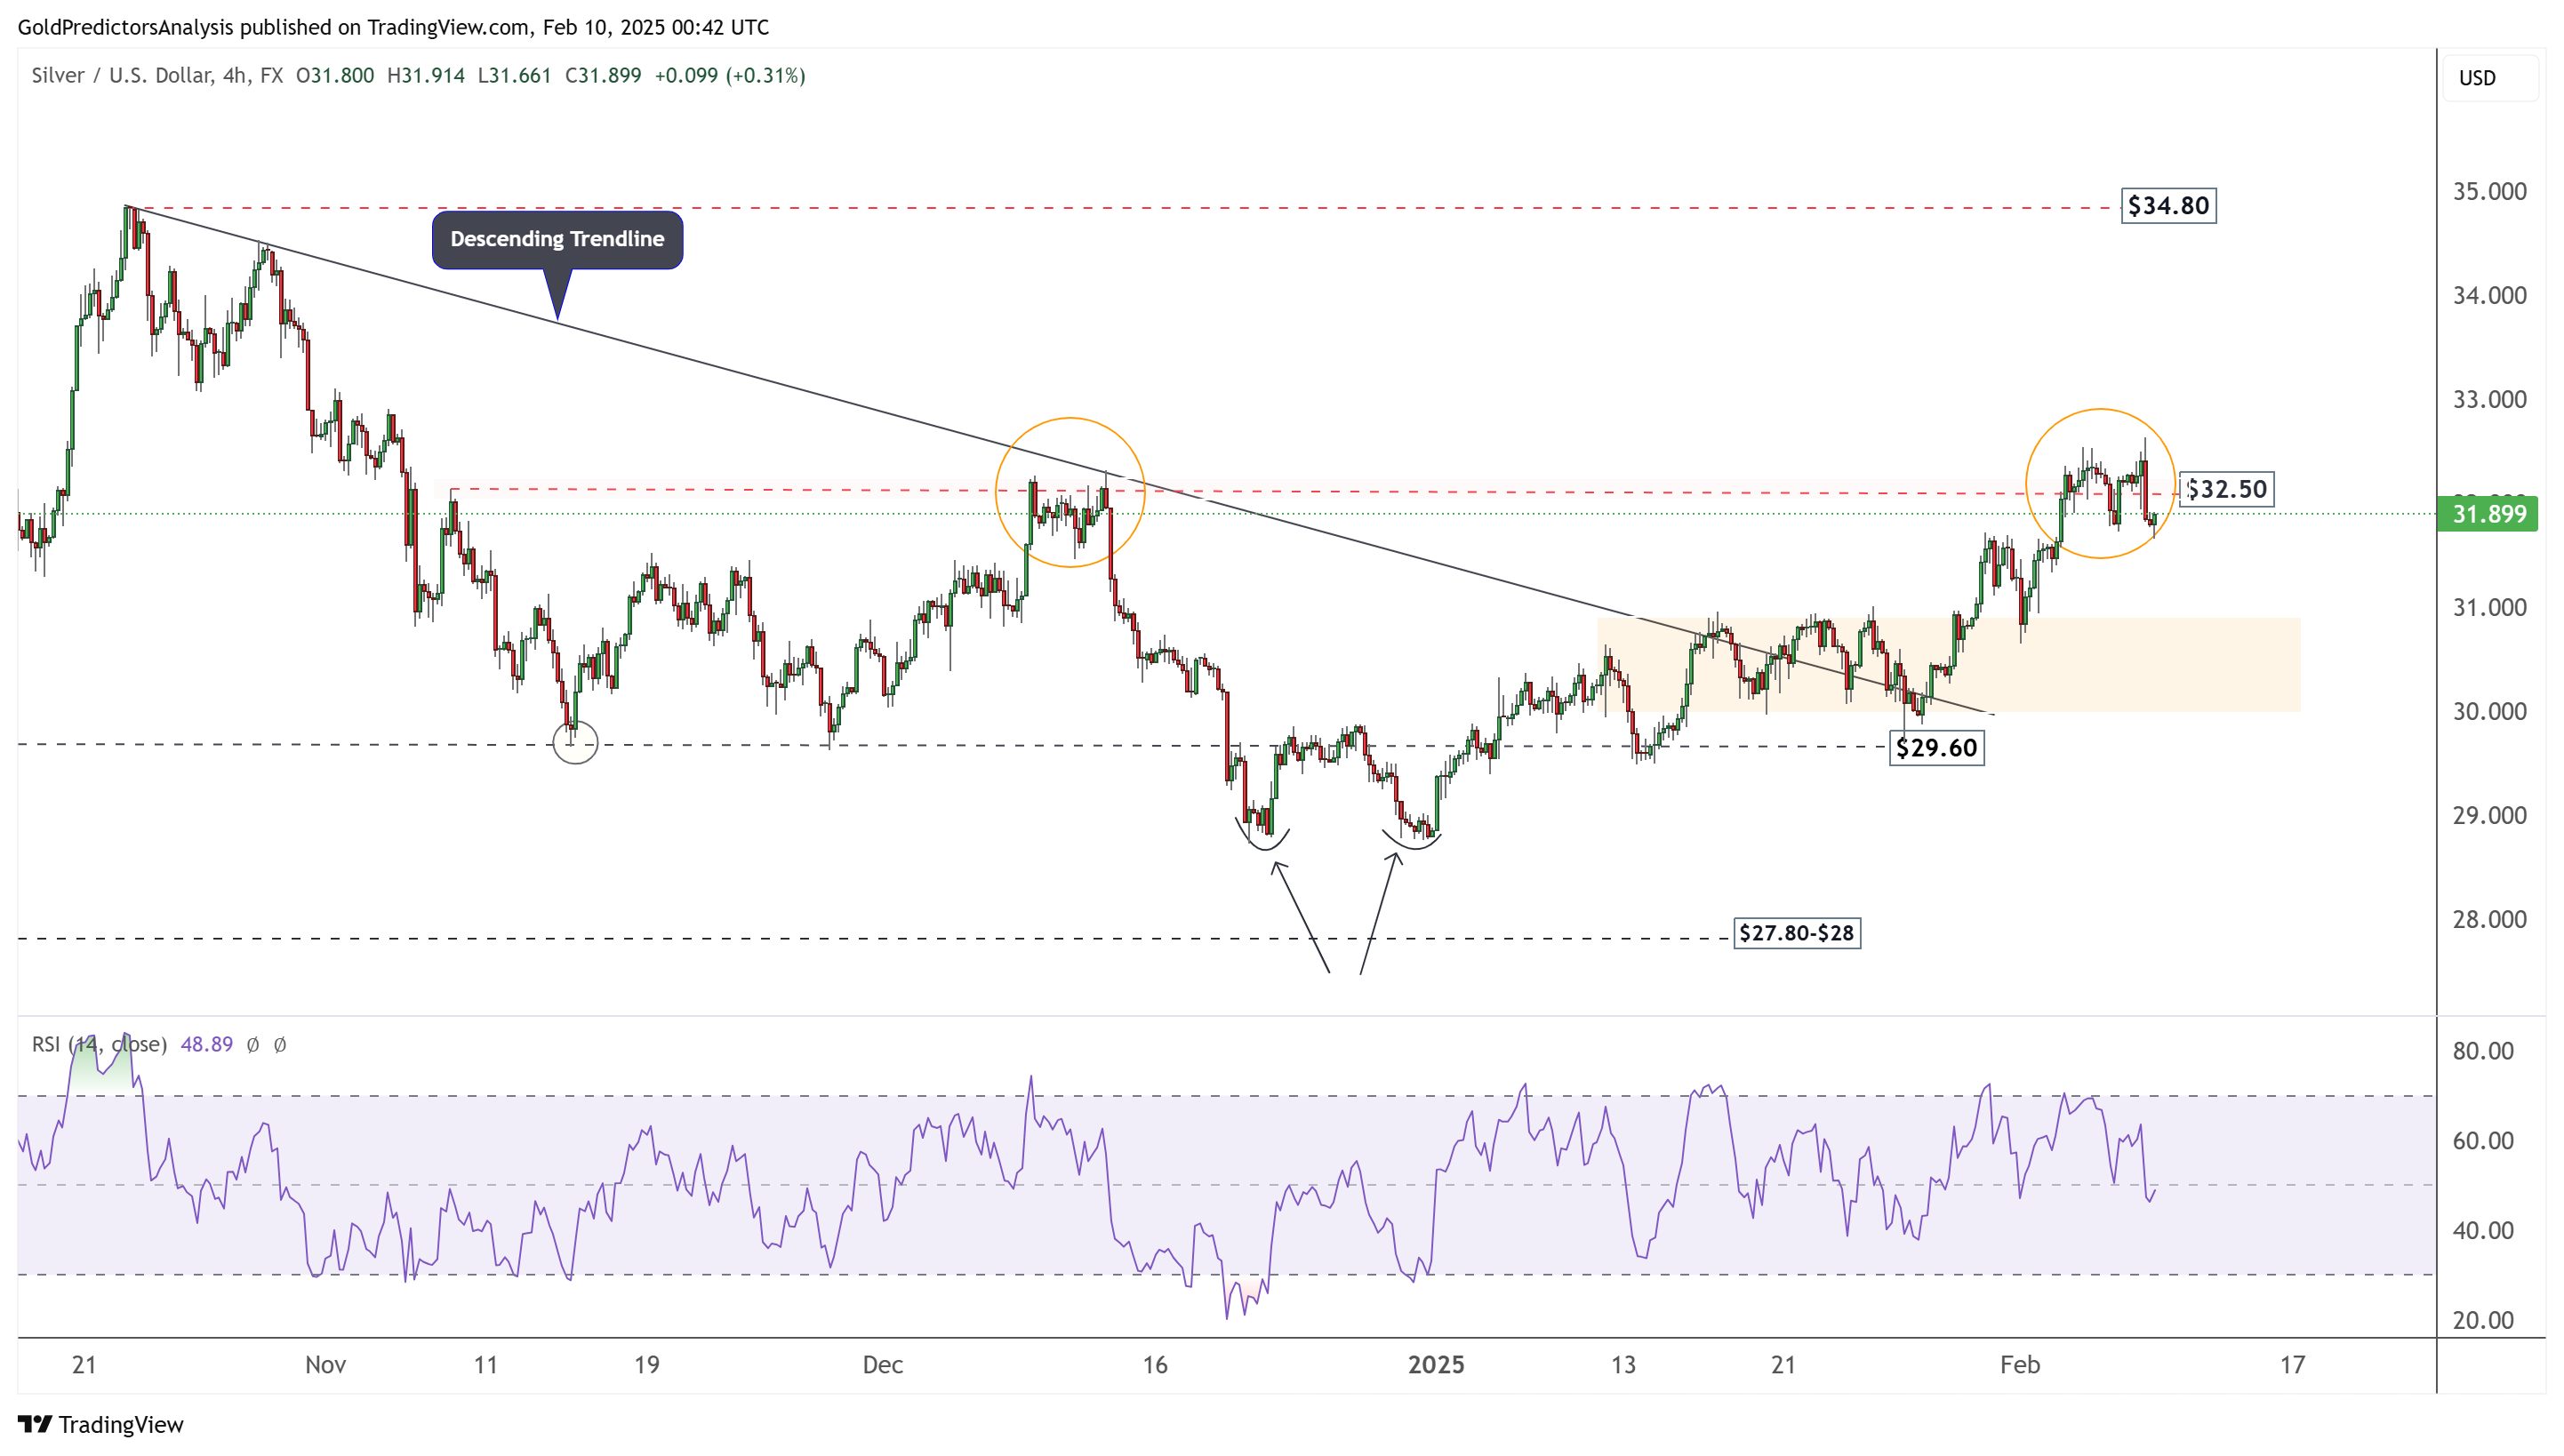
The 4-hour chart for silver shows that the price has been consolidating around the $32.50 zone. The price behavior is similar to a double top, as seen in the second week of December 2024. This suggests that the price may correct lower from this region. However, a break above $32.50 will initiate a strong move higher.
US Dollar Index (DXY) Technical Analysis
US Dollar Daily Chart – Consolidation above Key Level
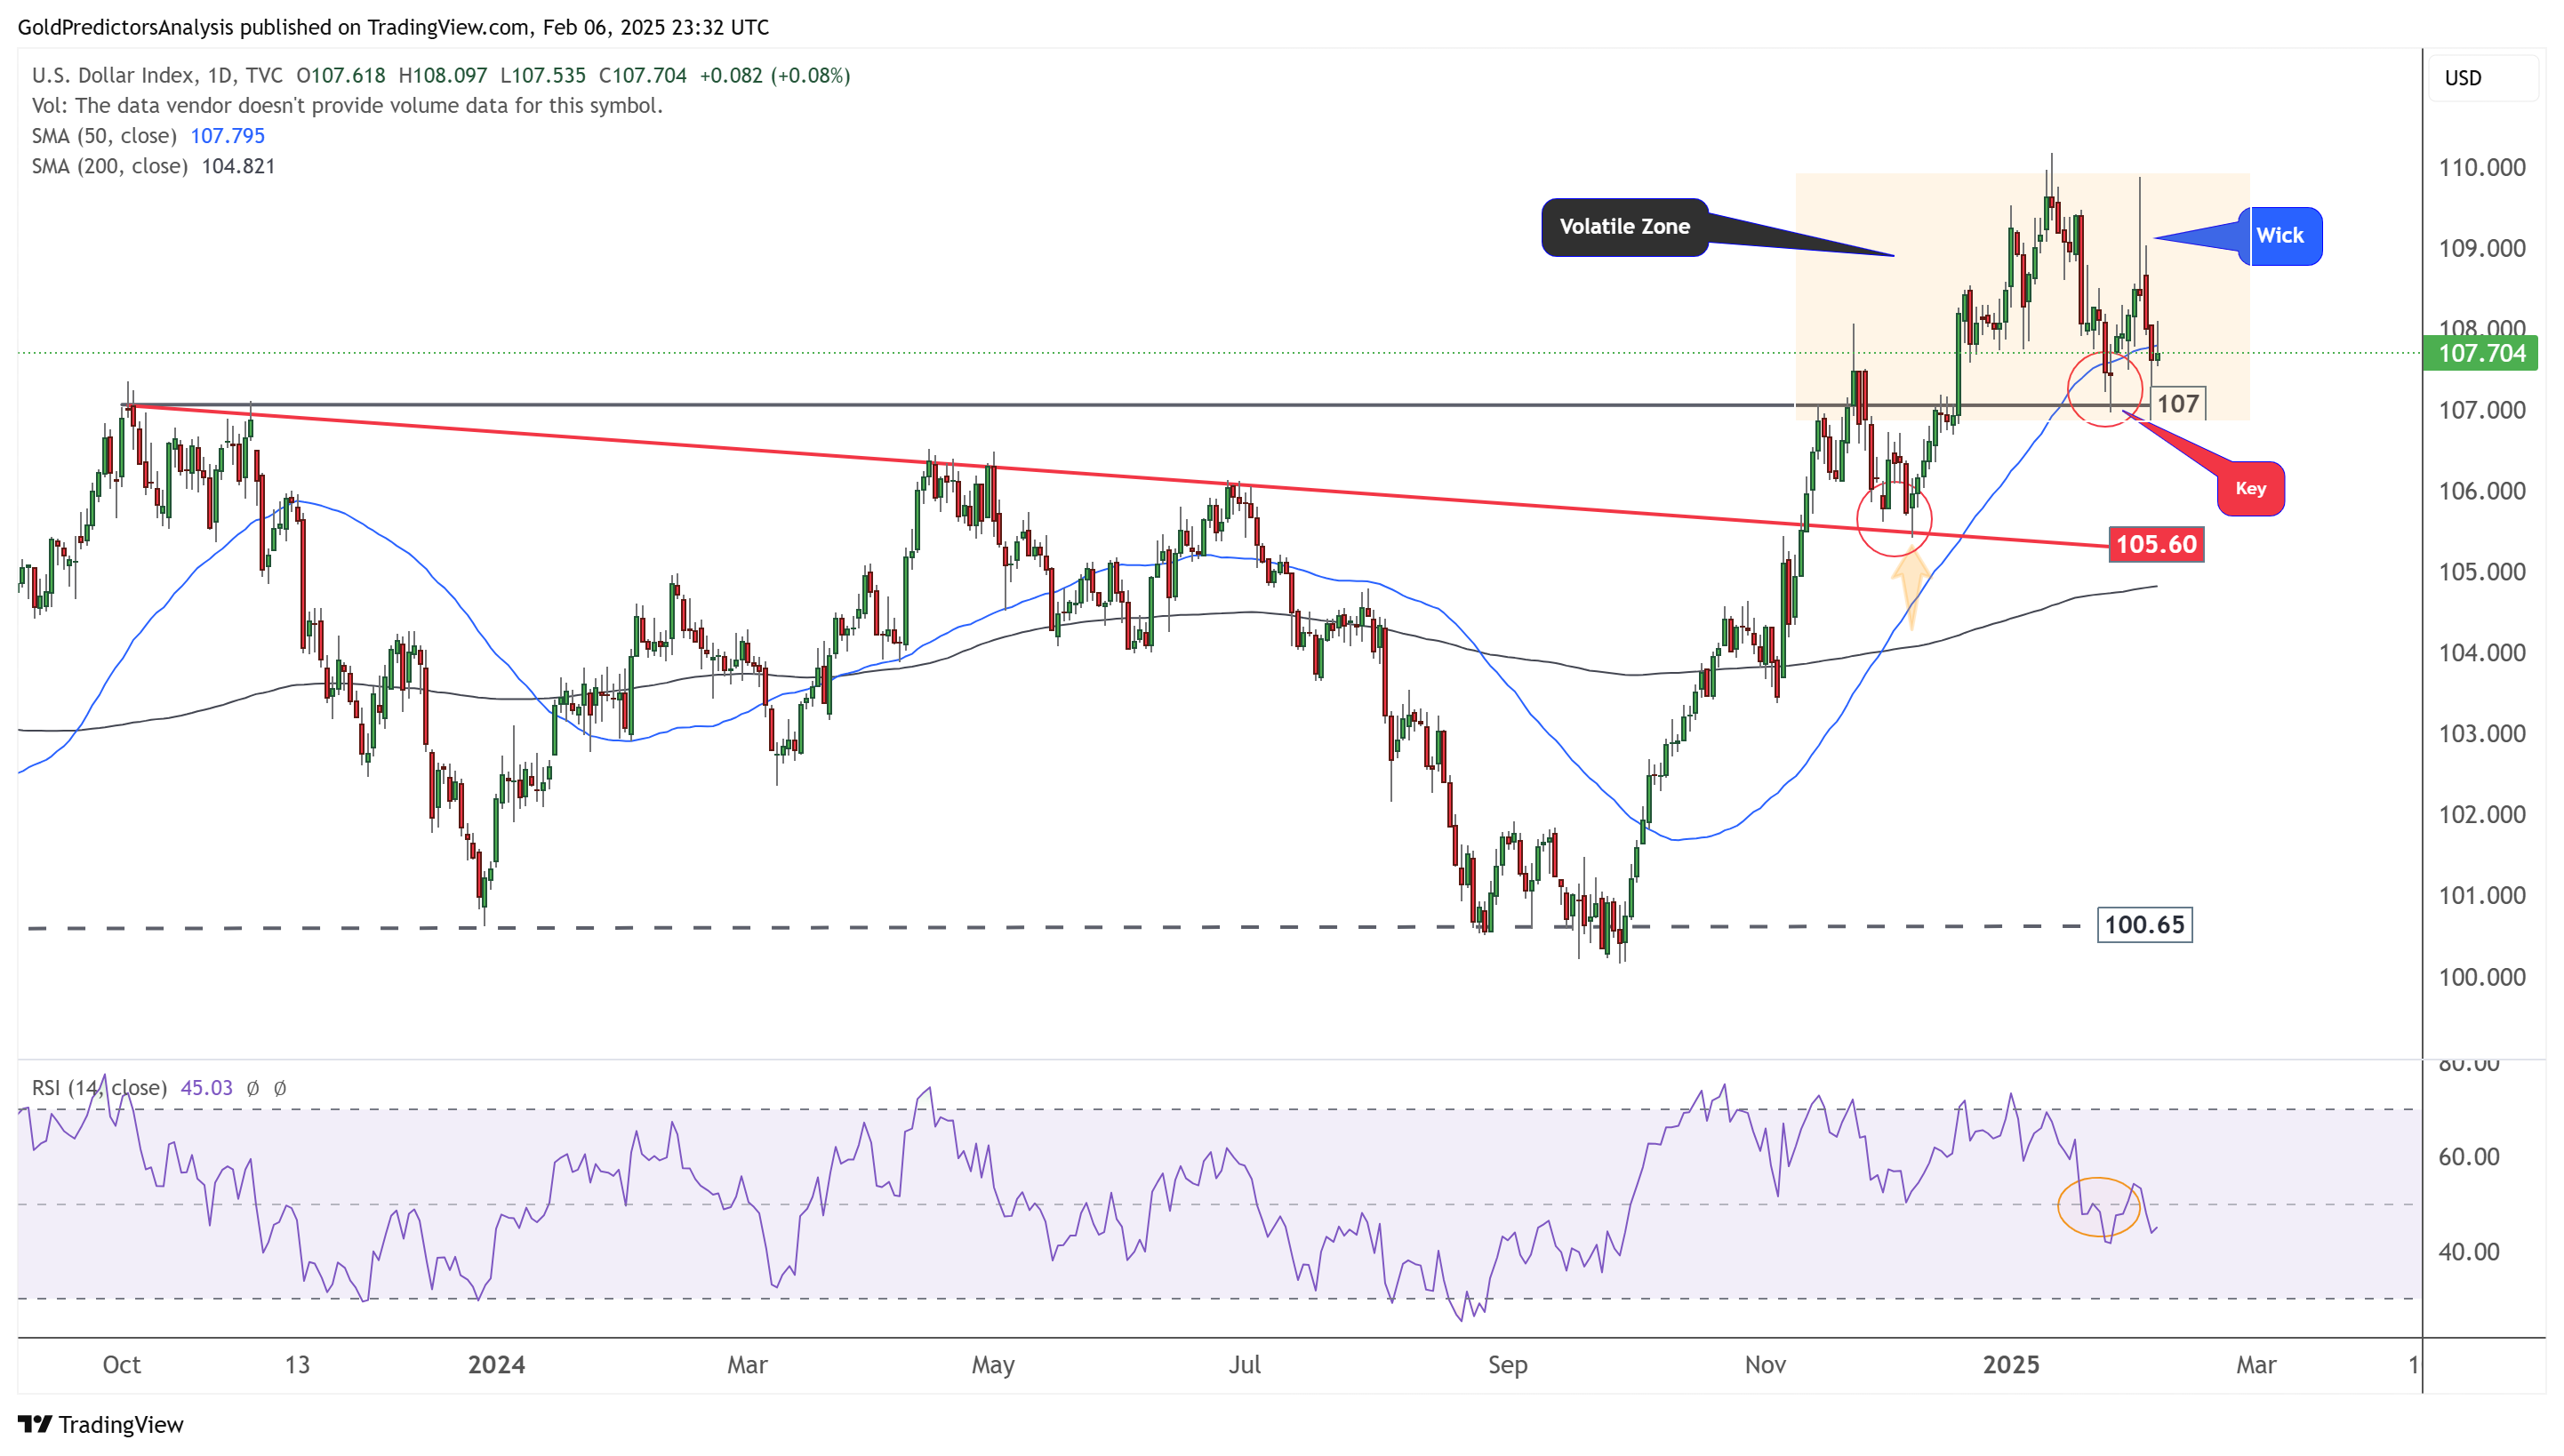
The daily chart for the US Dollar Index shows strong volatility around the orange zone, with the price trading above the key 107 level. A break below 107 could push the index down to 105.60. Furthermore, a break below 105.60 would activate a negative trend in the US dollar.
Despite this volatility, the overall outlook remains bullish. This bullish trend is supported by the 50-day and 200-day SMAs, which indicate a strong uptrend.
US Dollar 4-Hour Chart – Ascending Broadening Wedge
The 4-hour chart for the US Dollar Index shows that it trades within an ascending broadening wedge pattern, indicating volatility. The orange zone on the daily chart is also highlighted on the 4-hour chart, showing that the price structure is weakening within this volatile zone. A break below 107 will negate the bullish outlook for the US dollar.