Gold (XAU) price rebounded higher on Wednesday to reach $4,130 per ounce. This rebound in the gold market came after weakness in the US dollar, which fell below 100 after marking a high at 101.80. The expectation of higher interest rates in September has dropped from 65% to 54.9% this week. But there is still the possibility of a rate hike that could limit rallies in gold.
The easing expectations for a Fed rate hike in September are due to the correction in the oil market, which has dropped below $75 and continues to move lower.
This drop in oil prices has eased the inflation fears that have been rising during the past few months. The market is now looking at the upcoming ADP employment data on Wednesday and the US payrolls report on Friday. If the job numbers are weak, they may support the gold price. But if the job numbers are strong, they may support the dollar and put pressure on the gold market.
Silver (XAG) prices also rebounded from the strong support at $55 and reached levels above $60.70 on Wednesday due to weakness in the US dollar. But if the US payrolls data is strong, the upside in silver may also be limited.
Silver frequently follows gold prices during significant monetary policy shifts and may be more responsive to overall economic environment due to the industrial applications.
This means that the weaker job growth may provide a silver lining as rate expectations decline but a sharp economic slowdown may negatively affect industrial demand and restrain gains.

Gold Price Technical Analysis: XAUUSD Tests Critical Resistance
XAUUSD Daily: Break Above $4,200 Could Confirm Short-Term Bottom
The gold price rebounded on Wednesday and reached the key resistance level near $4,150 as seen in the chart below. The chart shows that the resistance at $4,150 is also marked by the 50-day SMA. This makes it a very critical level for the gold market.
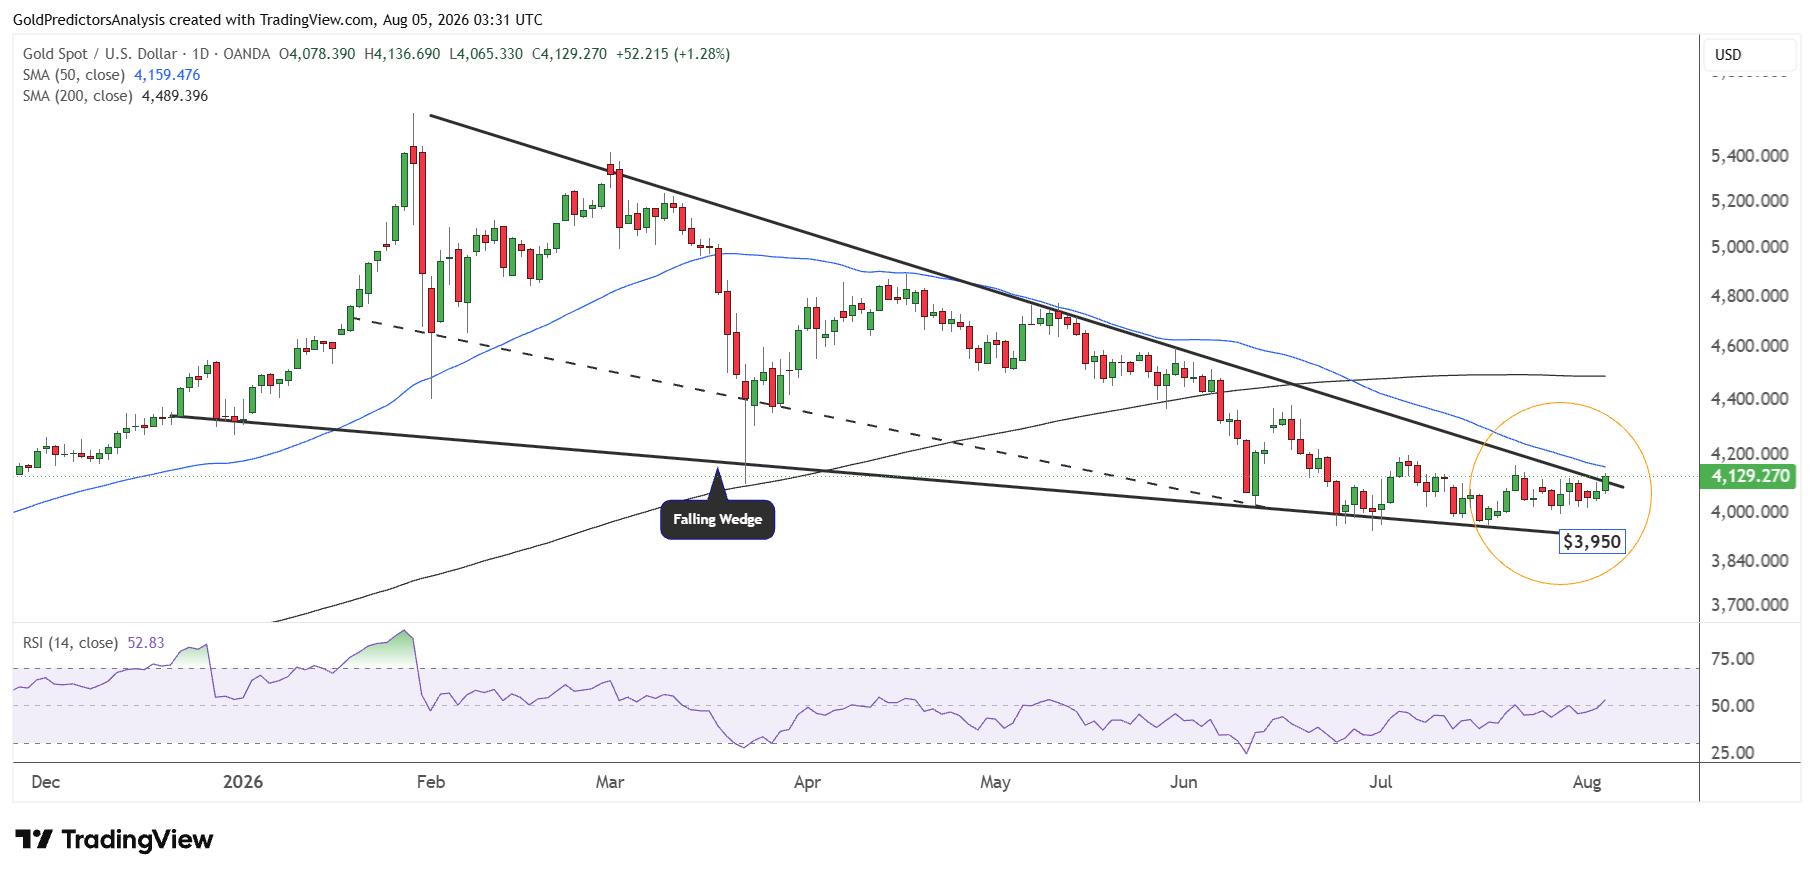
A break above $4,150 may push the gold price towards $4,200. And a break above $4,200 will confirm that the short term bottom is in place and open the door for another rally towards $4,500.
On the other hand, if the price fails to break higher and closes below $4,000, this may push prices back towards $3,900. It is interesting to note that the gold price is now recovering above the midline of the RSI, which indicates that the short term momentum may strengthen in the gold market.
Gold Price Forecast
Every new Gold analysis as it publishes, today's technical signal and key levels, live price — on one page.
See all Gold forecastsXAUUSD 4-Hour: $4,150 Resistance Holds the Key to the Next Move
The 4-hour chart for spot gold also shows that the price is approaching the critical resistance at the $4,150 area. A break above this level will likely push prices towards the next resistance at $4,300.
The price structure above the $3,950 level remains constructive on the 4-hour chart. But a break above the descending trendline at $4,300 is required to maintain the bullish momentum towards $4,500.
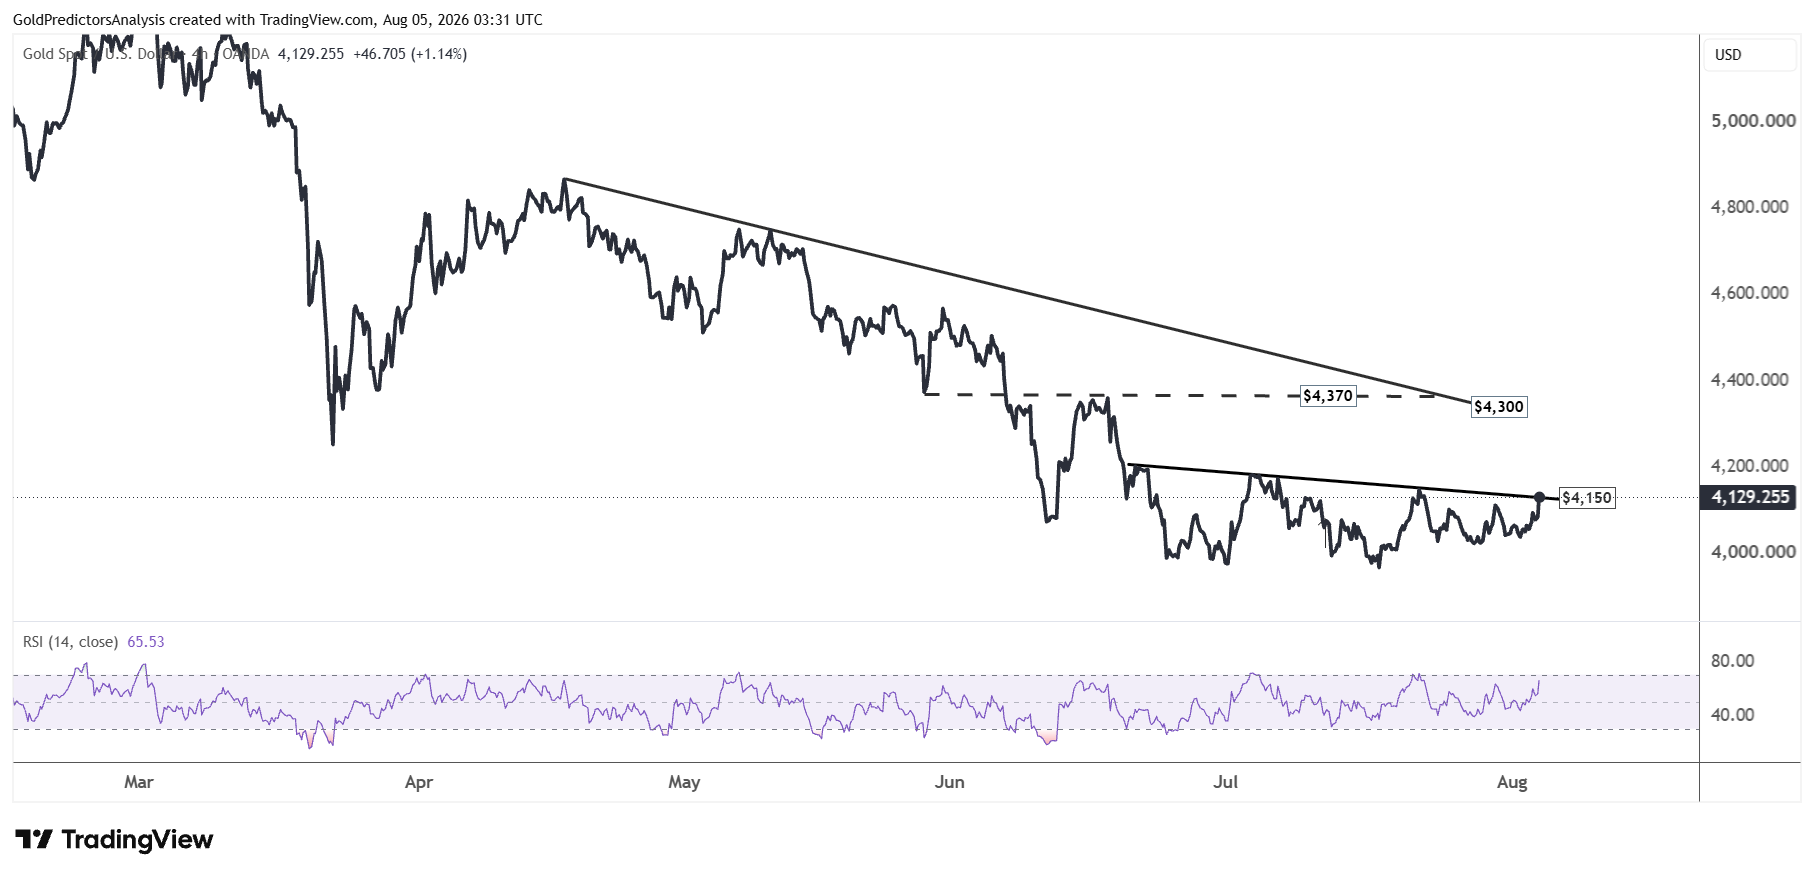
The importance of the current resistance is also evident on the following chart, which makes this area critical. The initial signs of an upside breakout in gold are seen in the breakout from the descending trendline.
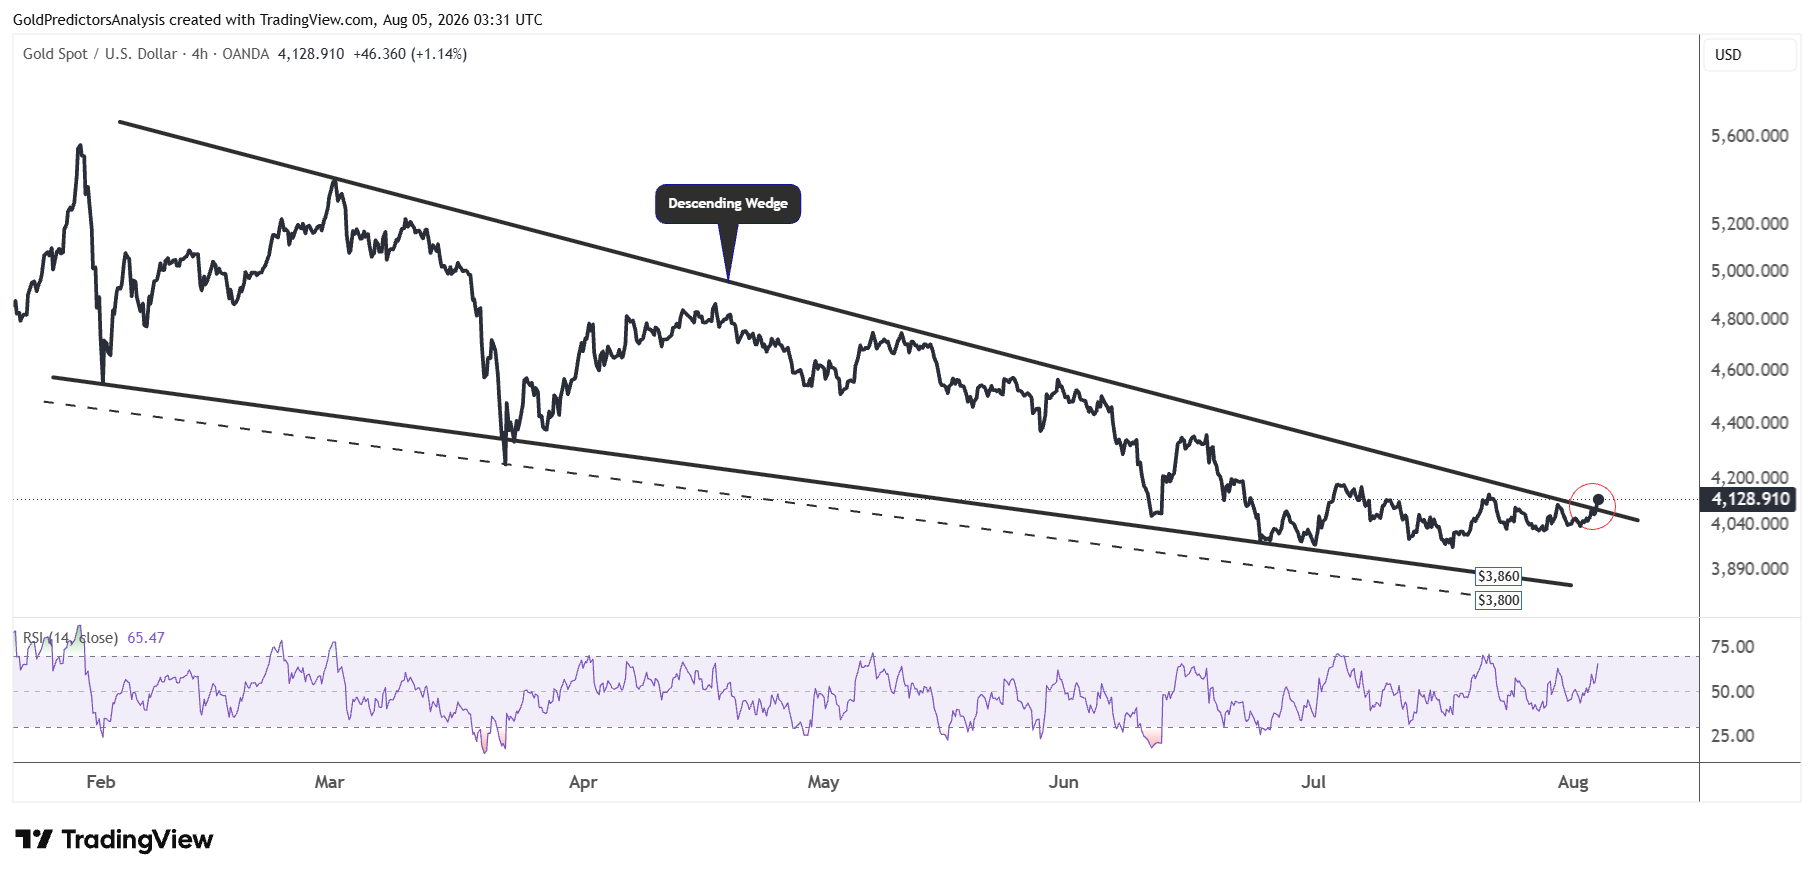
However, prices have been consolidating during the past 30 days. This means that as long as the price remains below $4,200, further consolidation is likely. Therefore, the current breakout from the descending wedge is not considered as strong as a break above $4,200.
Silver Price Technical Analysis: XAGUSD Approaches $64 Resistance
XAGUSD Daily: Break Above $64 Could Open the Path Towards $72
The daily chart for spot silver also shows strength within the primary support zone of $55 to $64. The immediate resistance in spot silver remains at $62.50 which is marked by the 50-day SMA.
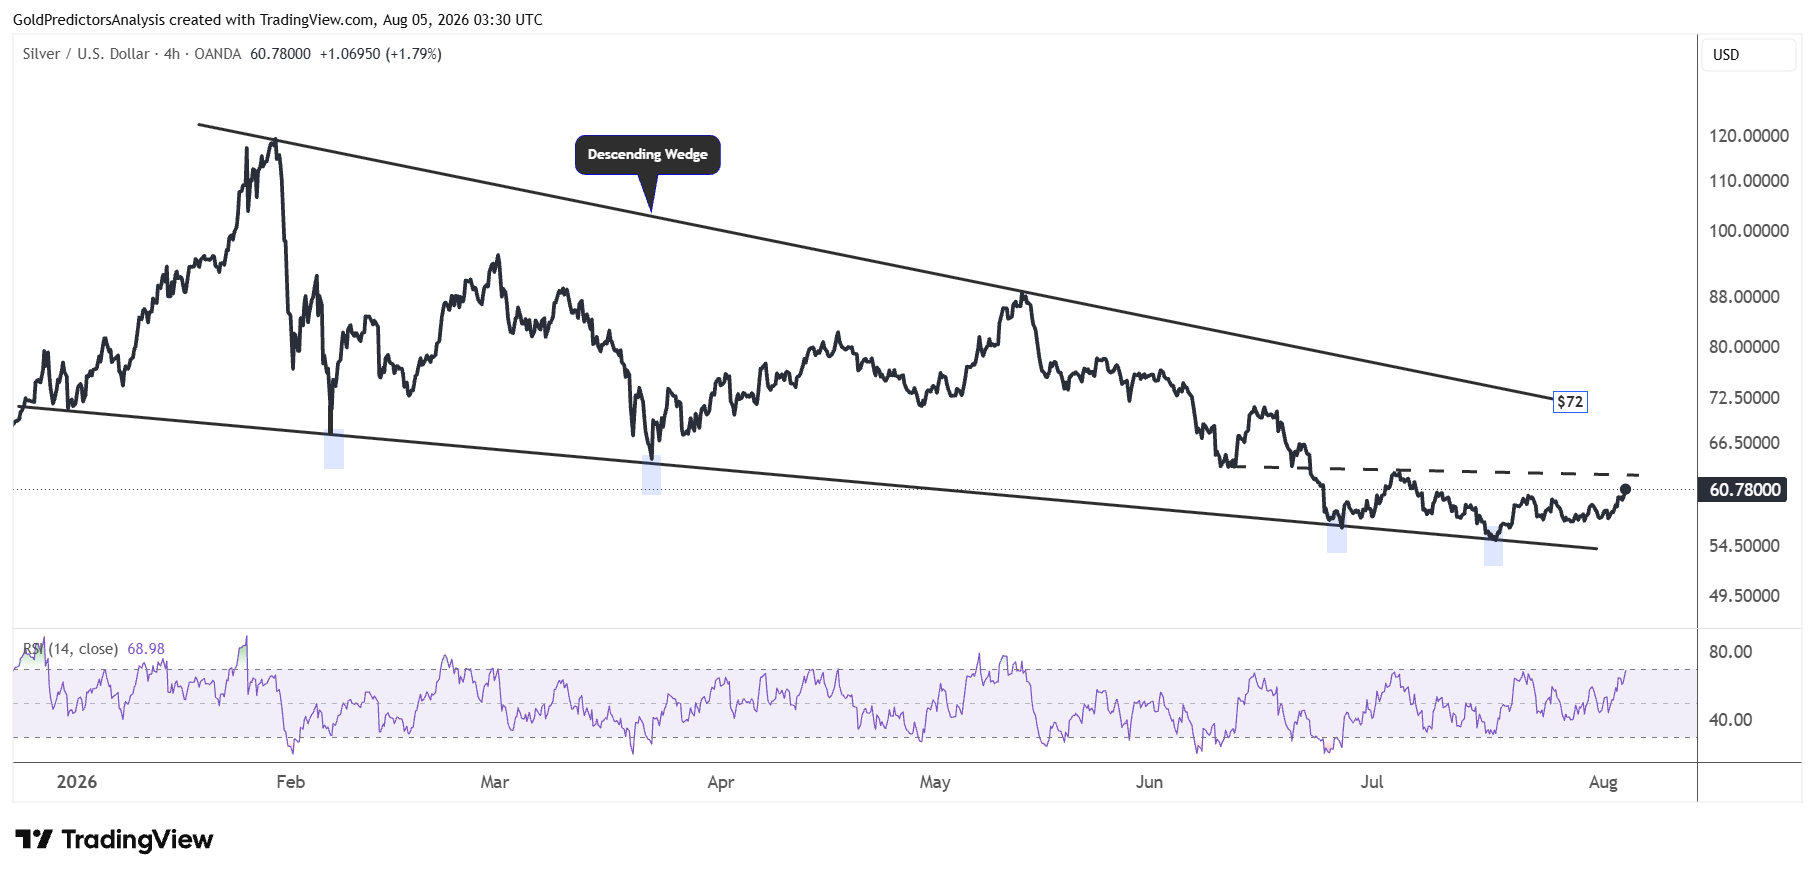
A break above $64 in the spot silver market will push the price back towards the $72 area. It is interesting to note that resistance at the $72 area is also marked by the 200-day SMA. A break above this level will likely push the spot silver market towards the $90 region.
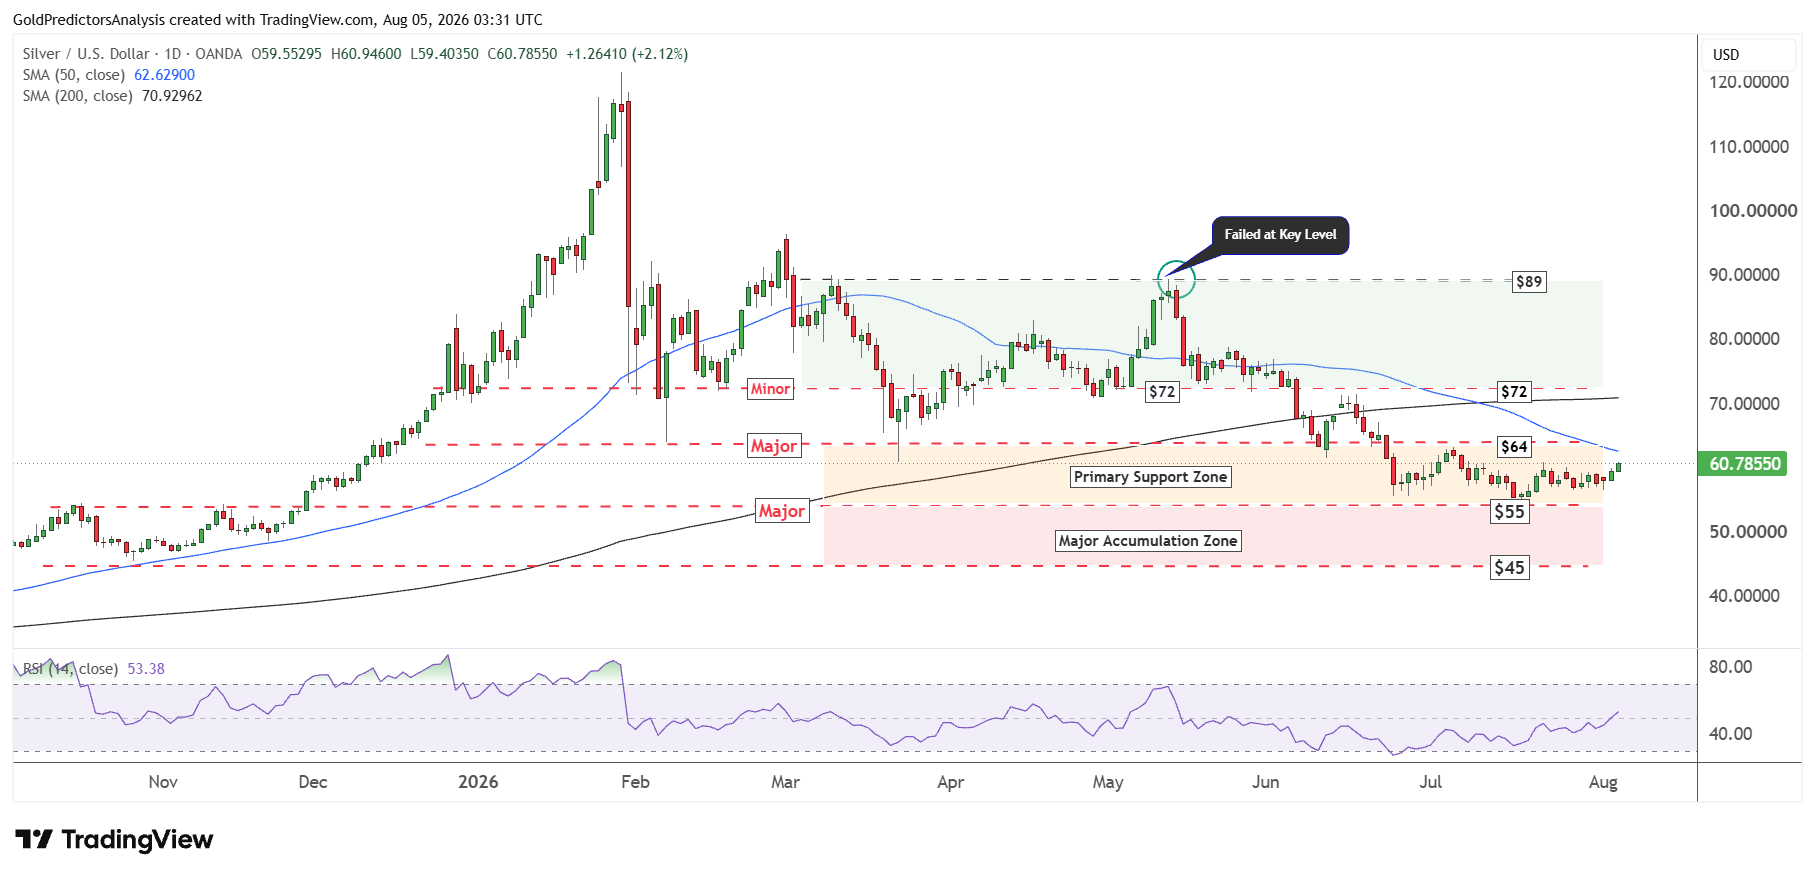
XAGUSD 4-Hour: Descending Wedge Supports a Possible Breakout
The 4-hour chart for spot silver also shows a rebound within the descending wedge pattern back towards the $72 area. However, a break above $64 is required to build bullish momentum in the silver market. The lower boundary support now extends to $53 as seen by the lower boundary of the descending wedge.
Bottom Line
Gold and silver have recovered as the weaker US dollar and lower oil prices improve the market sentiment. The upcoming US employment data may determine the next move. Gold is required to break above $4,200 to confirm the short term bottom and open the path towards $4,500. But a drop below $4,000 may bring the $3,900 support back into focus. Silver must break above $64 to strengthen bullish momentum towards $72. Until these levels break, both metals may remain within current consolidation ranges.
Read more: Iran Talks Lift Metals as Oil Prices Fall