
Gold News: Fed Expectations and Safe-Haven Demand Support Metals
Expectations of increasingly weak U.S. labor markets and renewed geopolitical tensions have brought strong demand for metals from institutions in advance of the U.S. Nonfarm Payrolls report due out on Friday. The recent holding of rates by the Fed at 3.50%-3.75%, has moved markets to focus on what is to come, with Fed Chair Warsh saying that the moves will be data dependent. For the week, reports out on JOLTS job openings, ISM Services PMI, and Nonfarm Payrolls, will indicate whether the Fed’s view on the labor market is changing. Reuters has said that softer U.S. job market data has increased expectations for a slowdown in the economy.
Gold’s safe haven status is bolstered by ongoing geopolitical tensions. As President Trump stated U.S. diplomacy with Iran has started and that he believes there has been a pause on military actions, Iranian officials stated that no formal talks have started. Uncertainty in the region has demand for safe havens and inflation defensive assets.
There is strong demand for silver beyond its monetary role due to its strong structure. There is ongoing demand for silver to service the growth of solar photovoltaic and artificial intelligence (AI) infrastructure, improved power grids and advanced electronics. These sectors continue to provide ongoing demand for silver despite the global manufacturing slowdown.
Alongside continued central bank gold diversification and greater geopolitical risk, these suggest an encouraging fundamental backdrop in the precious metals complex in the days leading to a data-rich week.

Gold Technical Analysis: XAU/USD Consolidates Below Descending Trendline as Triangle Tightens
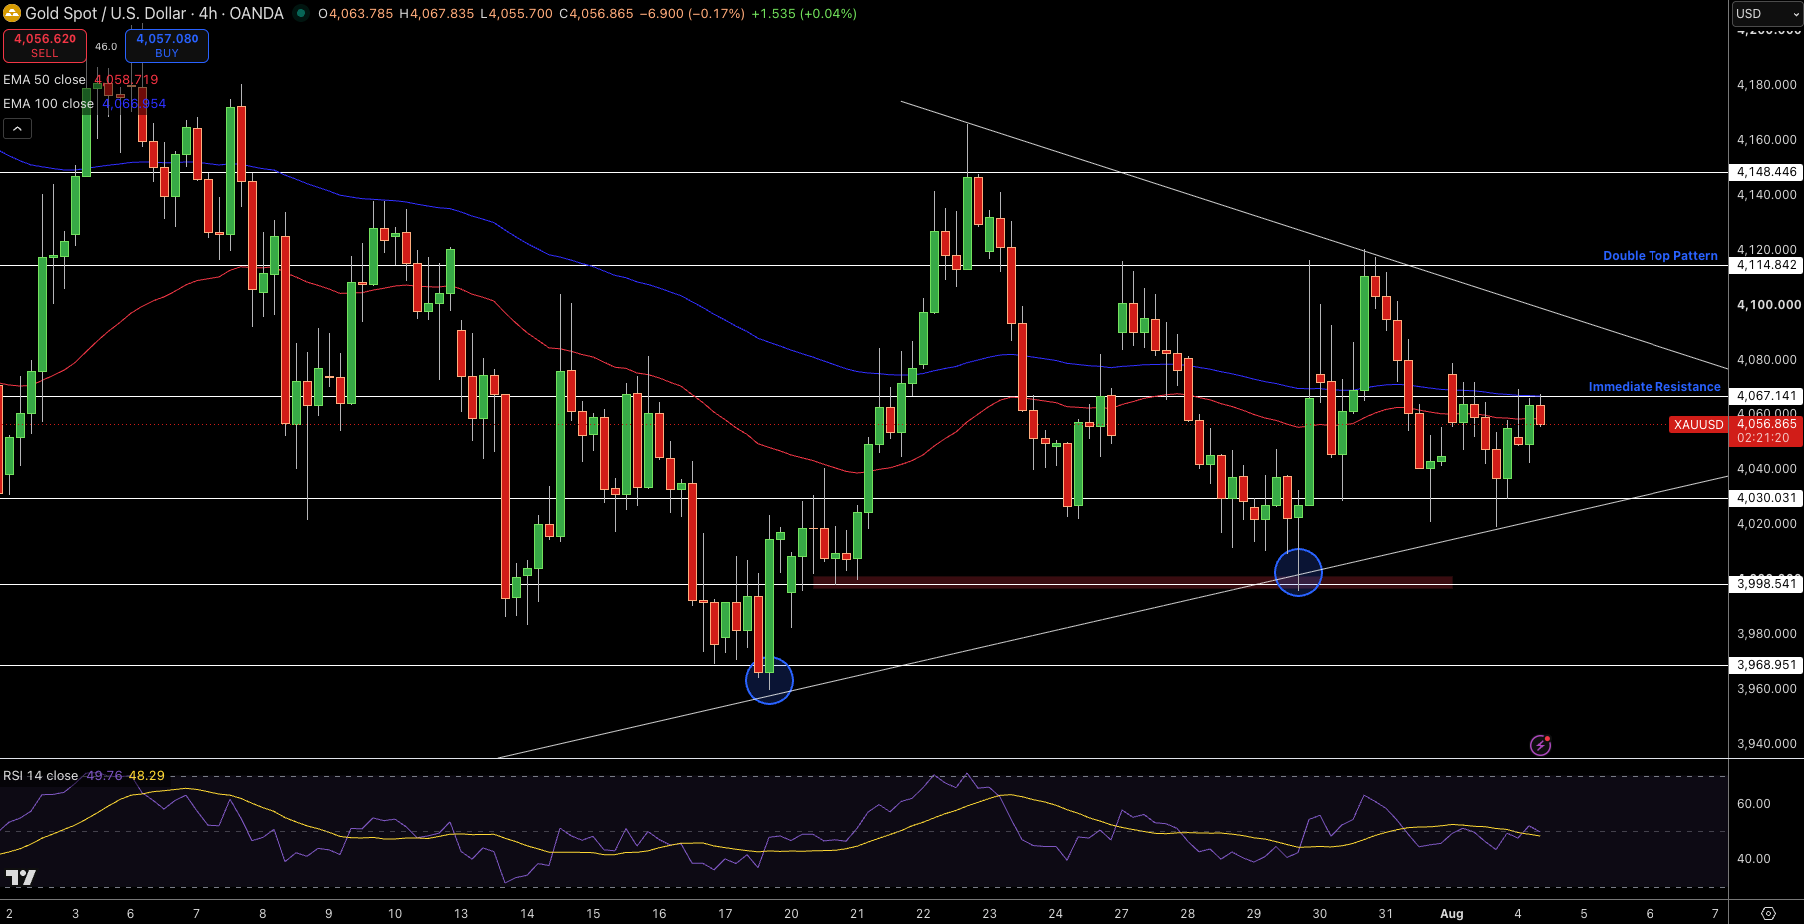
Gold is trading around $4,057. After a prolonged period of consolidation, Gold is continuing to trade within a symmetrical triangle with long-term ascending trendline support and resistance that is forming with a down-sloping trendline. The price is currently caught between the 50-EMA at $4,059 and the 100-EMA at $4,067. This indicates that the price is highly likely to breakout in one direction or another.
Should the price break to the upside, the first resistance level is expected at $4,067, while the trendline resistance is found at $4,115. A break above this area would be an official breakout of the consolidation and target $4,148. Should the price break to the downside, bullish trendline support and demand zone convergence (the area where price has been bought the most) is located at $3,999. A break of this price would invalidate the bullish structure and target $3,969.
The RSI is currently at the 50 level indicating indecision is present in the market. With Gold being in a consolidation phase, the breakout from the current triangle is expected to have a strong influence on the overall market direction for the mid-term.
Gold Price Forecast
Every new Gold analysis as it publishes, today's technical signal and key levels, live price — on one page.
See all Gold forecastsSilver Technical Analysis: XAG/USD Pressures Triangle Resistance as Bulls Build Momentum
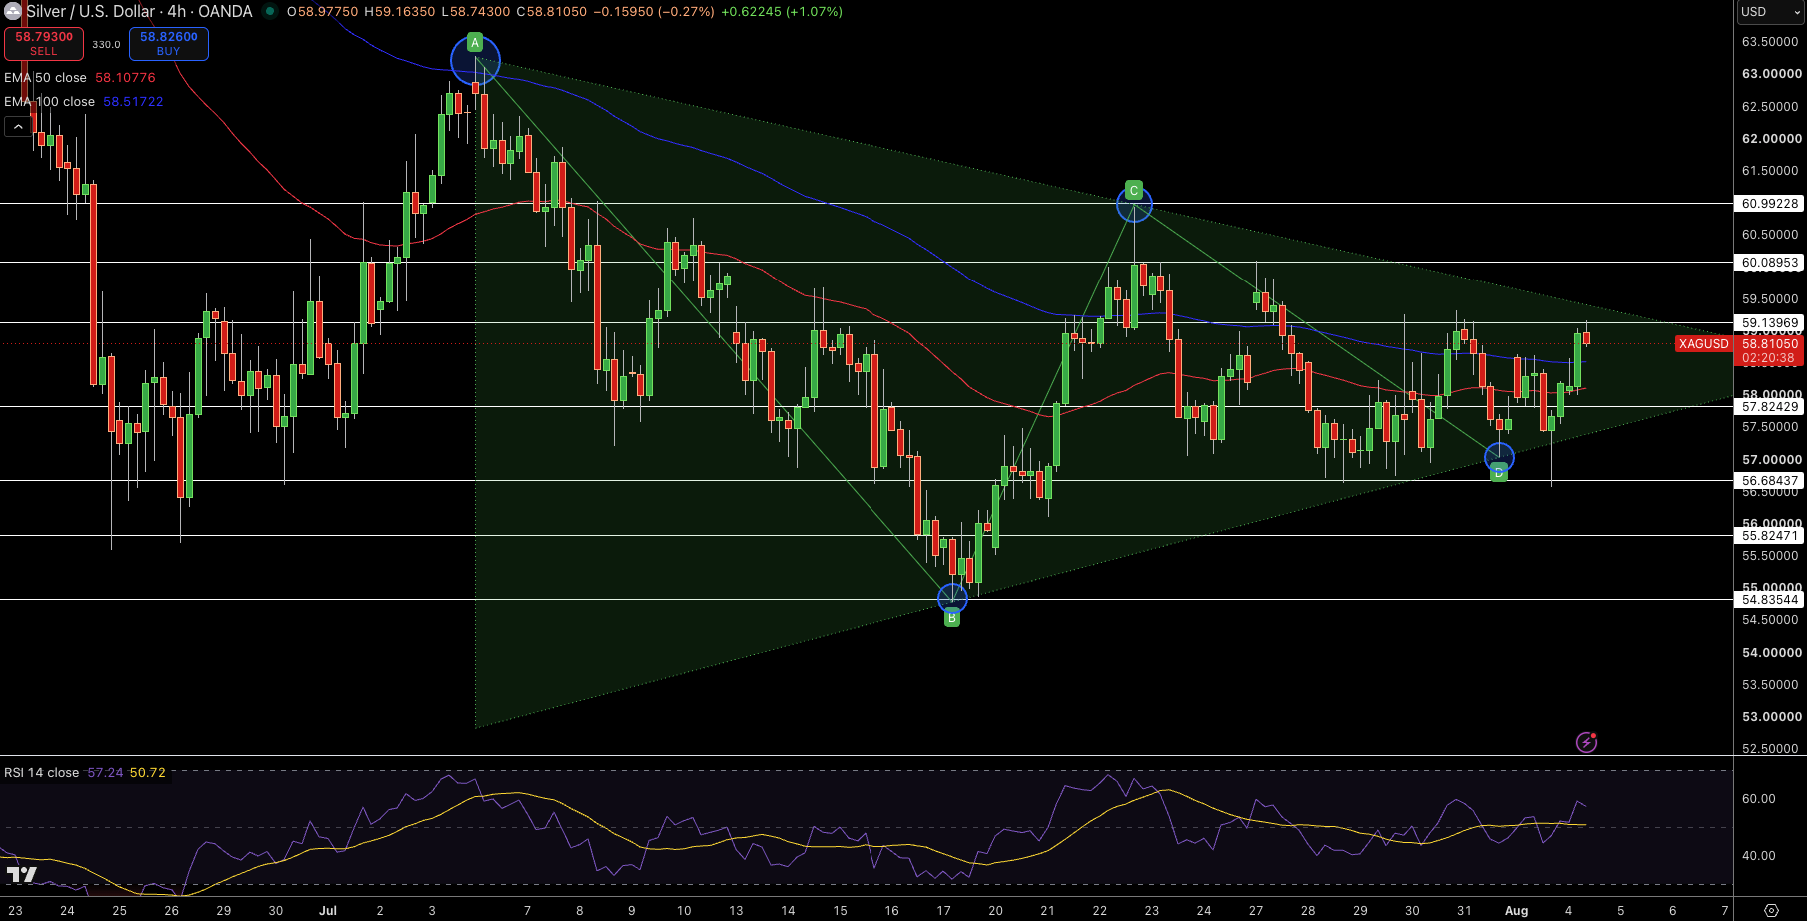
Silver is trading at $58.81 and consolidating in a large symmetrical triangle. The rebound from the rising trendline has set the bullish tone in the market as traders seek to break the $59.14 resistance. This large symmetrical triangle has shaped both the rising trendline and the 100-EMA, as well as the 50-EMA, respectively.
Silver would need to consolidate beyond $59.14 in order to set the new upwards target of $60.09. Beyond this target lies the next major resistance at $60.99. Should Silver consolidate beyond this new resistance, the initial support is
RSI is at 57, signaling a bullish momentum uptrend and avoiding the overbought levels. The triangle’s higher lows remain bullish, and a daily close above $59.14 should open the next bullish leg.