


First Pullback Tests the Breakout
Gold pulled back to a key decision zone on Thursday, reaching a low of $4,040 and finding support near the 61.8% Fibonacci retracement of the prior advance. This is an area that could hold as support and lead to strength, given the multiple bullish breakout signals that triggered earlier this week. Thursday’s decline is the first pullback following those breakouts that included advances above the downtrend line, the 20-day moving average near $4,068, and a prior interim lower swing high at $4,138.
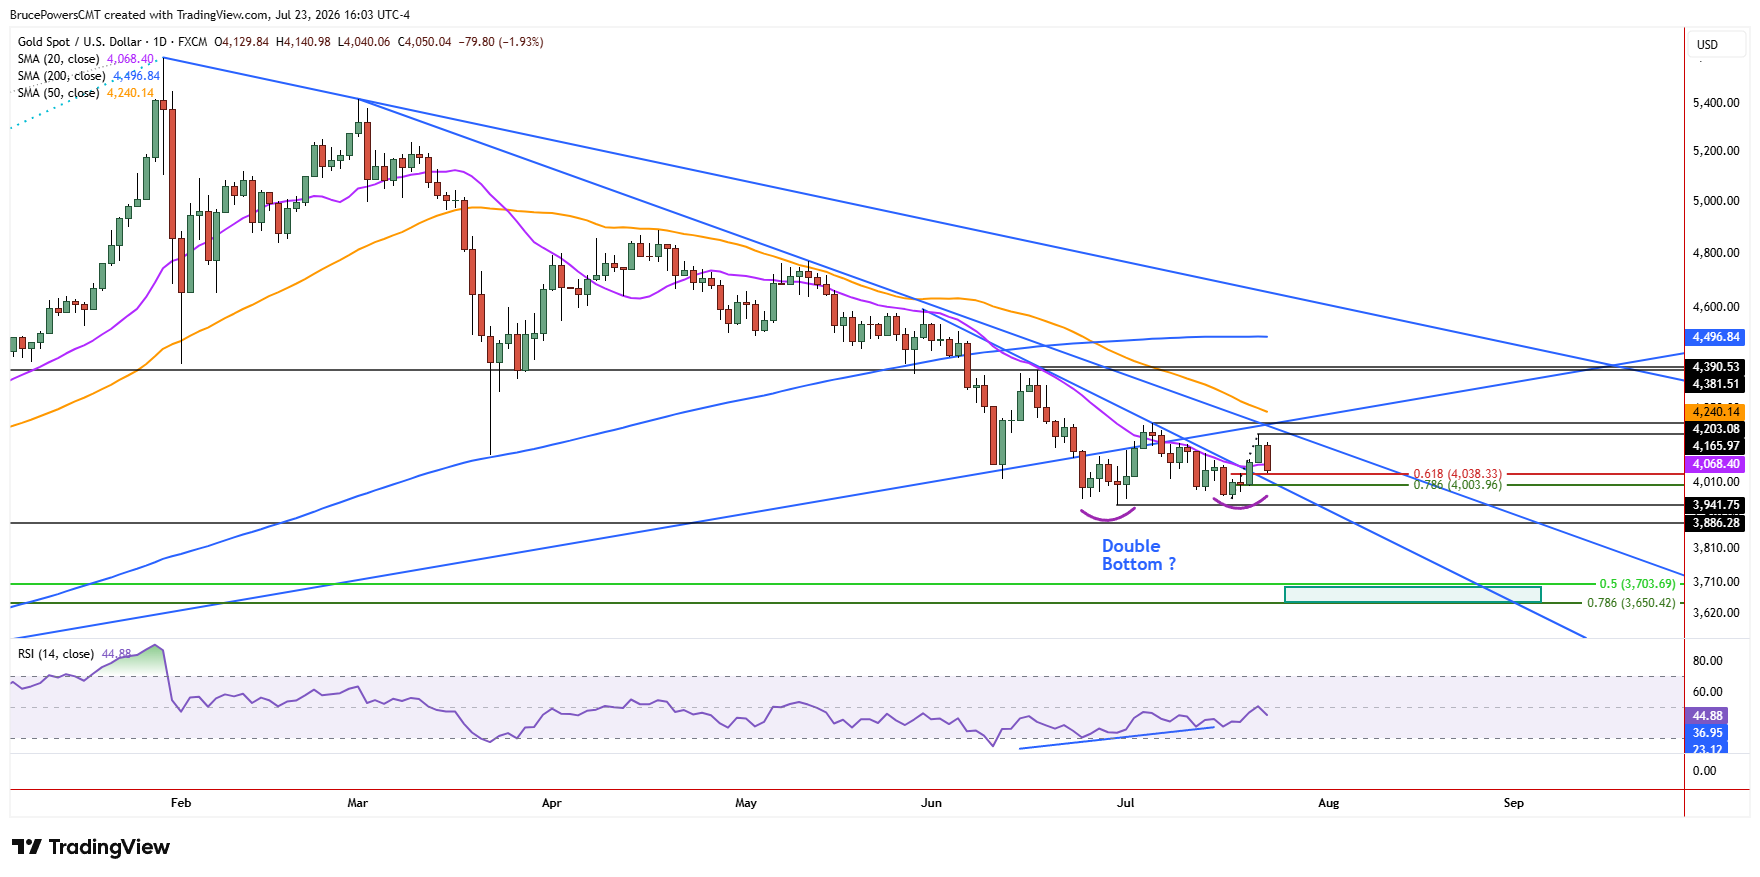
Given the indication of strong support near recent lows, these potential early signs of a trend reversal remain valid and suggest further strength following the first pullback after the initial breakout high of $4,166 that was reached on Wednesday. The first pullback following the trend breakouts is testing former resistance represented by the neckline of the potential double bottom pattern as support. Support near the 20-day moving average failed to confirm as support since it was broken during Thursday’s decline.
$4,203 Barrier Comes Into Focus
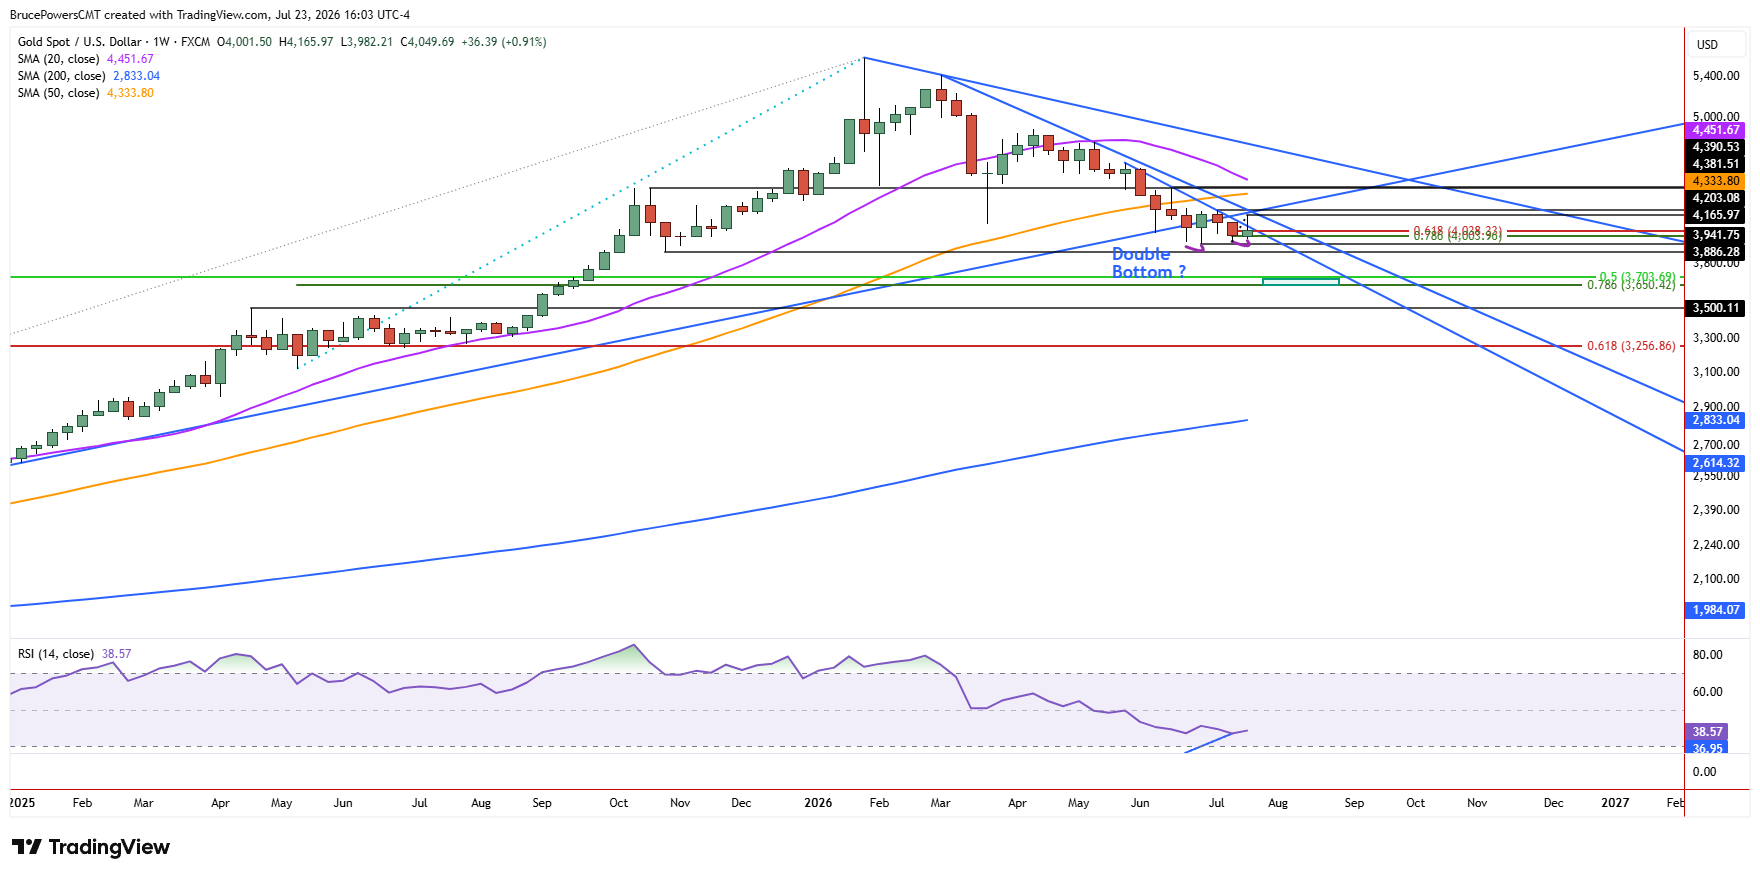
Despite the potential for upside follow-through, there is nearby overhead resistance that remains and needs to be recovered to confirm additional strength. Key overhead resistance is near the recent lower swing high of $4,203 and the convergence of three indicators represented by the convergence of an uptrend line, a downtrend line, and the July lower swing high of $4,203. This creates a significant resistance zone that may soon be joined by the falling 50-day moving average, at $4,240 currently.
A Triangle Takes Shape
Since Thursday’s decline generated a lower swing high from Wednesday, there is now a symmetrical triangle consolidation pattern that has taken form. This pattern is developing near a significant long-term resistance zone, reflecting continued downward pressure. In addition, the developing pattern may confirm a double bottom bullish reversal pattern on a rally above the neckline at the lower swing high of $4,203.
Breakout Needs More Than $4,203
Given the location of the 50-day moving average, a double bottom breakout should also reclaim that average for stronger confirmation. Otherwise, it may quickly present a resistance zone and slow the advance from the reversal breakout. Otherwise, while Thursday’s pullback is testing whether the key decision zone can hold as support, a sustained move above the $4,203-$4,240 resistance area would provide stronger confirmation that the early bullish breakout signals area developing into a broader trend reversal.
If you’d like to know more about how to trade gold and silver, please visit our educational area.