
Gold News: Dollar Weakness and Iran Risk Support Precious Metals
The price of gold and silver is being influenced by a weaker dollar, renewed fiscal issues, and ongoing Middle East issues. Initially, yields on U.S. Treasury bonds decreased as the Treasury Department indicated it would purchase older, longer maturity U.S. Treasury bonds. Now, long dated U.S. Treasury bond yields have increased but the U.S. dollar has decreased as investors are pondering the sustainability of growing U.S. fiscal issues and a growing federal budget of over $40 trillion.
Higher oil prices and elevated long-term yields will continue to present a negative outlook for gold and silver if the Fed is forced to maintain a tight monetary policy.
Geopolitical demand for gold and silver is also returning. Treasury Secretary Scott Bessent said Washington is preparing tougher sanctions against Iran, reducing hopes of a rapid resolution to the conflict and keeping uncertainty around the Strait of Hormuz elevated. That combination of geopolitical risk and fiscal anxiety continues to reinforce gold’s defensive role.
Investor demand is also moving in the same direction. Reuters reported gold-backed funds attracted $7 billion of inflows in early August and institutional and central bank demand appears to be returning as liquidations of gold and silver were made earlier this year due to the war in Ukraine.
Silver has another tailwind from the physical market. According to research cited in Reuters, there will be a sixth straight structural supply deficit in 2026, with inventories still shrinking, while industrial users adjust their spending by solar-sector thrifting. The long-term demand for electronics, AI infrastructure and power-grid investments should offset this.

Gold Technical Analysis: XAU/USD Breaks Trendline and Targets $4,595
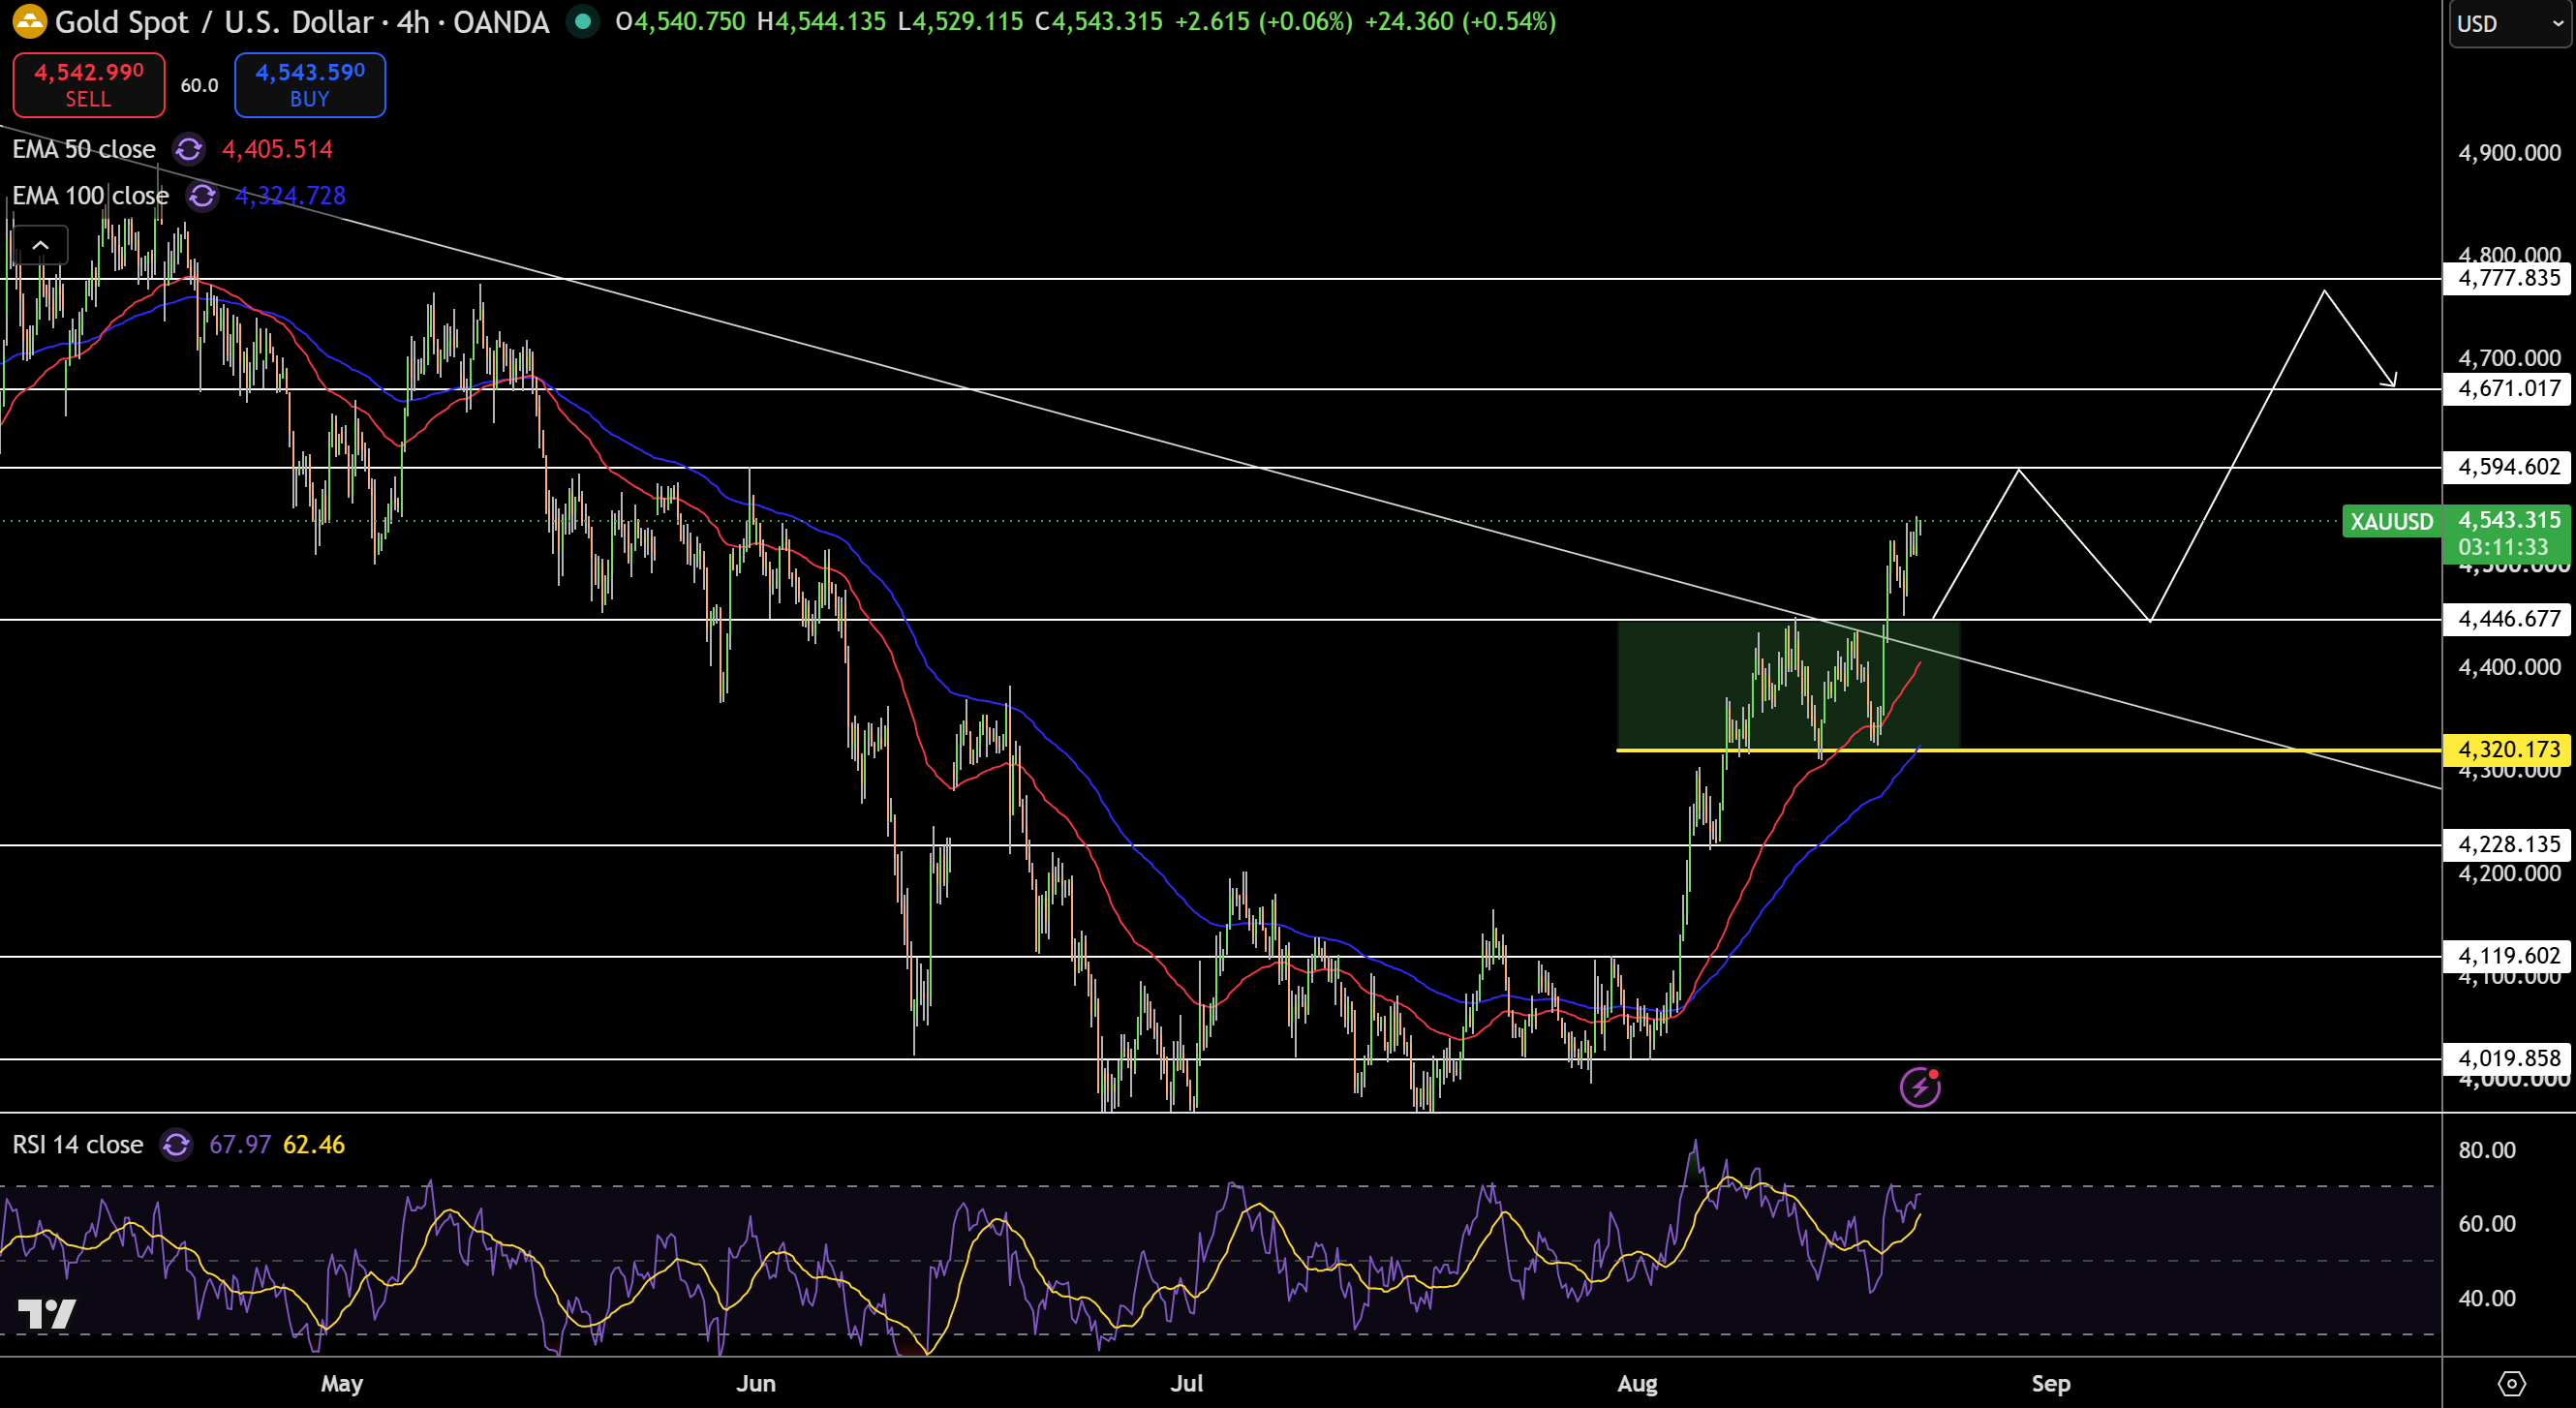
Gold is now $4,543 on the 4 hour chart after a break of the long standing descending trendline and is also trading above the 50 and 100 EMA at $4,406 and $4,325 respectively. The structure is also bullish. The break above $4,446 levels considered a strong level of support for a potential pullback and holds upside momentum for gold with RSI at 68. Resistance is located at $4,595, $4,671, and $4,778. Support levels are $4,447, $4,320, and $4,228.
For the bullish case, holding above $4,447 maintains the overall bullish sentiment for gold. Meanwhile, breaking above $4,595 could open $4,671 and $4,778 for further gains. A breakdown back below $4,447 officialy resets the bullish sentiment and opens the potential for further losses that target $4,320.
Gold Price Forecast
Every new Gold analysis as it publishes, today's technical signal and key levels, live price — on one page.
See all Gold forecastsSilver Technical Analysis: XAG/USD Breaks Above $68 as Rising Channel Stays Intact
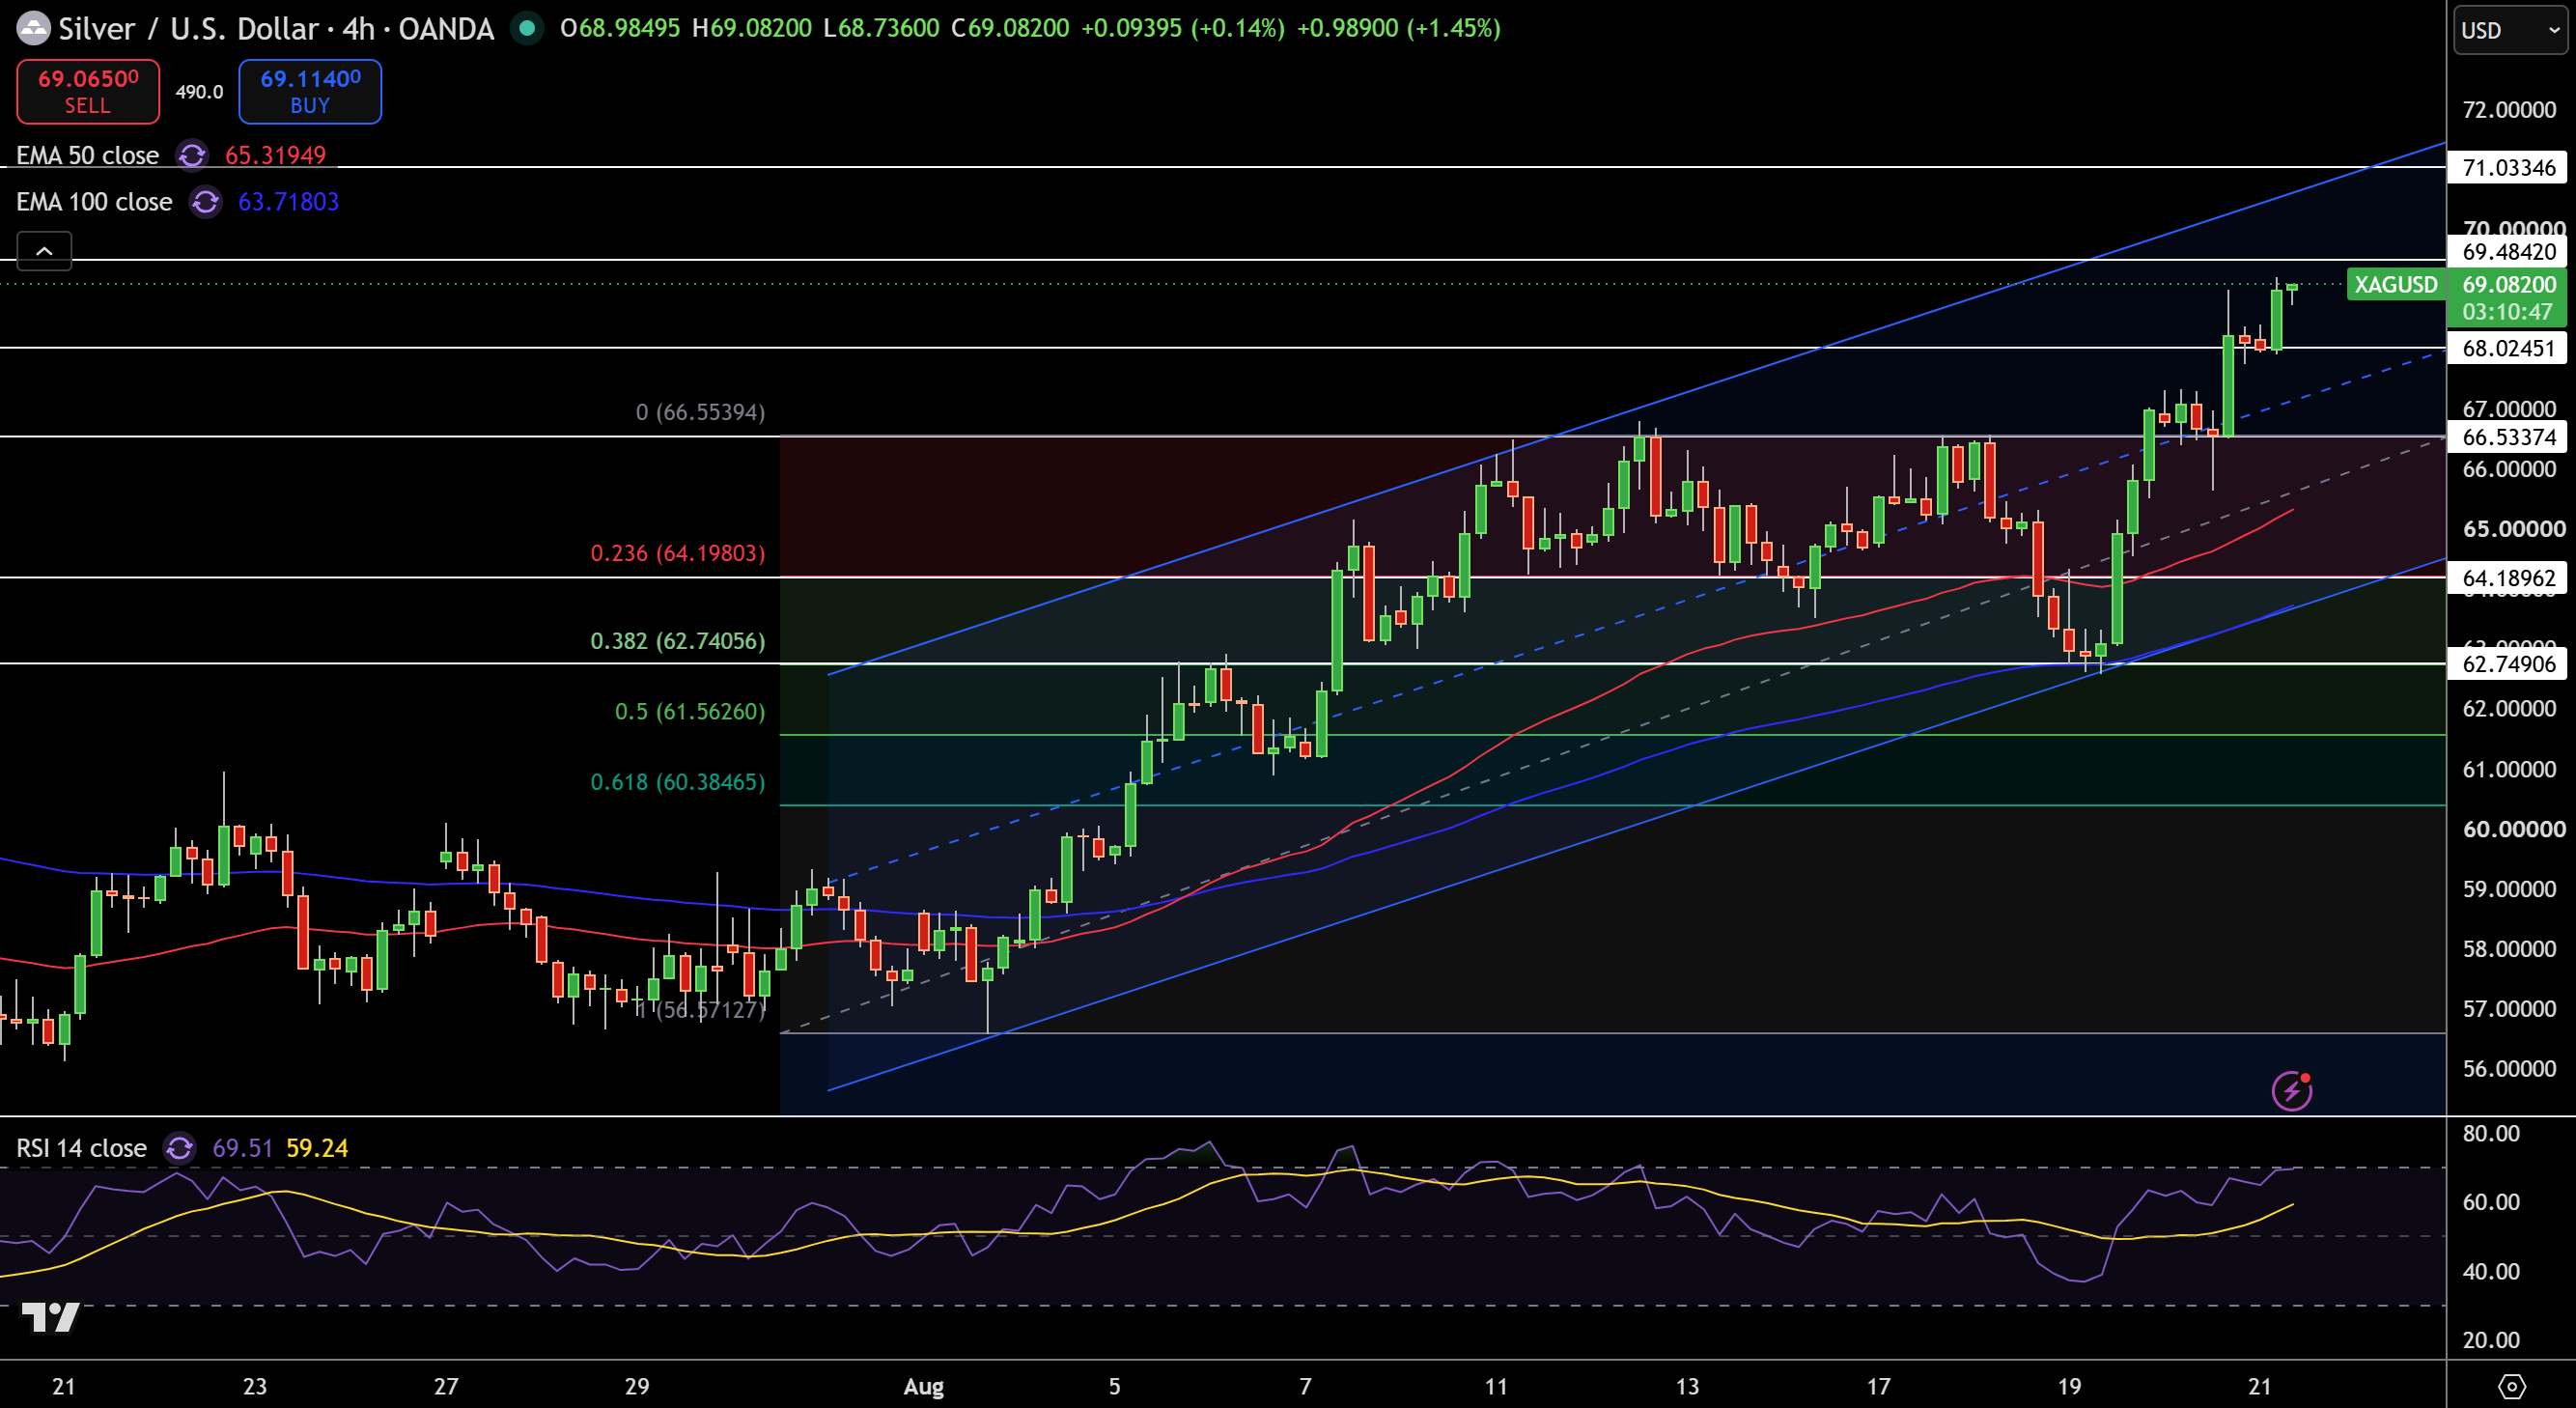
Silver is currently trading at $69.08 on the 4 hour chart after the break above the highs of the previous resistance at $66.55. Silver is comfortably above the 50 and 100 EMA at $65.32 and $63.72 respectively as the overall channel structure remains bullish. The latest move above $68.02 shows that silver remains in control after the recent rebound of the lower channel.
RSI is around 70, placing silver right near the overbought zone, which indicates there may be short-term spikes in volatility. For immediate resistance, we see $69.48 and $71.03. For important support, we have $68.02 and below that, we see $66.55 as well as $64.20 and $62.75.
Technically, I’m bullish on silver, as long as it stays above $68.02. If silver breaks and closes above $69.48, we could see the price push even higher to $71.03. However, a continued break below $66.55 would also weaken the current positive trend, and could lead to a longer-term correction.