
Gold News: Treasury Buybacks Ease Yield Pressure as Fed Stays Cautious
Gold and silver fundamentals on August 20 are changing drastically with the sudden reversal in the U.S. bond market. The Treasury Department has surprised investors by doubling buybacks of long-dated government debt. The increased buybacks have boosted demand for Treasuries and driven long-term yields down, making the dollar weaker, and addressing a major concern for non-yielding precious metals. Until recently the U.S. 30-year yield had risen to 5.3%, its highest level since 2007, due to concerns for rising deficits, heavy issuance, and inflation caused by the Middle East.
Outside of bond markets, the Fed is concerned for inflation. The minutes on their July meeting revealed a broader focus on inflation than the 9-3 vote showed. Several members indicated that they would consider further tightening if inflation does not show progress. However, the markets still assume that there is a two-thirds probability that the Fed stands still on interest rates this September, due to the weaker domestic and international consumption and labor data released after the July meeting.
High demand for gold is still supported by major buyers. Central banks bought a record 289 tonnes in Q2, worth about $45 billion, while China bought about 20 tonnes in July. A World Gold Council survey found 45% of central banks would continue to buy gold to support demand for reserve diversification.
Silver has an industrial side with a separate supply side. 2026 forecasts a sixth straight year of annual deficits in the market. The market overall is projected to have a deficit because of stronger demand from AI infrastructure, data centers, electronics, automated systems, and the power grid. As the market grows, there will also be a gown in sizing, but it will be mostly offset by decreased demand for solar energy due to the effect of both thrifting and the substitution effect.
For August 20, the driver for silver prices is weighed by lower bond yields, persistent central bank buying, geopolitical risks and a stubborn Fed that continues to resist declaring victory over inflation.

Gold Technical Analysis: XAU/USD Breaks Descending Trendline as $4,595 Comes Into View
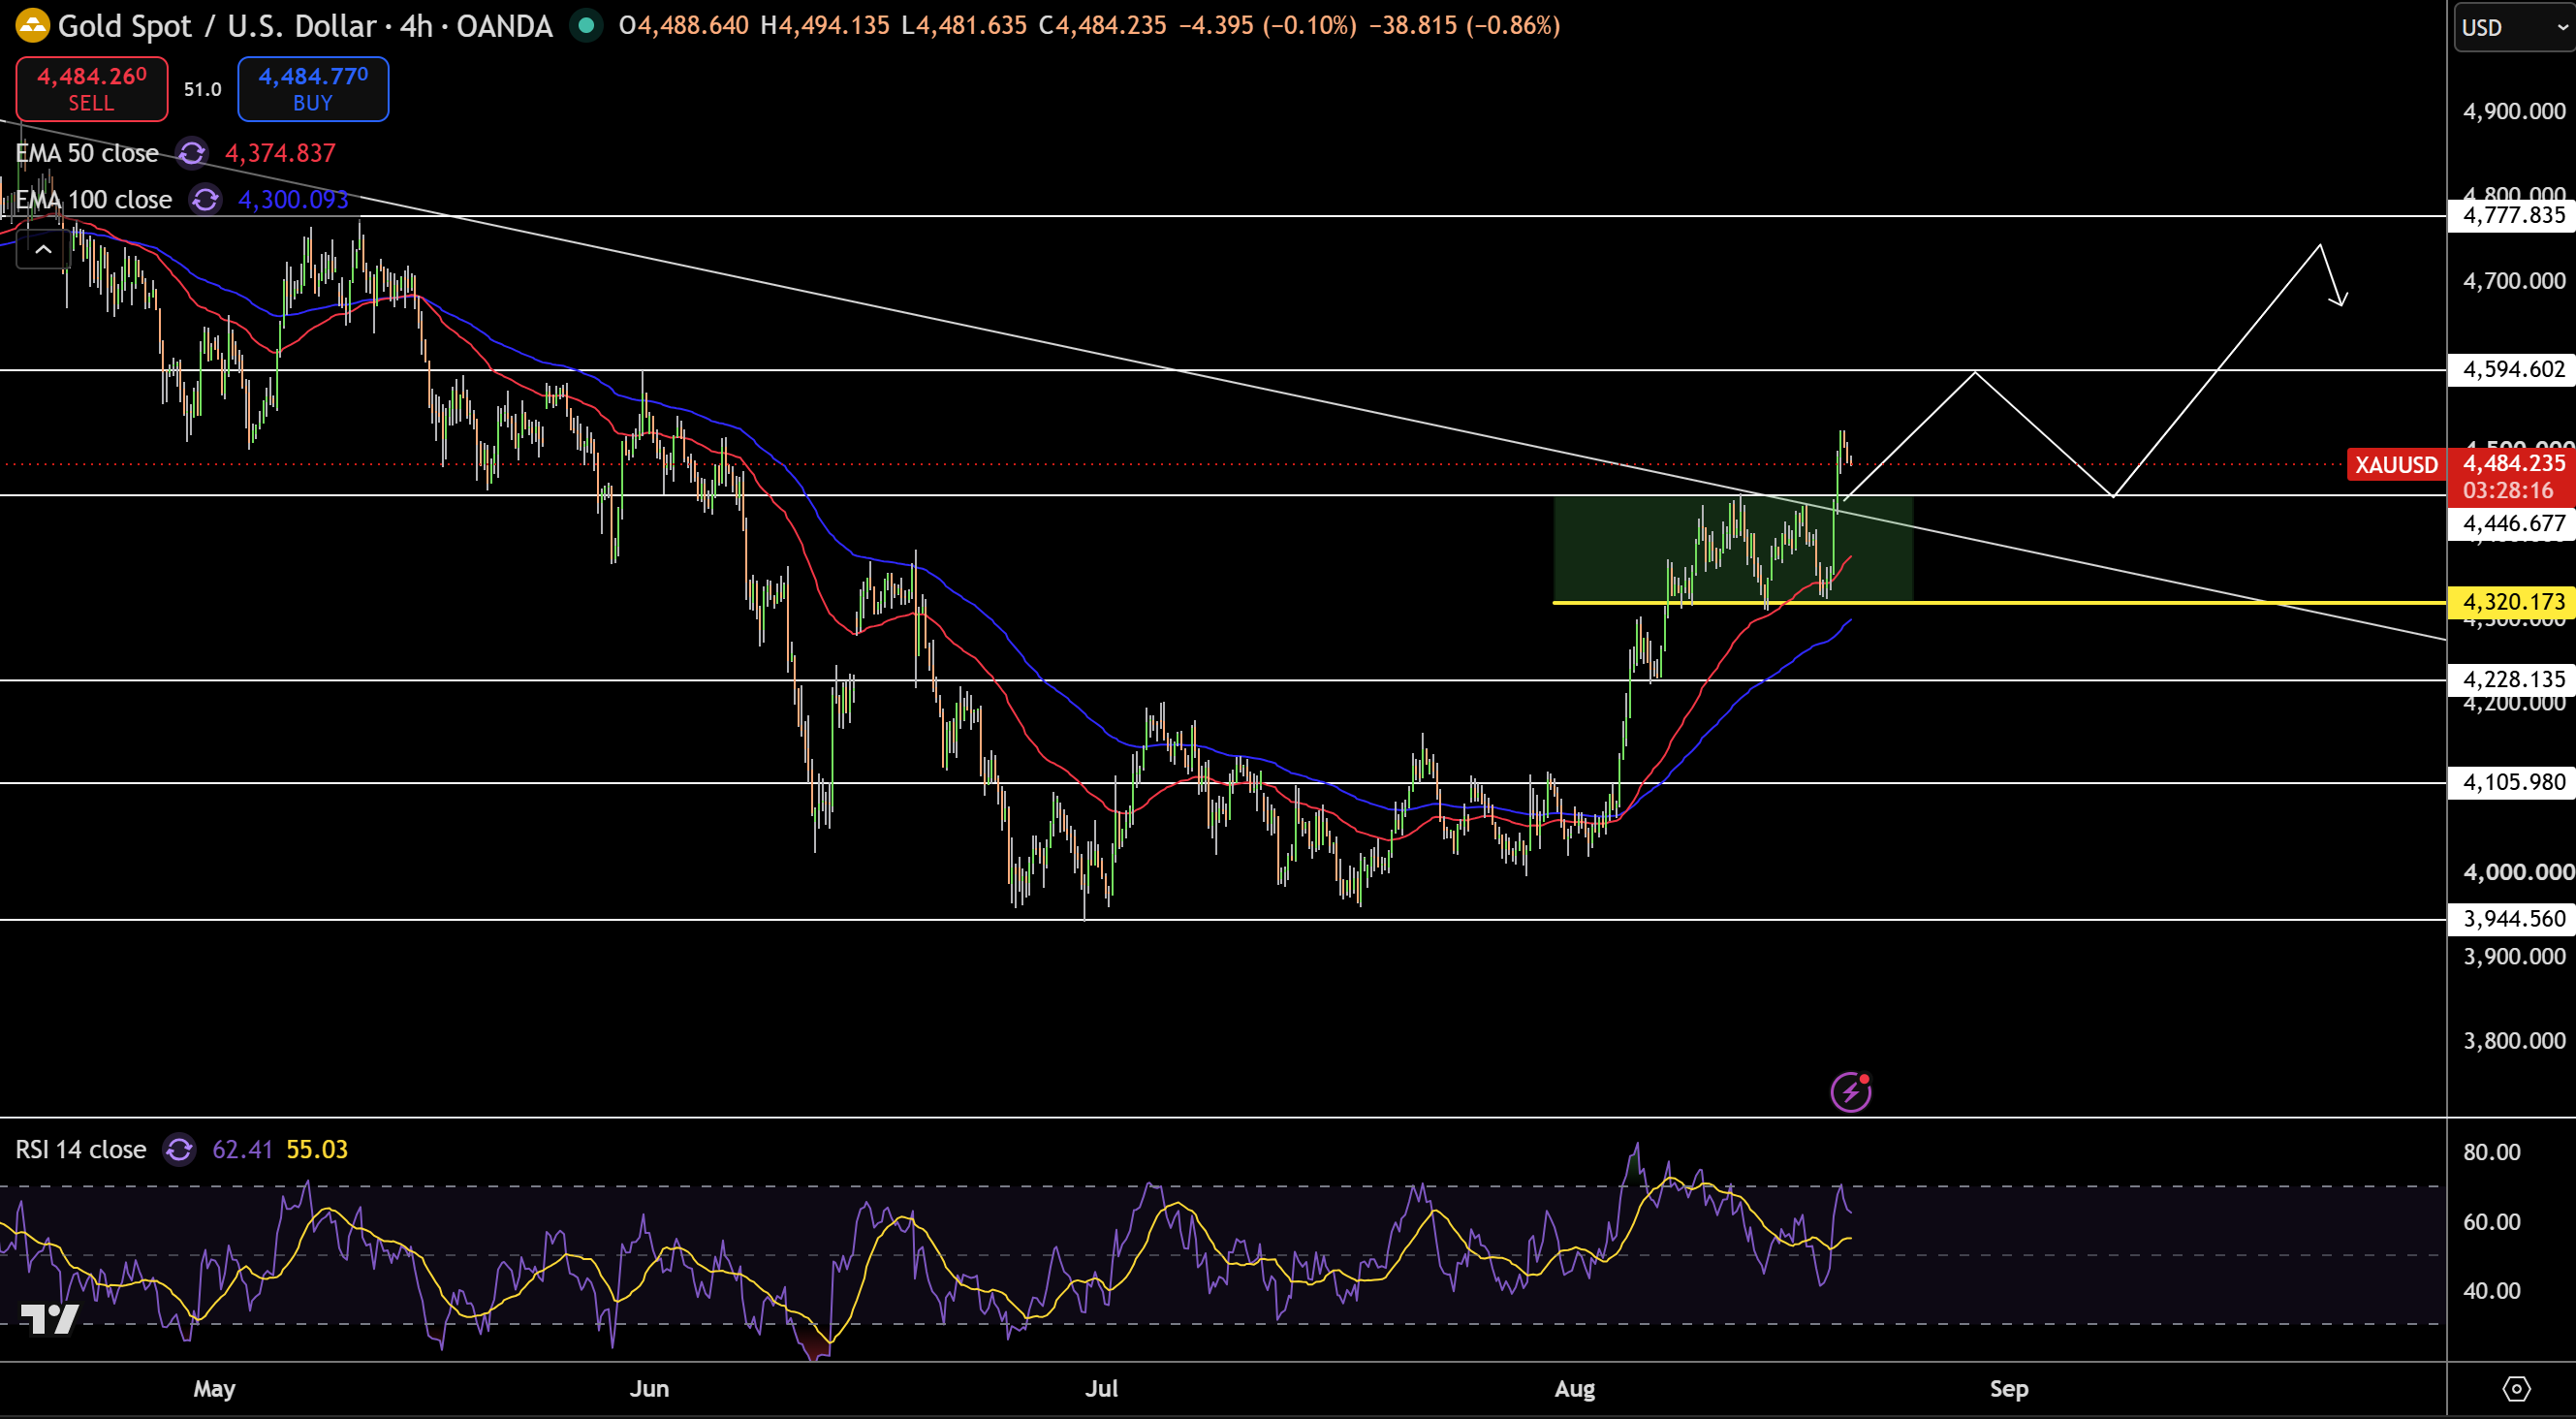
Gold is currently trading at $4,484 and has broken above a lengthy descending trendline that had limited the recovery. Gold is trading above the 50 and 100 EMAs that continue to provide sufficient structure below at $4,375 and $4,300 respectively. Gold has now broken above the previous resistance area at $4,447, and should price decline this level will now act as support.
RSI is currently at 62 and is indicating that gold has sufficient upward pressure while avoiding extreme overbought. Resistance currently rests at $4,595 and $4,778. First support will be at the $4,447 area with additional support at $4,320 and $4,228. In my opinion, a break above $4,447 will allow for further tests of $4,595. Breaking $4,320 would significantly deteriorate the price structure.
Gold Price Forecast
Every new Gold analysis as it publishes, today's technical signal and key levels, live price — on one page.
See all Gold forecastsSilver Technical Analysis: XAG/USD Reclaims $66.55 as Rising Channel Remains Intact
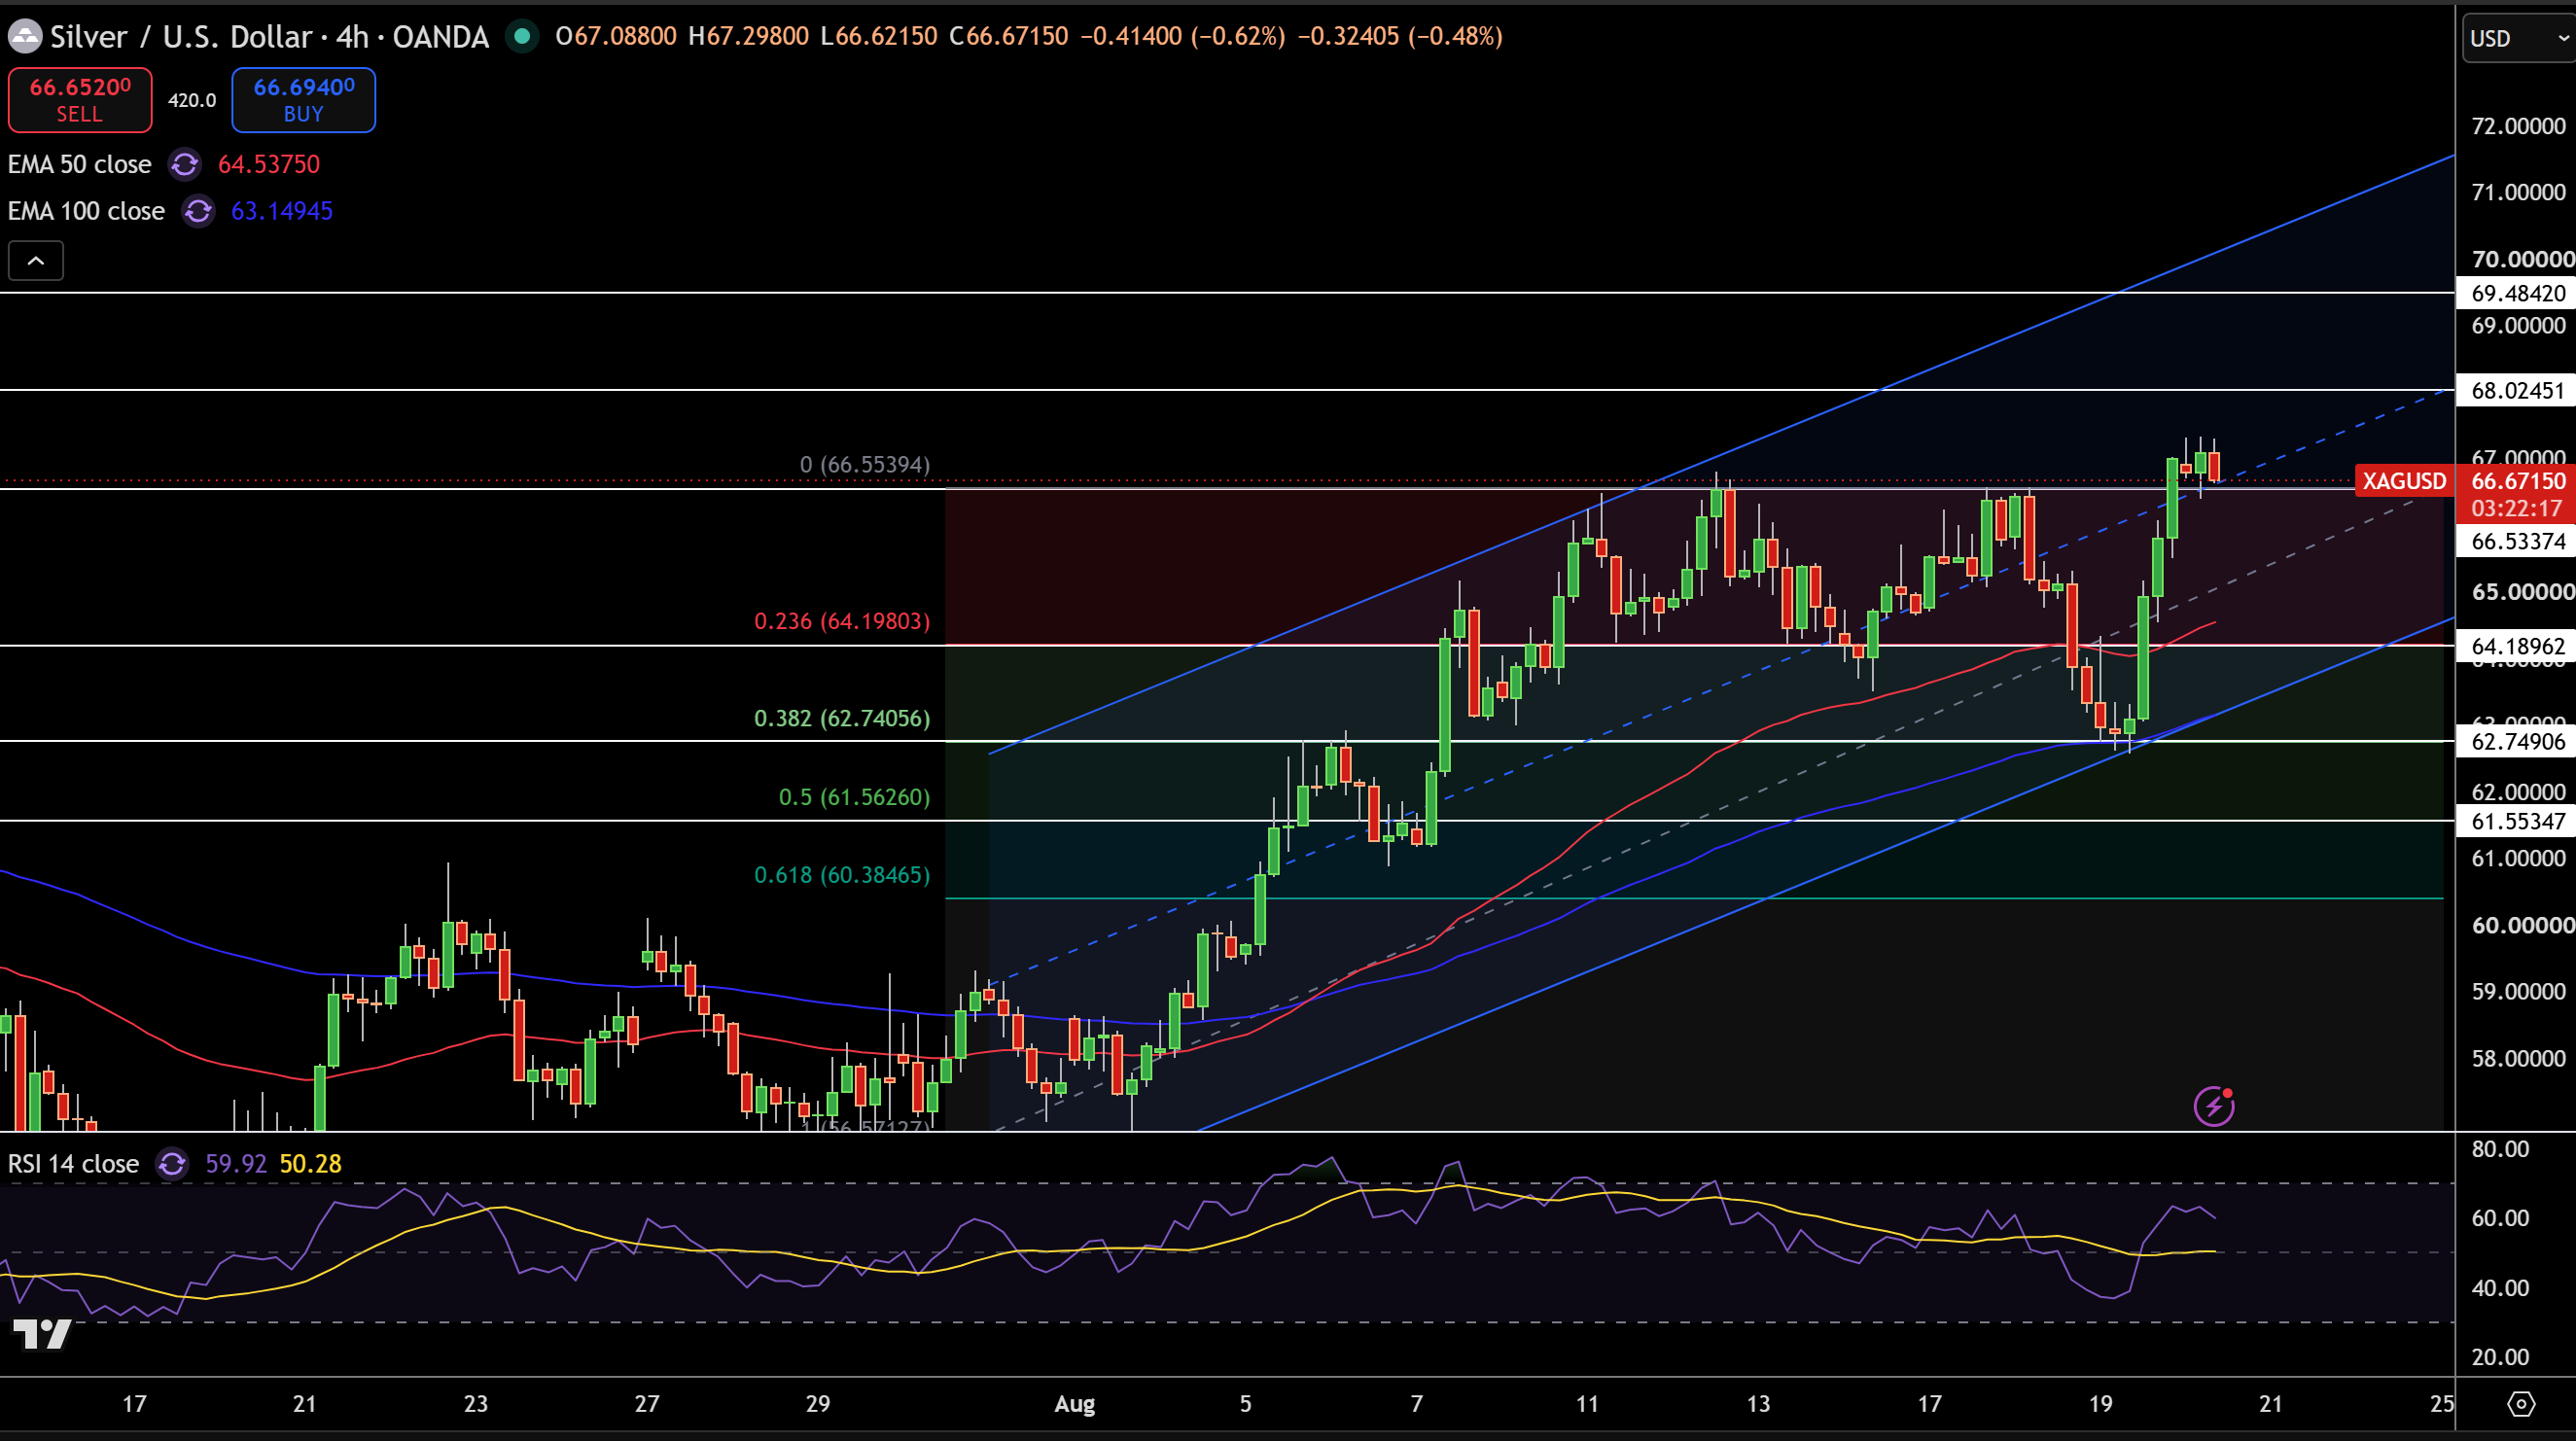
Silver is trading at $66.67 after bouncing off the lower boundary of its rising channel. Price is well above the 50 and 100 EMAs that rest at $64.54 and $63.15 respectively. The overall structure of the chart is bullish.
Silver has broken above the swing resistance area at $66.55 and has now acted as support. RSI is around 60, which shows some good upward momentum without having reached overbought. Around $68.02 is expected resistance, and $69.48 is the next expected resistance. On the downside, $66.55 is the new key support, with $64.20, $62.75, and $61.56 as the next support levels.
Silver remains bullish as long as it is trading above $66.55. A break of $68.02 would provide further upside towards $69.48. Until silver breaches the support level of $64.20, a bearish outlook would not be justified since lower channel support would remain intact.