
US Dollar News: Treasury Buybacks Weaken Dollar as ECB and BoE Stay Cautious
The U.S. dollar began August 20 with added pressure as bond market stress eased after the Treasury Department unexpectedly doubled longer-dated government bond buybacks, and the 30-year yield fell from its 19-year high of 5.337% to 5.211%. The Department Secretary Scott Bessent said buybacks of 10- to 30-year securities would rise from $2 billion to at least $4 billion per operation. The dollar also softened amid Fed minutes with continued concern for inflation and expectations for further tightening, though many of the policymakers had described recent price pressures as easing.
The softer U.S. dollar backdrop has driven the euro higher. For the European Central Bank, expectations are firmer. A Reuters survey showed the majority of respondents expected the ECB to lift its deposit rate to 2.50% next, after inflation in July hit 2.9%. ECB policymaker Olli Rehn said, however, at his Wednesday meeting that wage growth is still low, and there aren’t yet any clear signs of second-round inflation. This suggests policy makers will keep the more relaxed approach to honing policy in contrast to an aggressive rate hiking cycle.
Sterling’s fundamentals are more mixed. UK inflation rose to a four-month high of 2.9% in July, matching expectations but coming in a touch higher than the Bank of England’s estimate of 2.8%. Energy prices were the biggest cause after the capped prices increased by 13% and inflation for core goods and services remained at 2.6% and inflation for services fell to 3.4%. Private sector wage growth slowed to 2.8%. Additionally, there was a large decrease in job openings.
For central FX on August 20, we expect broad-based weakness in the U.S. dollar due to falling longer term yields and the ECB remaining on track for one more rate hike and the BoE’s challenges of higher inflation in energy and weakening employment.

U.S. Dollar Index Technical Analysis: DXY Breaks Rising Trendline as $98.41 Comes Into Focus
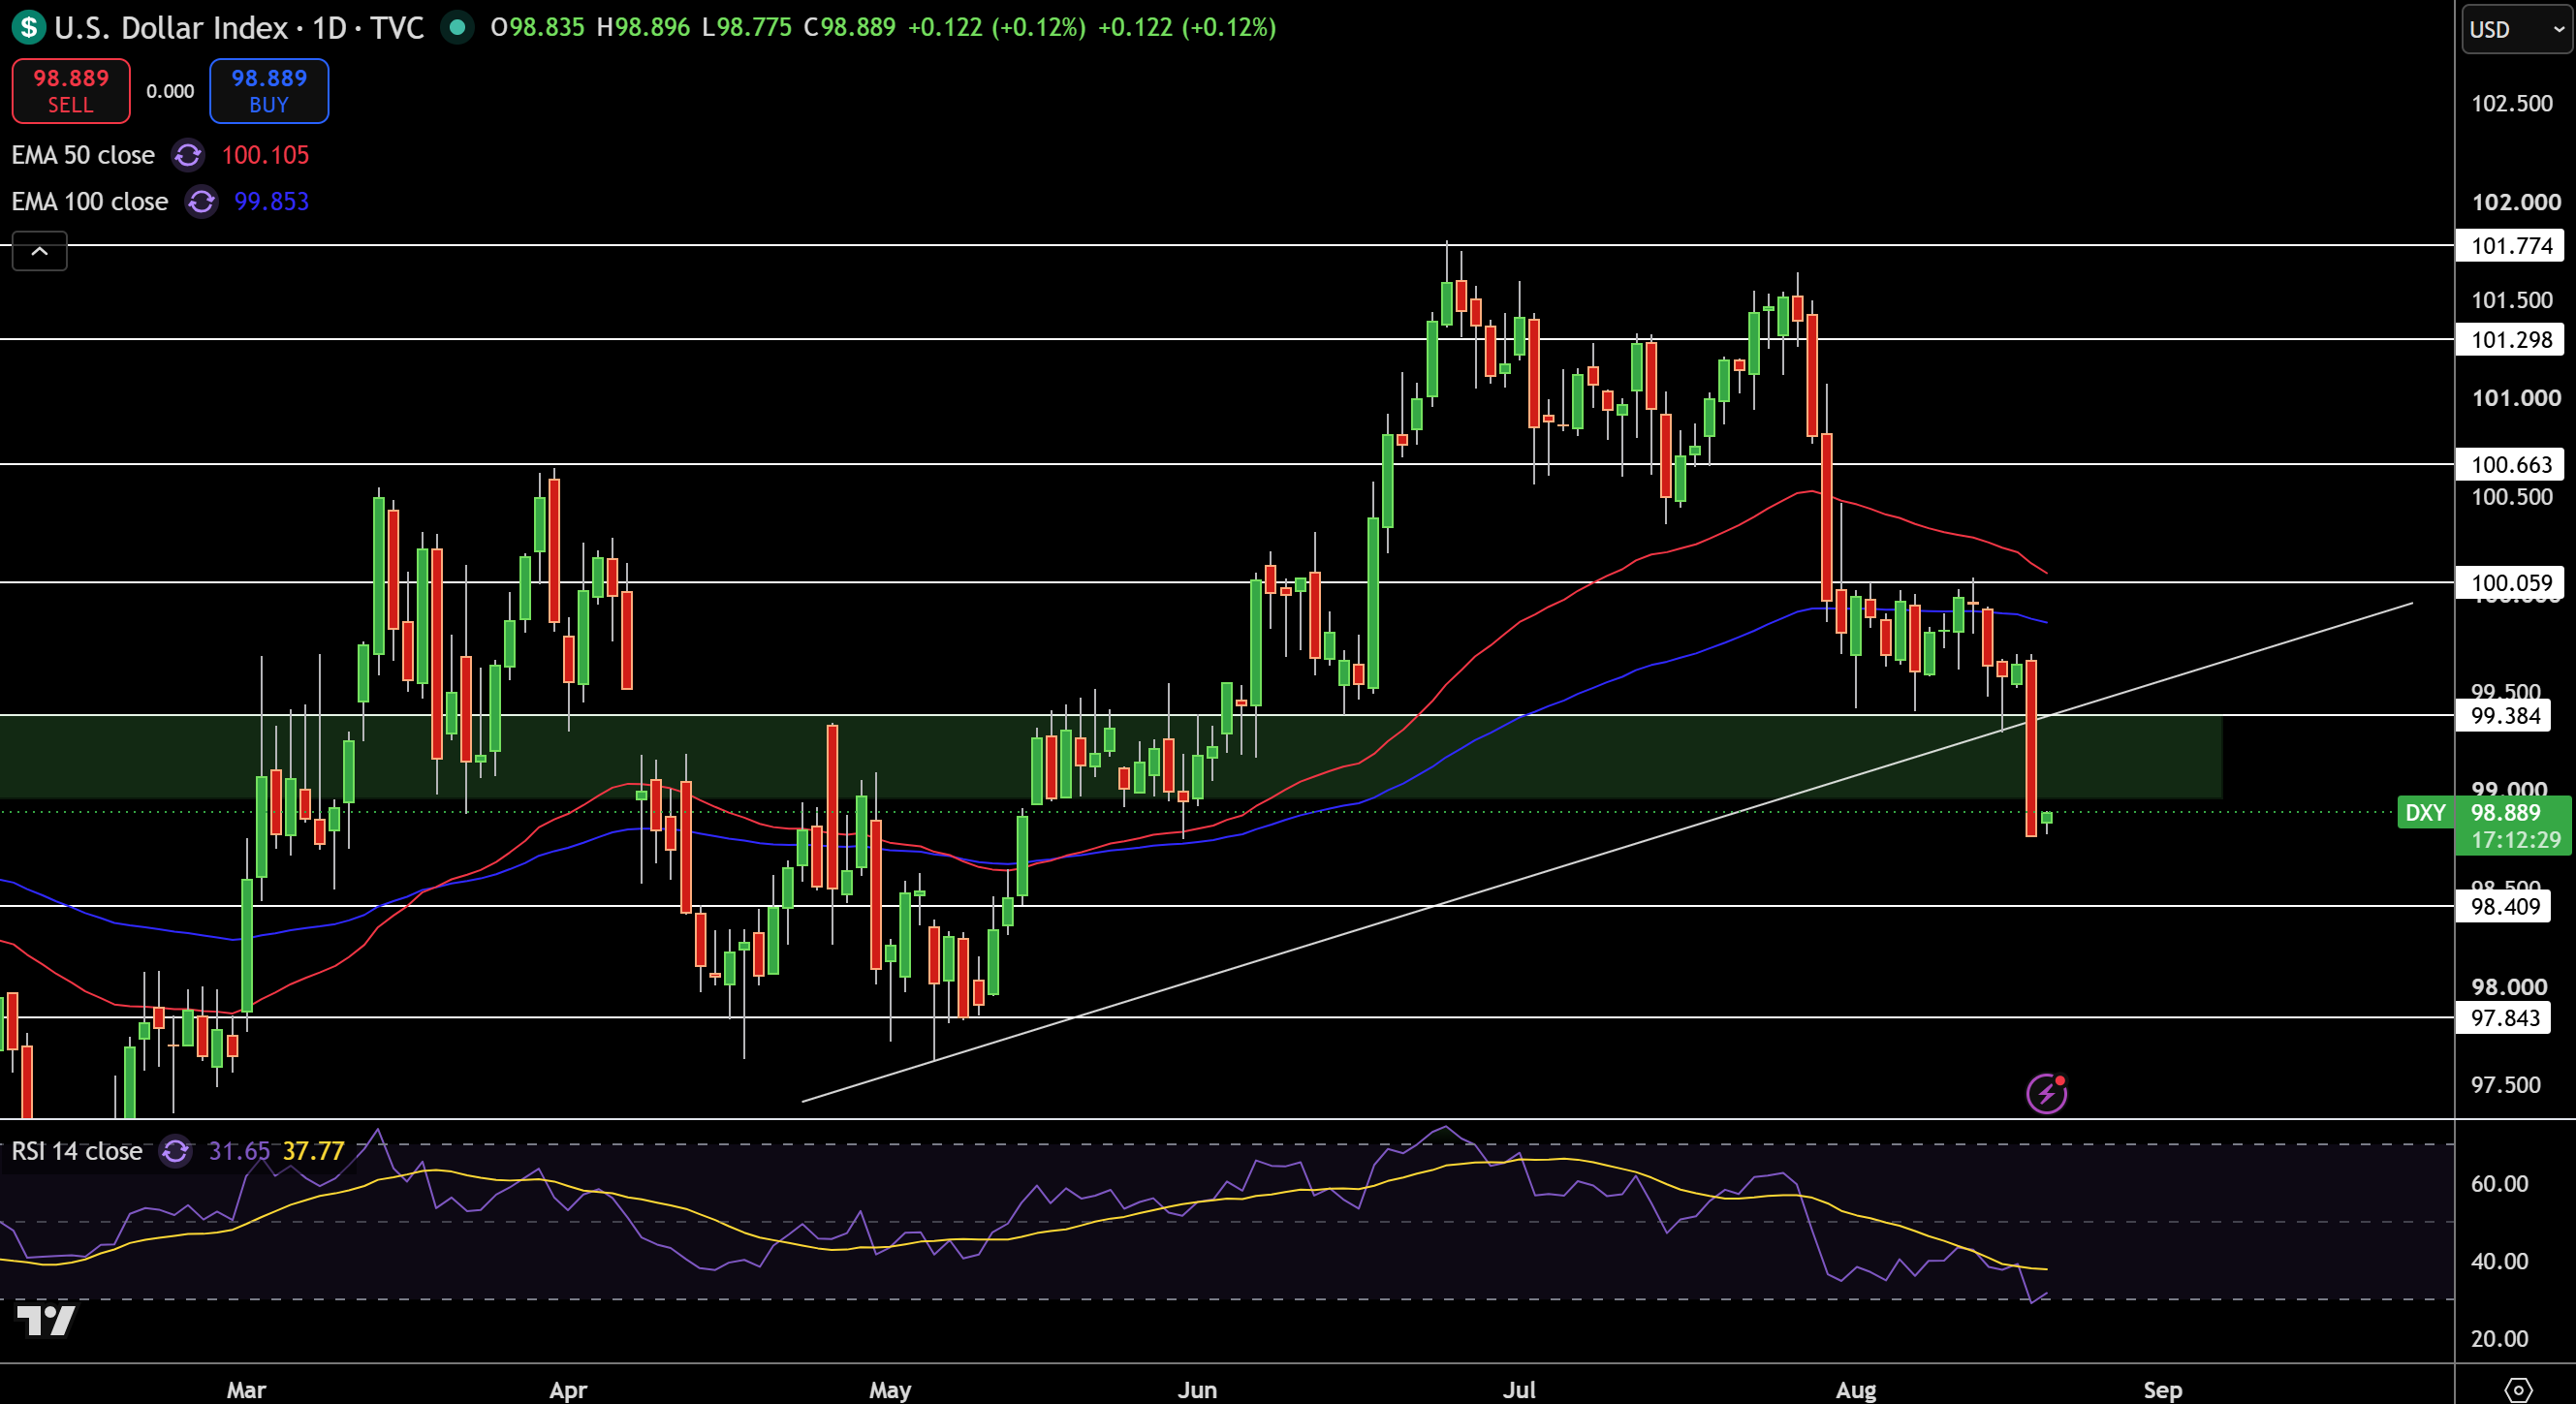
The U.S. Dollar Index (DXY) is trading at $98.89 on the daily chart after a significant breakout below a bullish rising trendline and the support at $99.38. Price is also trading below the 50-day EMA at $100.11 and the 100-day EMA at $99.85, showing bullish short-term structure. The latest breakdown has created a bearish view of the DXY for the foreseeable future. The current trend has been broken and a small doji candlestick has formed, attempting a small correction.
RSI is currently around 32 showing that DXY is getting close to being oversold and that downside momentum is stretching. For now, resistance is at $99.38 and $100.06 and $100.66. As for support, we are looking at $98.41 and $97.84.
DXY is technically bearish for me as long as it is below $99.38. A move back towards the broken trend line is possible, but the structure would only improve significantly above $100.06. If we continue to move lower from $98.41, we could even see $97.84.
EUR/USD Price Forecast
Every new EUR/USD analysis as it publishes, today's technical signal and key levels, live price — on one page.
See all EUR/USD forecastsGBP/USD Technical Analysis: Pound Holds Rising Channel as $1.3630 Caps Immediate Upside
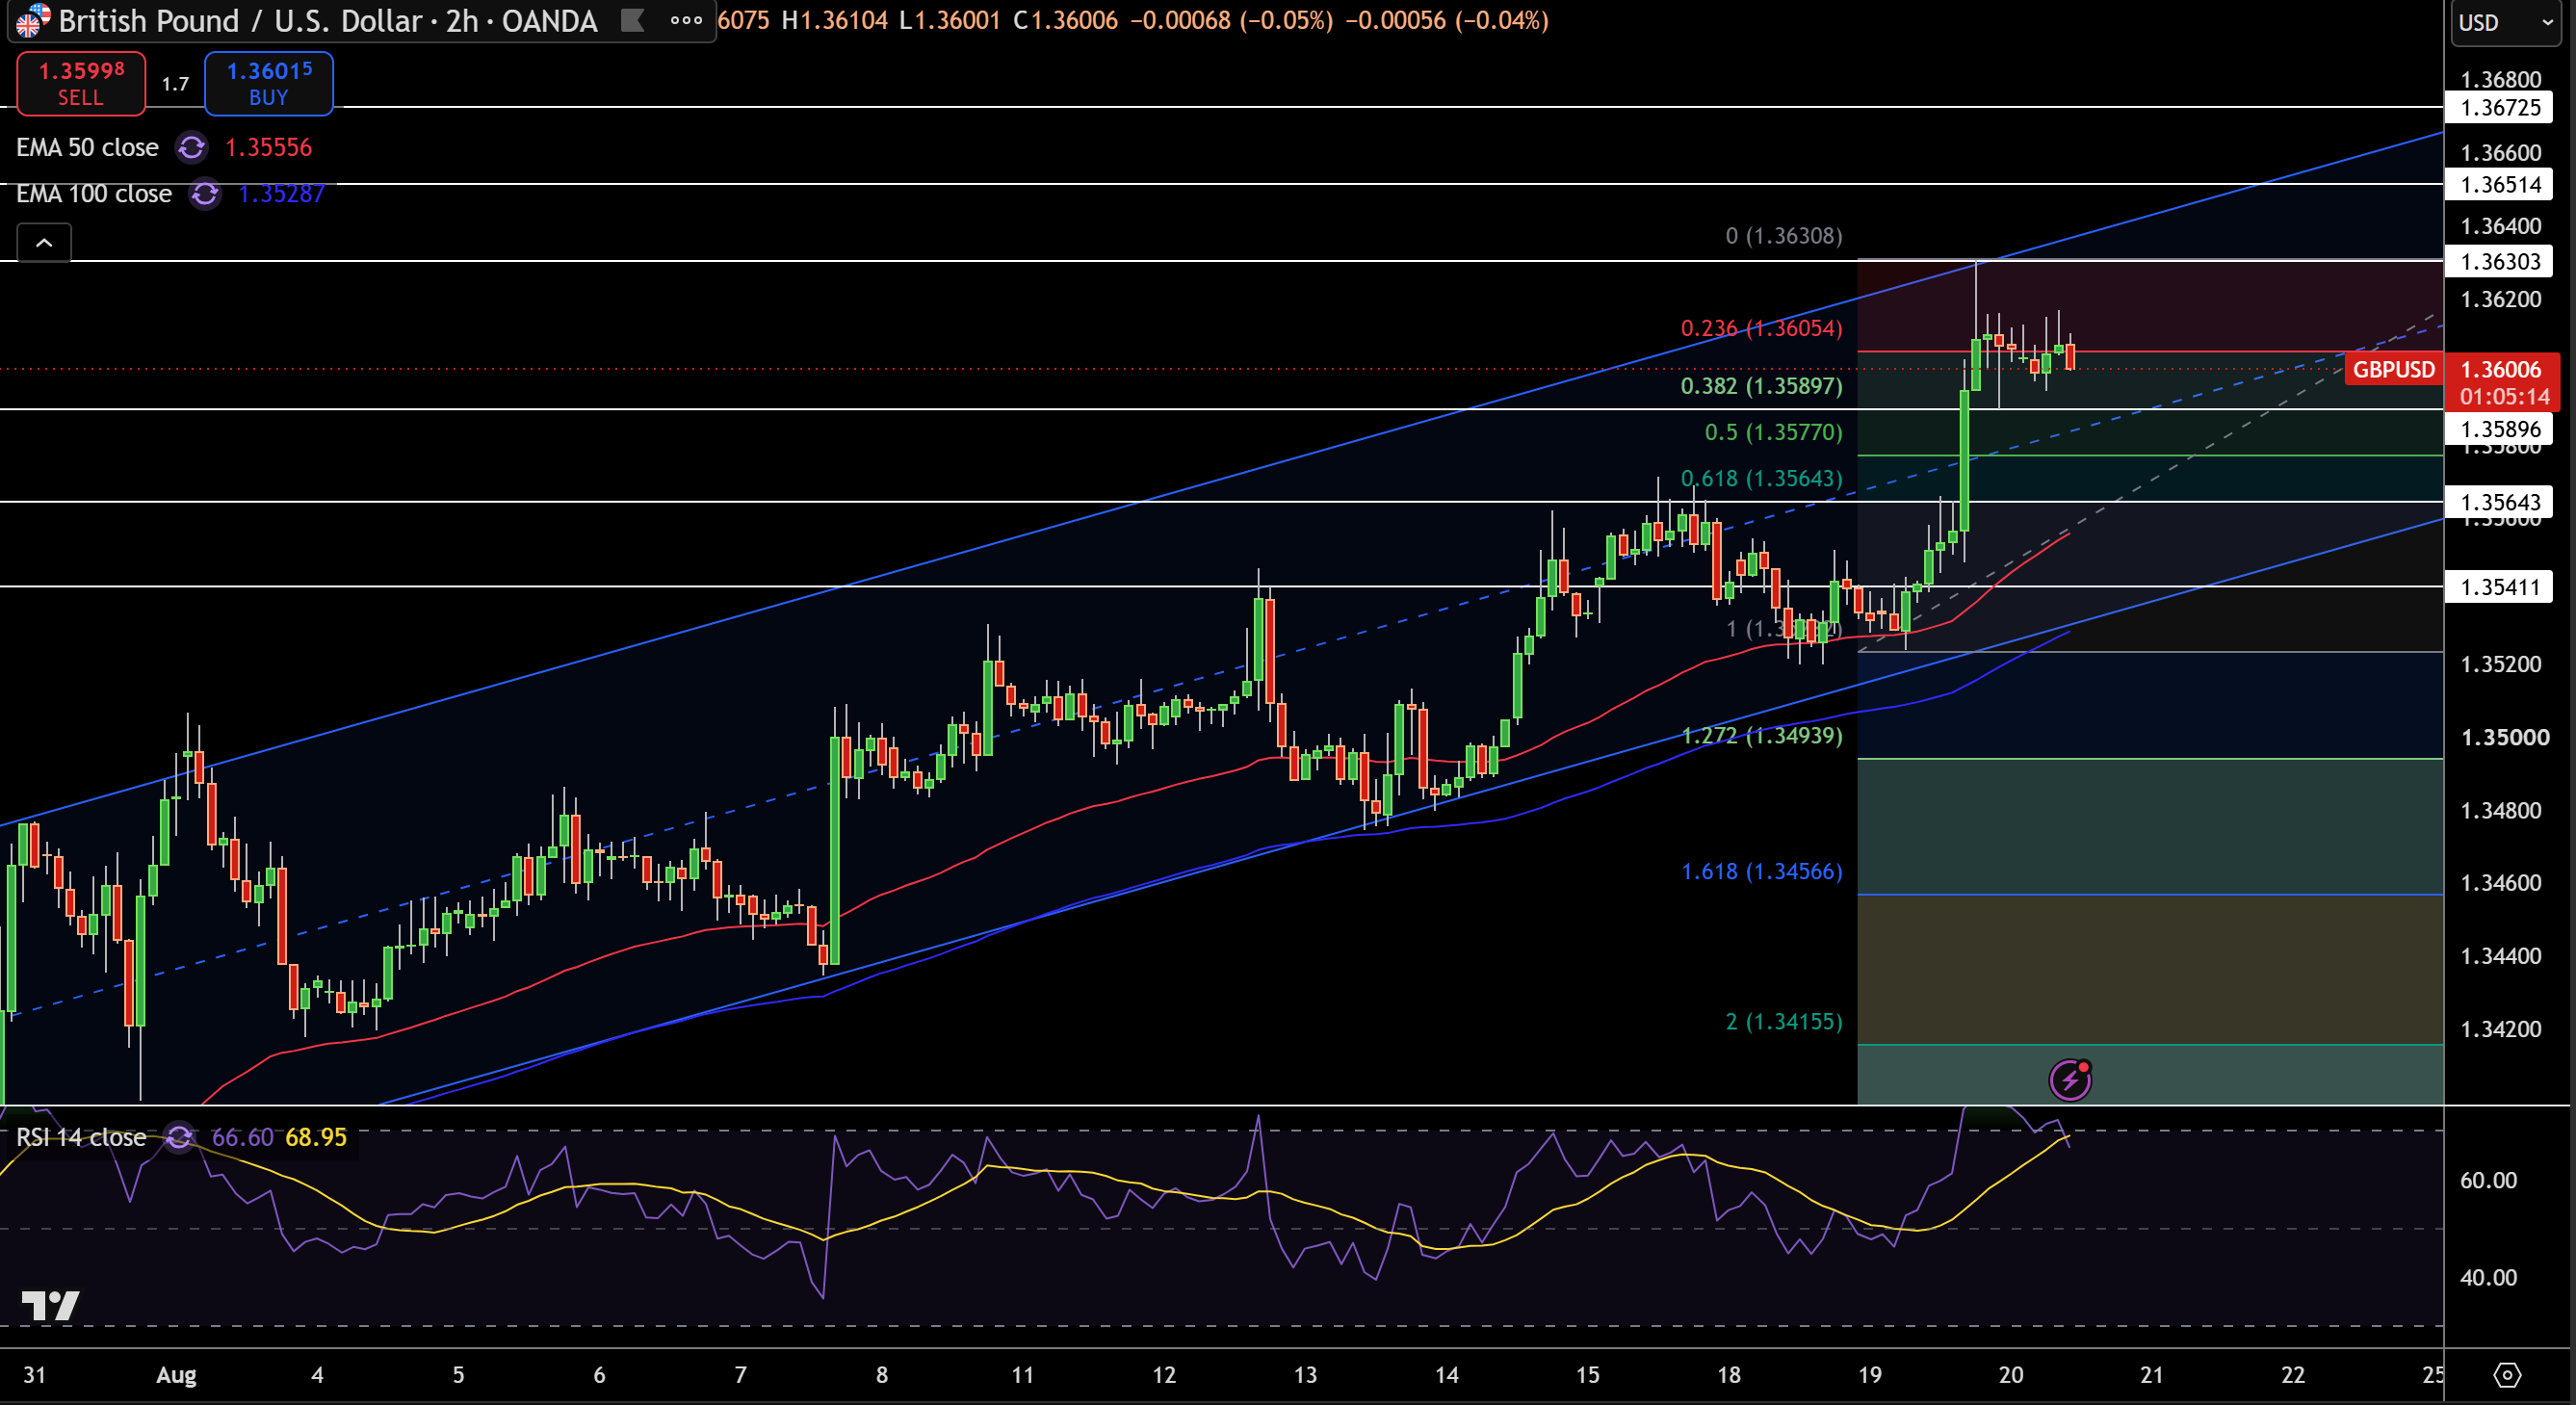
GBP/USD is trading at $1.3601 on the 2-hour chart. After a nice bullish breakout, price has moved well clear of the $1.3530-$1.3540 consolidation zone. Price is currently above the 50 EMA ($1.3556) and the 100 EMA ($1.3529), above both of which the bullish trend runs. The latest candles have formed a consolidation zone just below resistance at $1.3630.
At this moment, RSI is at 67 indicating strong bullish pressure that is starting to push the indicator into overbought territory. Resistance is expected at $1.3605, $1.3630, $1.3651, and $1.3673. Support is expected at $1.3590, $1.3577, $1.3564, and $1.3541.
I believe the short term view remains bullish as long as price is holding at/above $1.3577 to $1.3590. A strong clear break of $1.3630 has the potential to drive price to $1.3651, $1.3673, and beyond with ease. A break of $1.3564 will create a bearish outlook.
EUR/USD Technical Analysis: Euro Tests $1.1684 Resistance as Momentum Turns Overbought
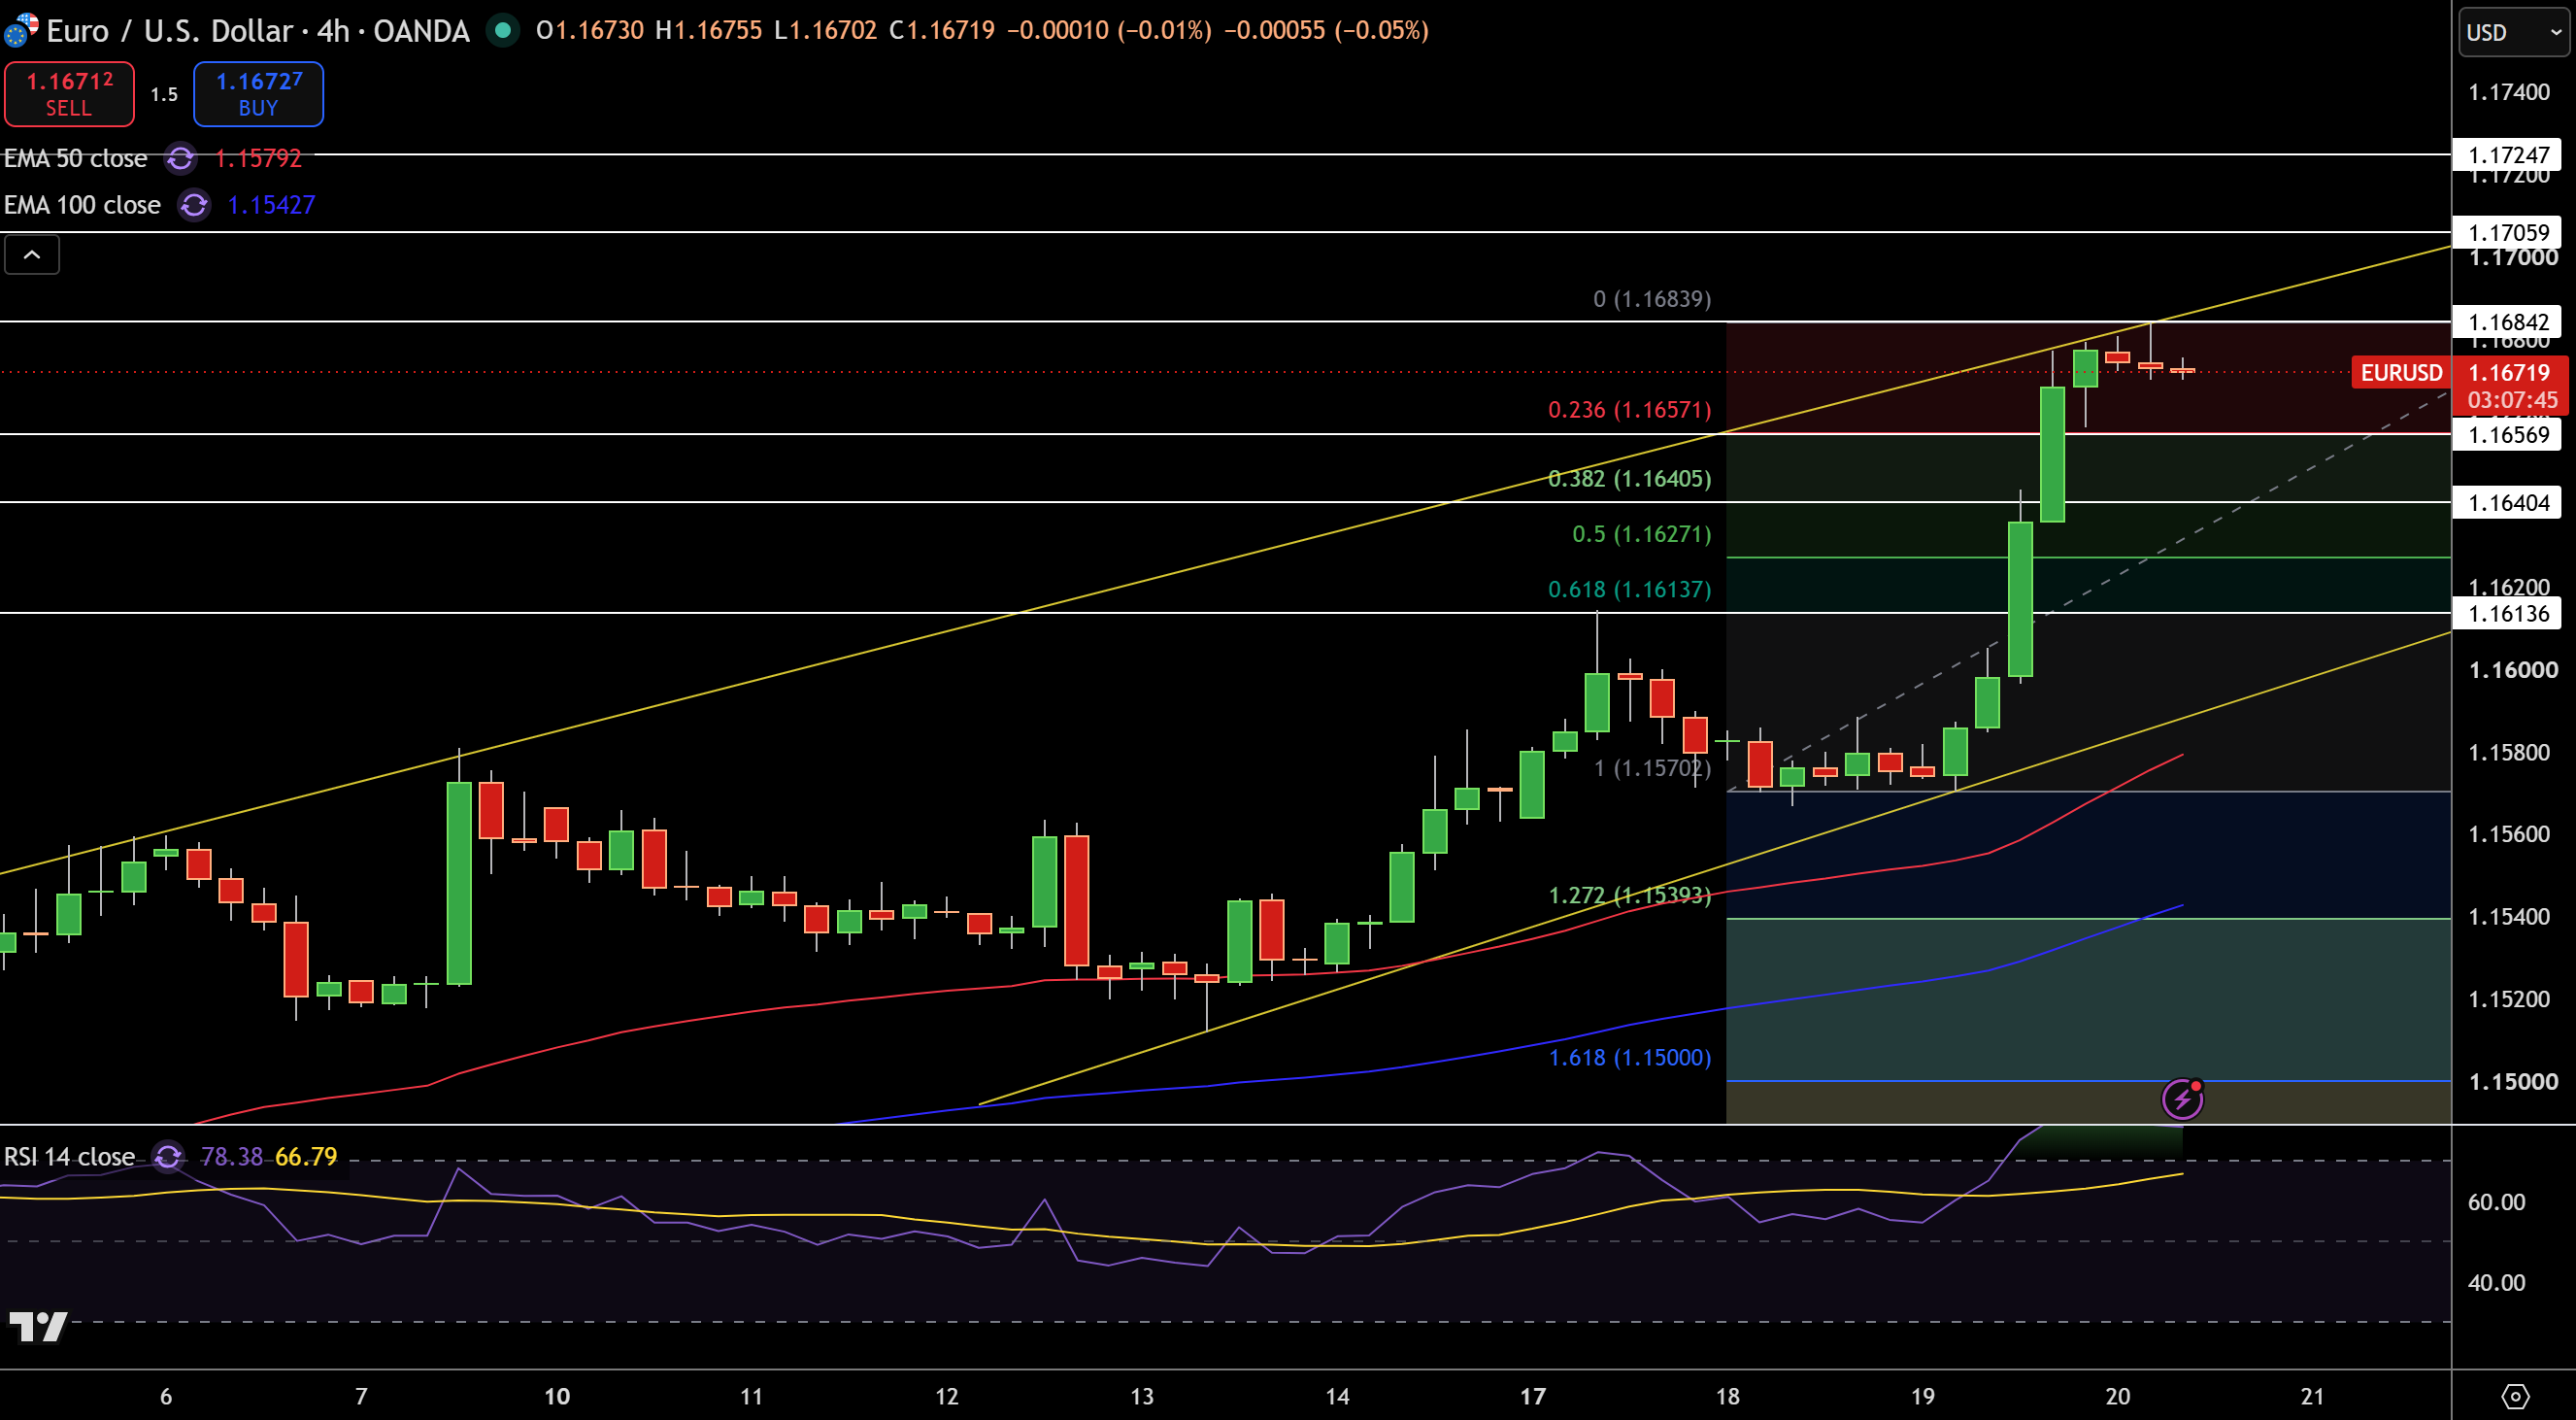
EUR/USD is trading at $1.1672 on the 4-hour chart after a significant breakout from the $1.1570 zone. Price sits well above the 50-EMA at $1.1579 and the 100-EMA at $1.1543 and continues to indicate a bullish short-term structure. The pair is consolidating along the top of the channel and is now approaching the $1.1684 resistance level, where the last few candlesticks have shown indecision after an aggressive rally.
RSI is at 78, overbought territory, and may offer a short-term consolidation or a correction pullback. Immediate resistance is at $1.1684 and is followed by $1.1706 and $1.1725. Price action will find support at $1.1657 and then at $1.1641, $1.1627 and finally at $1.1614.
EUR/USD will continue to be bullish as long as price action is consolidating above $1.1657. A break above $1.1684 will give a bullish view towards $1.1706 – $1.1725 while a break below $1.1641 will offer a bearish view towards $1.1614.