Oil News: Hormuz Standoff Persists as U.S. Inventories Build
On August 20 there continued to be little movement on the U.S.-Iran conflict and the Strait of Hormuz. The Strait, which accounts for approximately 20% of the world’s oil and which Washington says is open, still has well below normal levels of commerce. The UAE has stopped all economic and financial relations with Iran over accusations of missile attacks. With no signs of a resolution, this is supporting both WTI linked U.S. crude and Brent crude globally.
U.S. inventory data supported a bearish trend. According to the EIA, U.S. crude oil inventories grew by 4.4 million barrels, more than expected and counter to the expected draw. gasoline and distillate stocks all grew while refinery utilization reached 97.2 % indicating high global diesel and jet-fuel supply.
The outlook for oil demand globally remains cautious. The OPEC monthly report for August indicated global oil demand growth 2026 would likely be around 0.6 million barrels per day. which is less, and the IEA said high oil prices due to tensions in the Middle East are affecting demand.
Dried gas production in the U.S. is around record levels at 111 Bcf/d in 2026 while consumption in the power sector will remain high.
Global LNG conditions significantly tighten. European gas storage is around 61% compared to the five-year average of 78%, while Hormuz disruptions have restricted Qatari LNG flows and strengthened competition with Asian buyers for alternative cargoes.
As of August 20, the energy market remains fragmented. Driven by ample U.S. crude stockpiles and dampened crude demand expectations, the fundamentals of crude oil remain subdued, however, the elevated geopolitical supply risk and the impact of Hormuz and LNG are persisting.

Natural Gas Technical Analysis: NG Tests $2.80 Breakout Zone as Downtrend Weakens
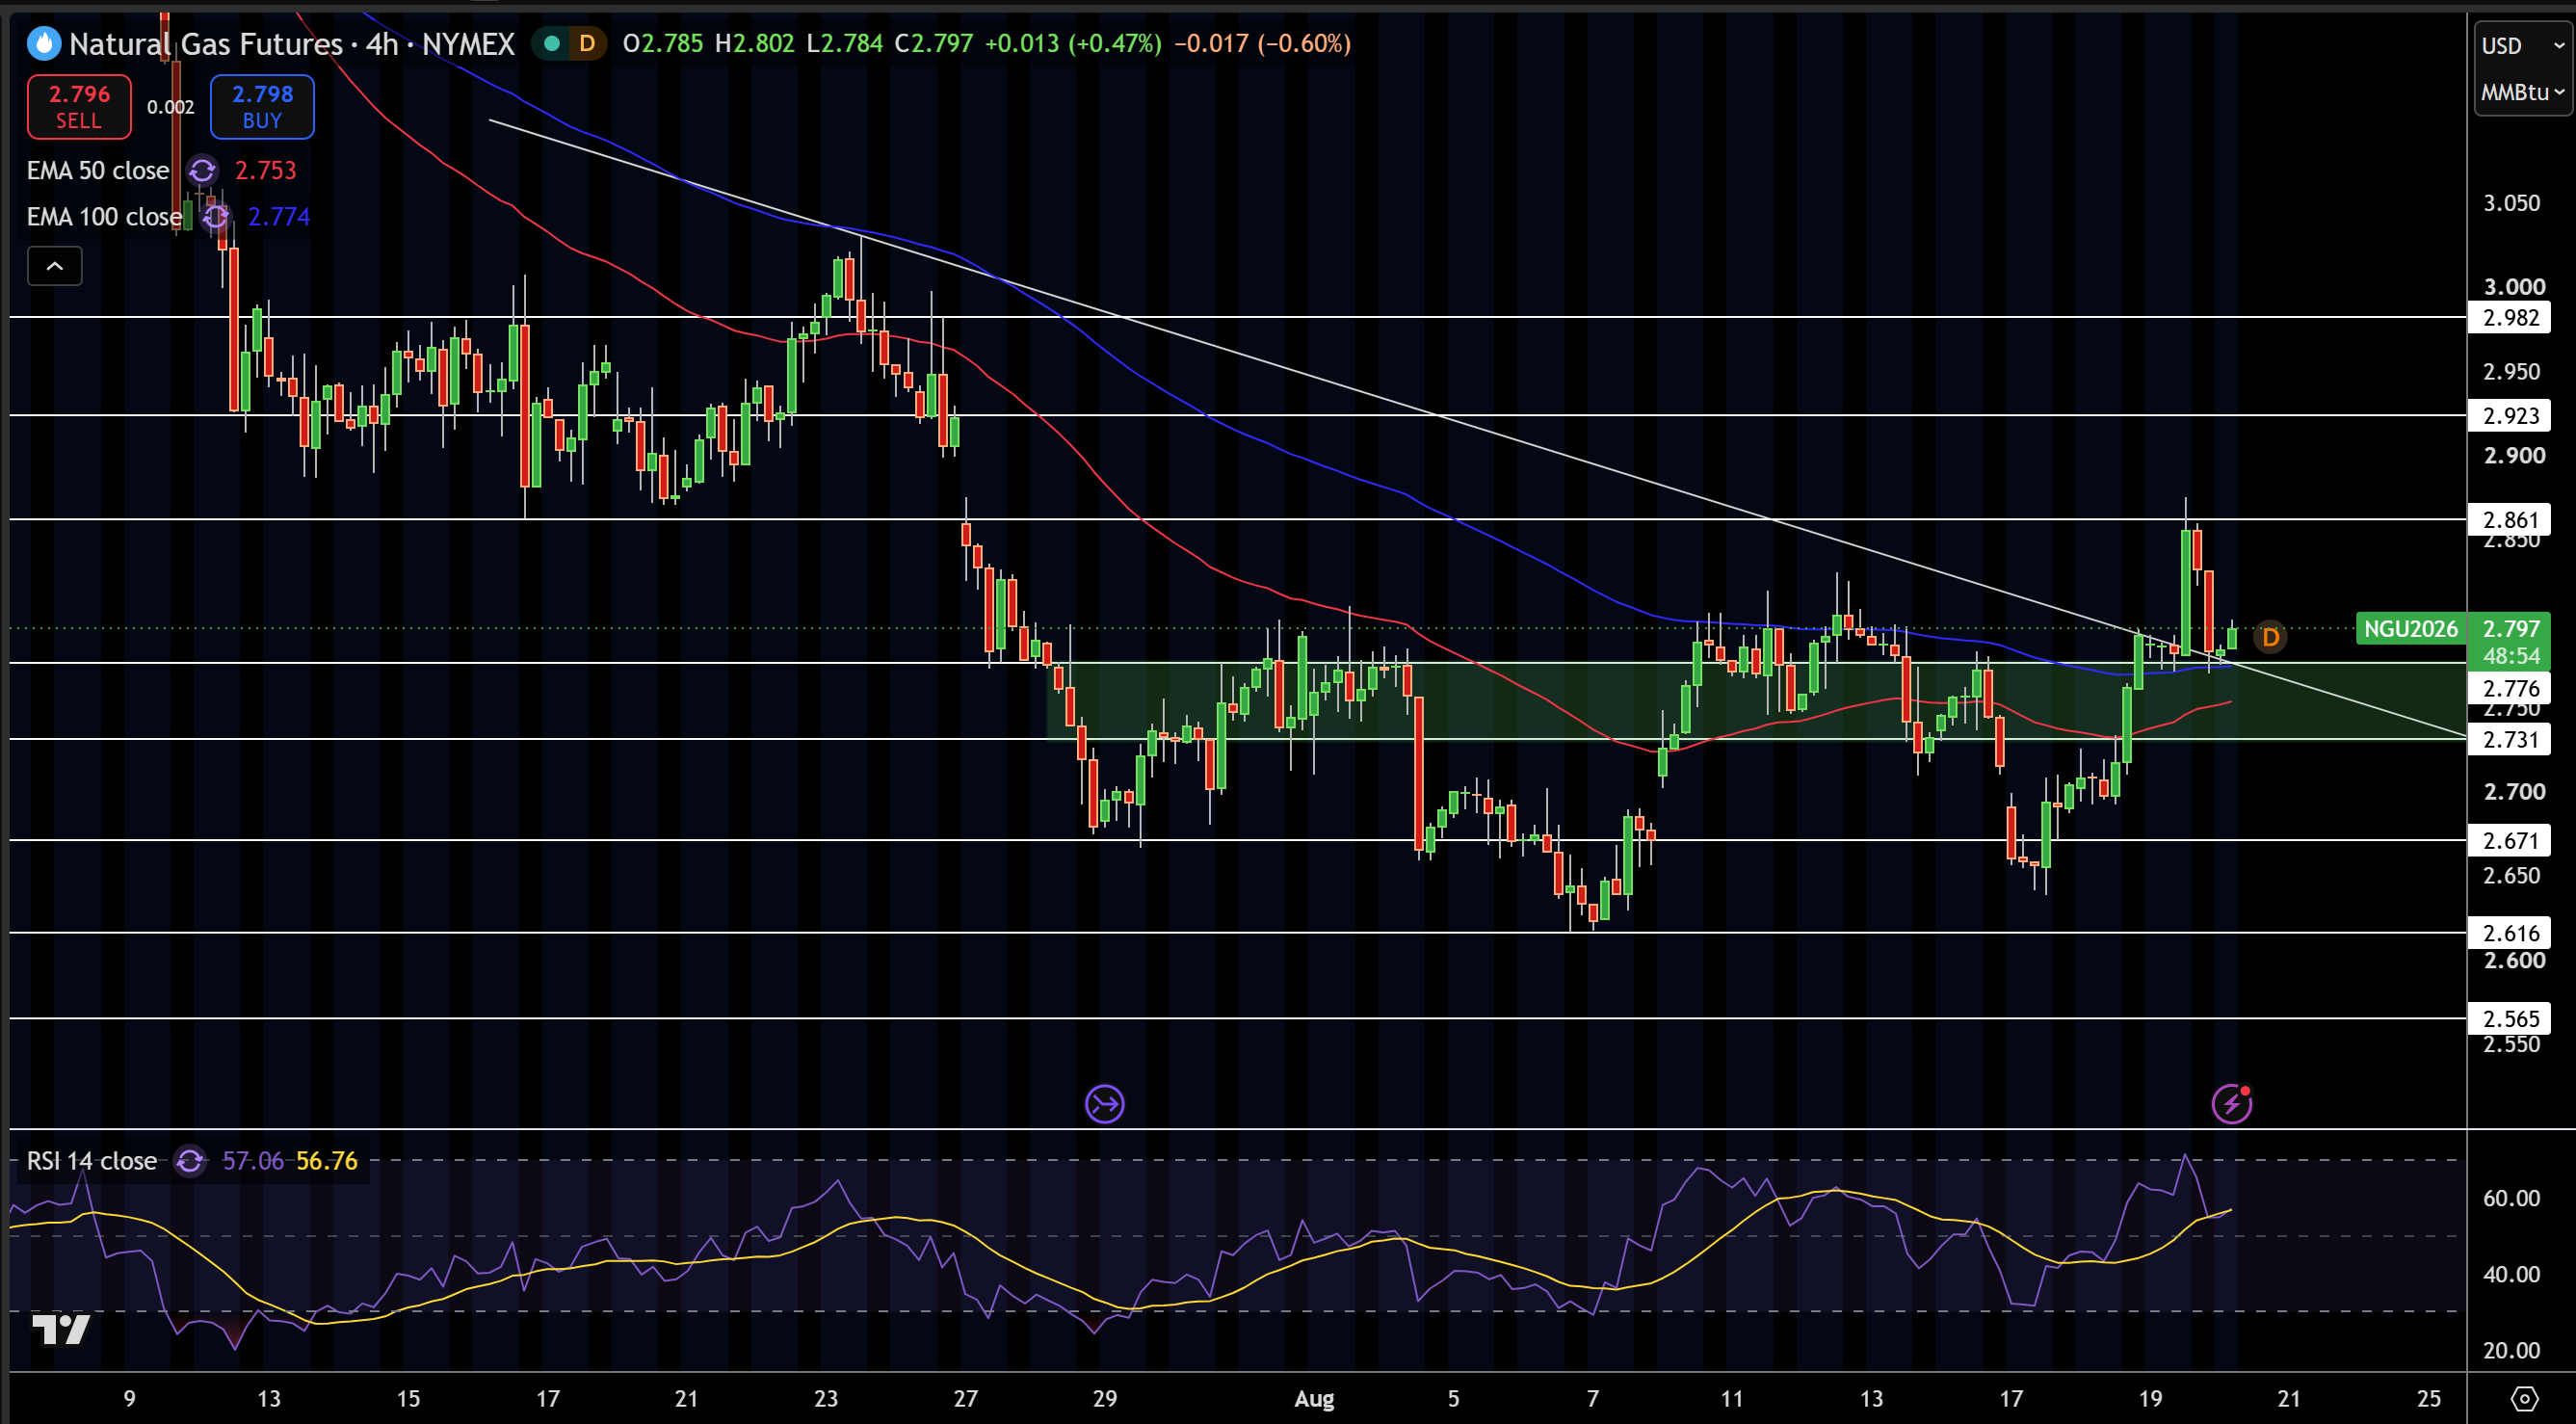
Natural gas is currently trading around $2.80 after a sharp recovery from the $2.65-$2.67 range. Natural gas has traded above the 50-EMA at $2.75, the 100-EMA at $2.77, and has even been tested the long-standing downtrend line. The $2.78 to $2.80 area is extremely important in the short term because if natural gas were to trade above this range it is potentially the start of a new short-term bullish trend.
RSI is at 57, which shows positive momentum without overbought conditions. Immediate resistance is at $2.80, and is followed by $2.86, $2.92, and $2.98. Support is at $2.77, $2.73, $2.67, and $2.62.
In the short term I am bullish on natural gas and would expect to see prices trade above the $2.80 area. A move back below the long-standing downtrend line would retest the $2.73 area and provide weak support.
Natural Gas Price Forecast
Every new Natural Gas analysis as it publishes, today's technical signal and key levels, live price — on one page.
See all Natural Gas forecastsWTI Crude Oil Technical Analysis: WTI Holds Above $83.79 as Bulls Target $86.87
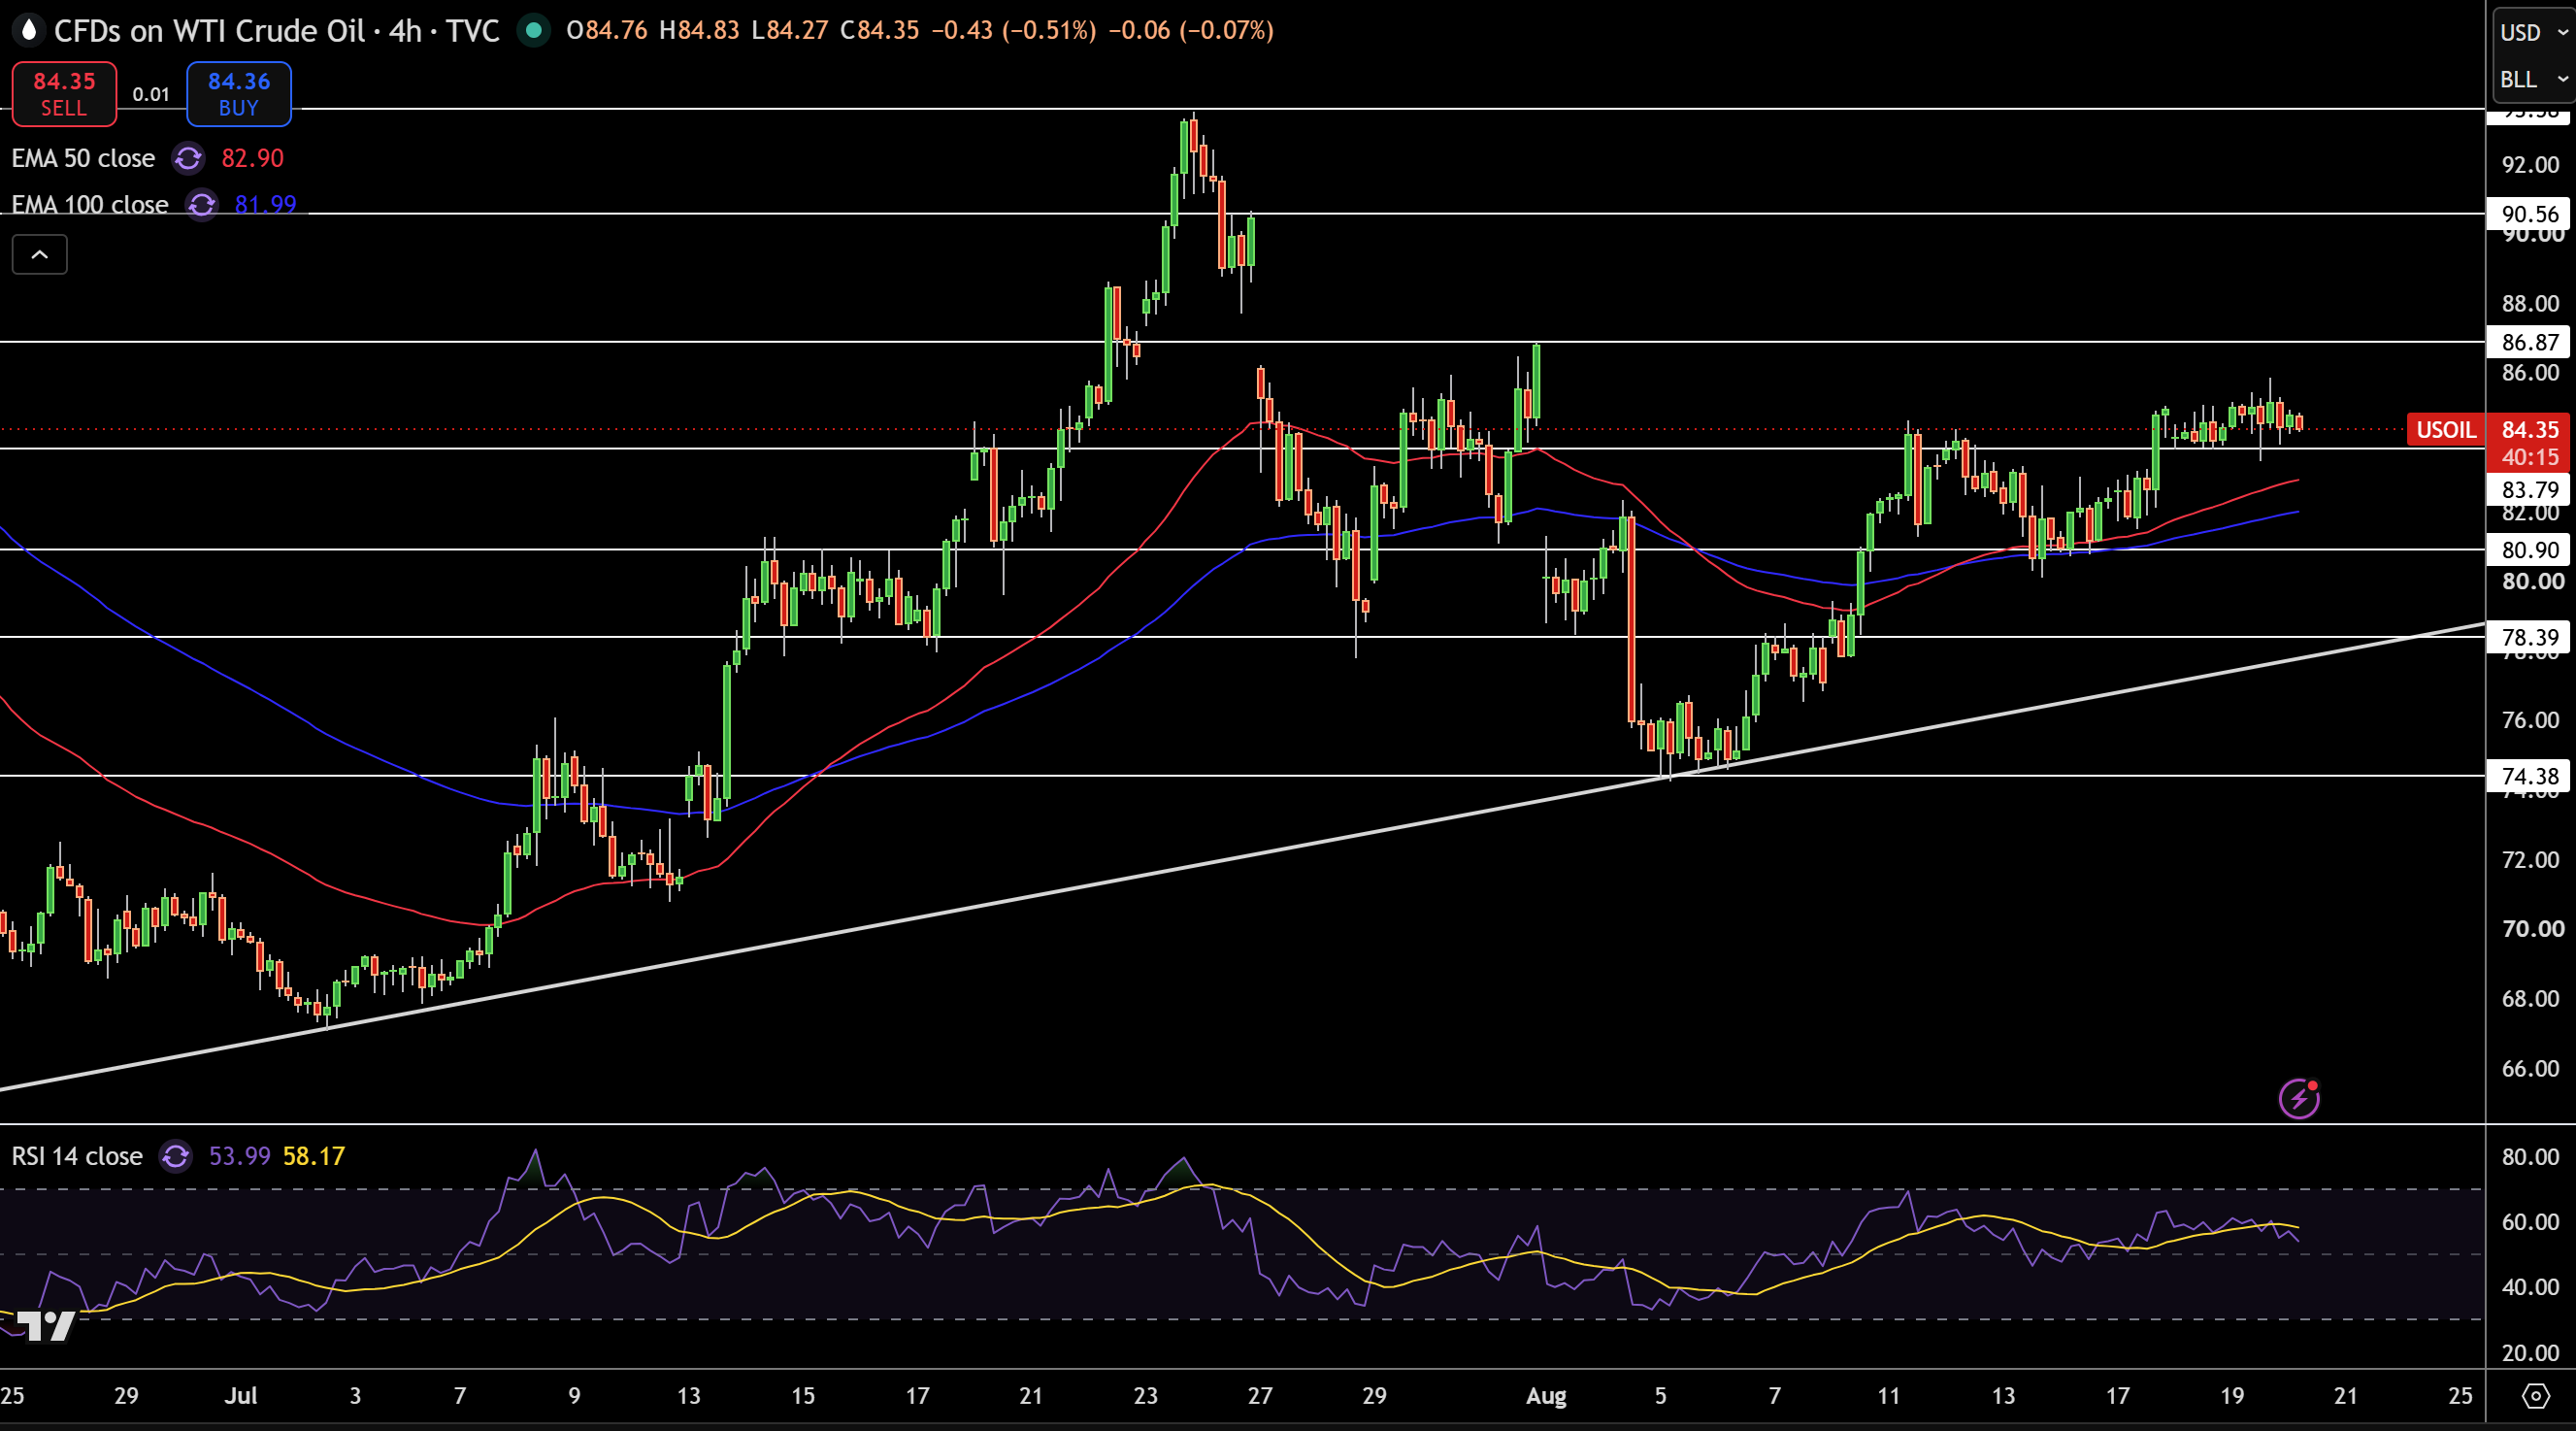
On the 4 hour chart, WTI is trading at $84.35 holding above the 50 EMA at $82.90 and the 100 EMA at $81.99. Price continues to make higher lows to the longer term rising trendline and the overall structure has remained intact after the move from the August lows. Bullish momentum slipped as price consolidated sideways below the next key level of resistance.
RSI is at 54, showing some positive but not overly bullish momentum. Support is at $83.79 followed by the EMA levels at $82.00 – $82.90 and $80.90. Resistance levels are at $86.87, $90.56, and $93.58.
Given the current price action, I think WTI is bullish above $83.79 with strong bullish momentum should we break $86.87. A breakdown of $81.99 would likely entail a deeper pullback down to $78.39.
Brent Crude Oil Technical Analysis: Brent Consolidates Above $90 as $93.78 Resistance Comes Into View
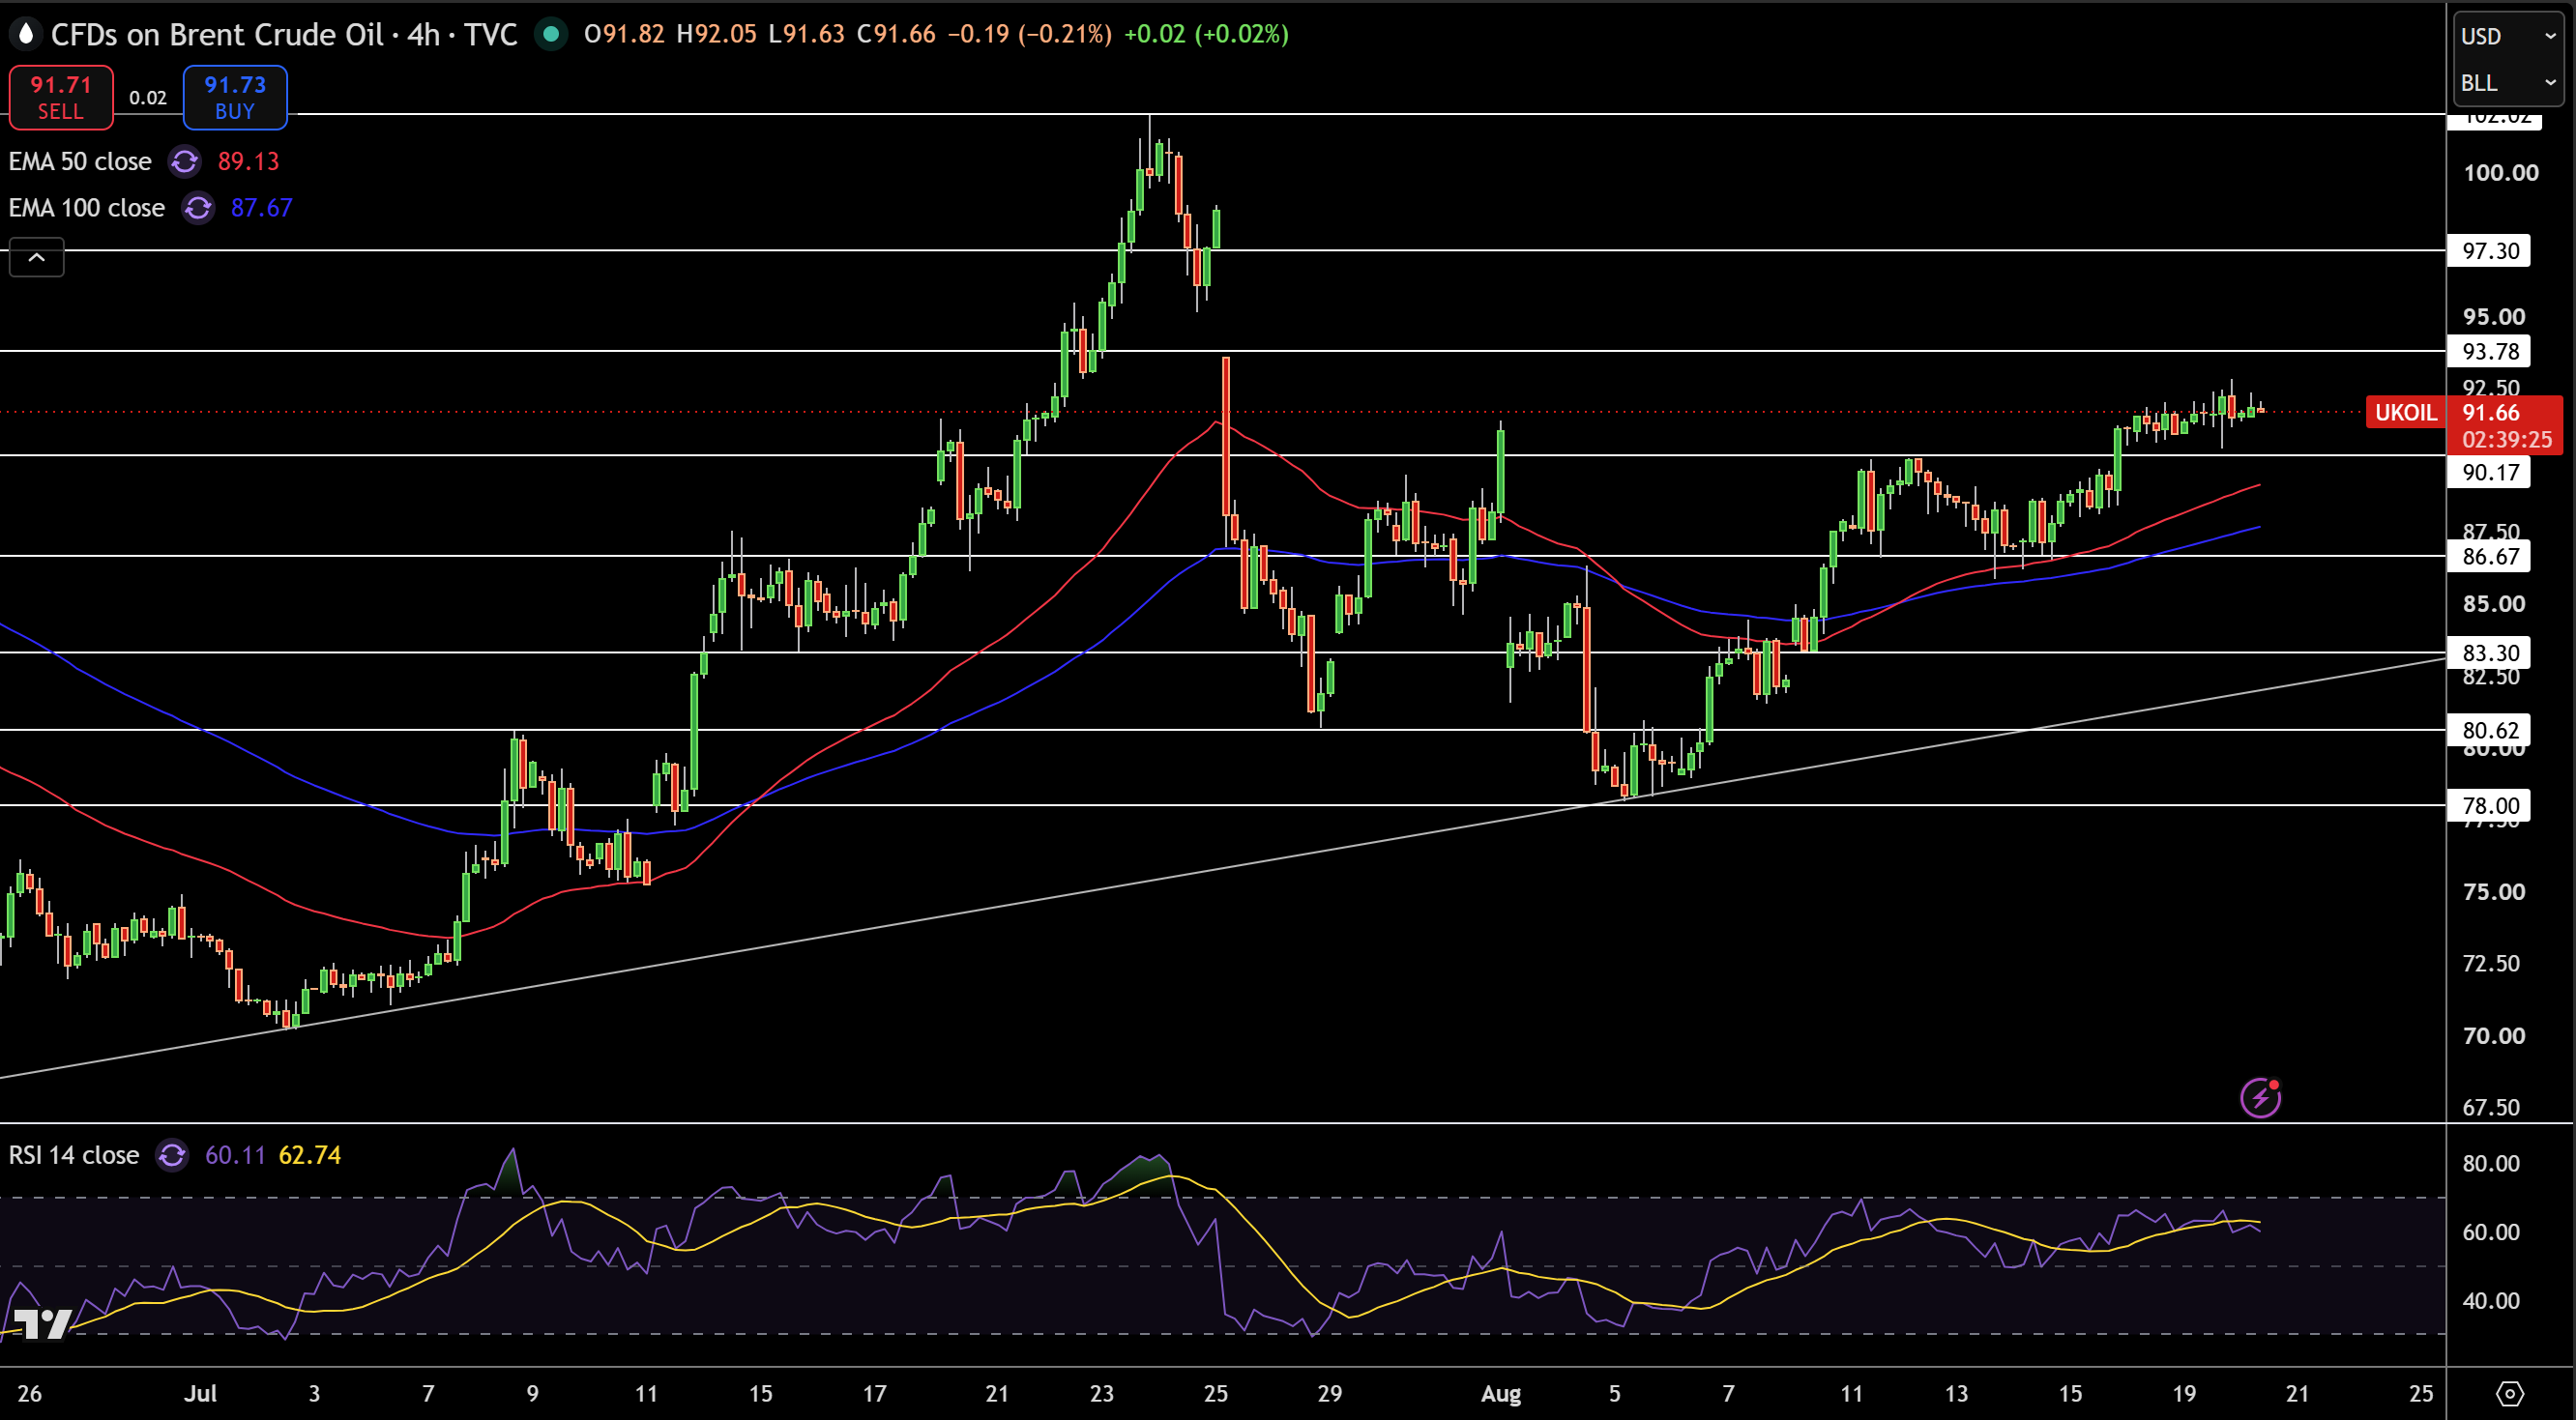
Brent is trading at $91.66 on the 4 hour chart following a recovery from the early August lows. Brent has crossed above the 50 EMA at $89.13 and the 100 EMA at $87.67, showing that the shorter term trend is in favor of the bulls. Price action has been trading in a range between $91.00 – $92.00 showing a period to consolidate after a strong run rather than a clear reversal.
Resistance levels are at $93.78, $96.58, $99.58, and $102.58. Sollution levels are at $90.56, $88.56, $86.56, and $84.56.
RSI is close to 60 and bullish, low in the overbought zone. Immediate resistance is at $93.78, and is followed by $97.30 and $102.02. support is at $90.17, which is followed by the EMA zone at $87.67 to $89.13, and $86.67 provides extra zone support.
Brent is currently bullish and stays above $90.17. A close above $93.78 would continue the bullish move and target $97.30. A break of the EMA at $87.67 would show that the recovery is losing steam and would open $83.30 as the next target.