Gold News: Weak Jobs Report Elevates U.S. Inflation Concerns
Lower U.S. job numbers appearing in the Employment Report released on Friday support the strengthening fundamentals for gold and silver and lower the chances for the Federal Reserve’s next hike in interest rates. In July, 18,000 nonfarm jobs were lost against the Federal Reserve’s forecast of a gain in jobs. The unemployment rate increased from 4.4% to 4.6%. Based on the report, investors believe that the U.S. labor market is not as vigorous as they first perceived. Consequently, the odds for a rate hike by the Fed in September have also decreased. The precious-metals markets are focused on the CPI report for Wednesday and the PPI report on Thursday, and both are expected to show a trend in lower inflation.
Geopolitical tension continues to provide additional support. Unfortunately, shipping in the Strait of Hormuz may not reopen yet after new agreements are made between Iran and Oman. Ongoing instability in the Middle East and higher inflation rates gives the Federal Reserve a dual concern with precious metals and the need for safe-haven investments.
Significant gold demand is expected to continue. According to the World Gold Council’s 2026 survey, 45% of central banks expect to add gold to their official reserves within the year.
Silver presents a unique fundamental picture. The Silver Institute anticipates a sixth consecutive market deficit in 2026 at 67 million ounces even with a total supply increase of 1.5% and mined production of around 820 million ounces. Industrial fabrication is expected to drop around 2% to 650 million ounces as solar manufacturers implement silver thrifting and substitution. AI infrastructure and investment in automotive electronics and power grids remain critical structural drivers of demand.
Gold Technical Analysis: XAU/USD Eyes Resistance at $4,368 After Major Breakout
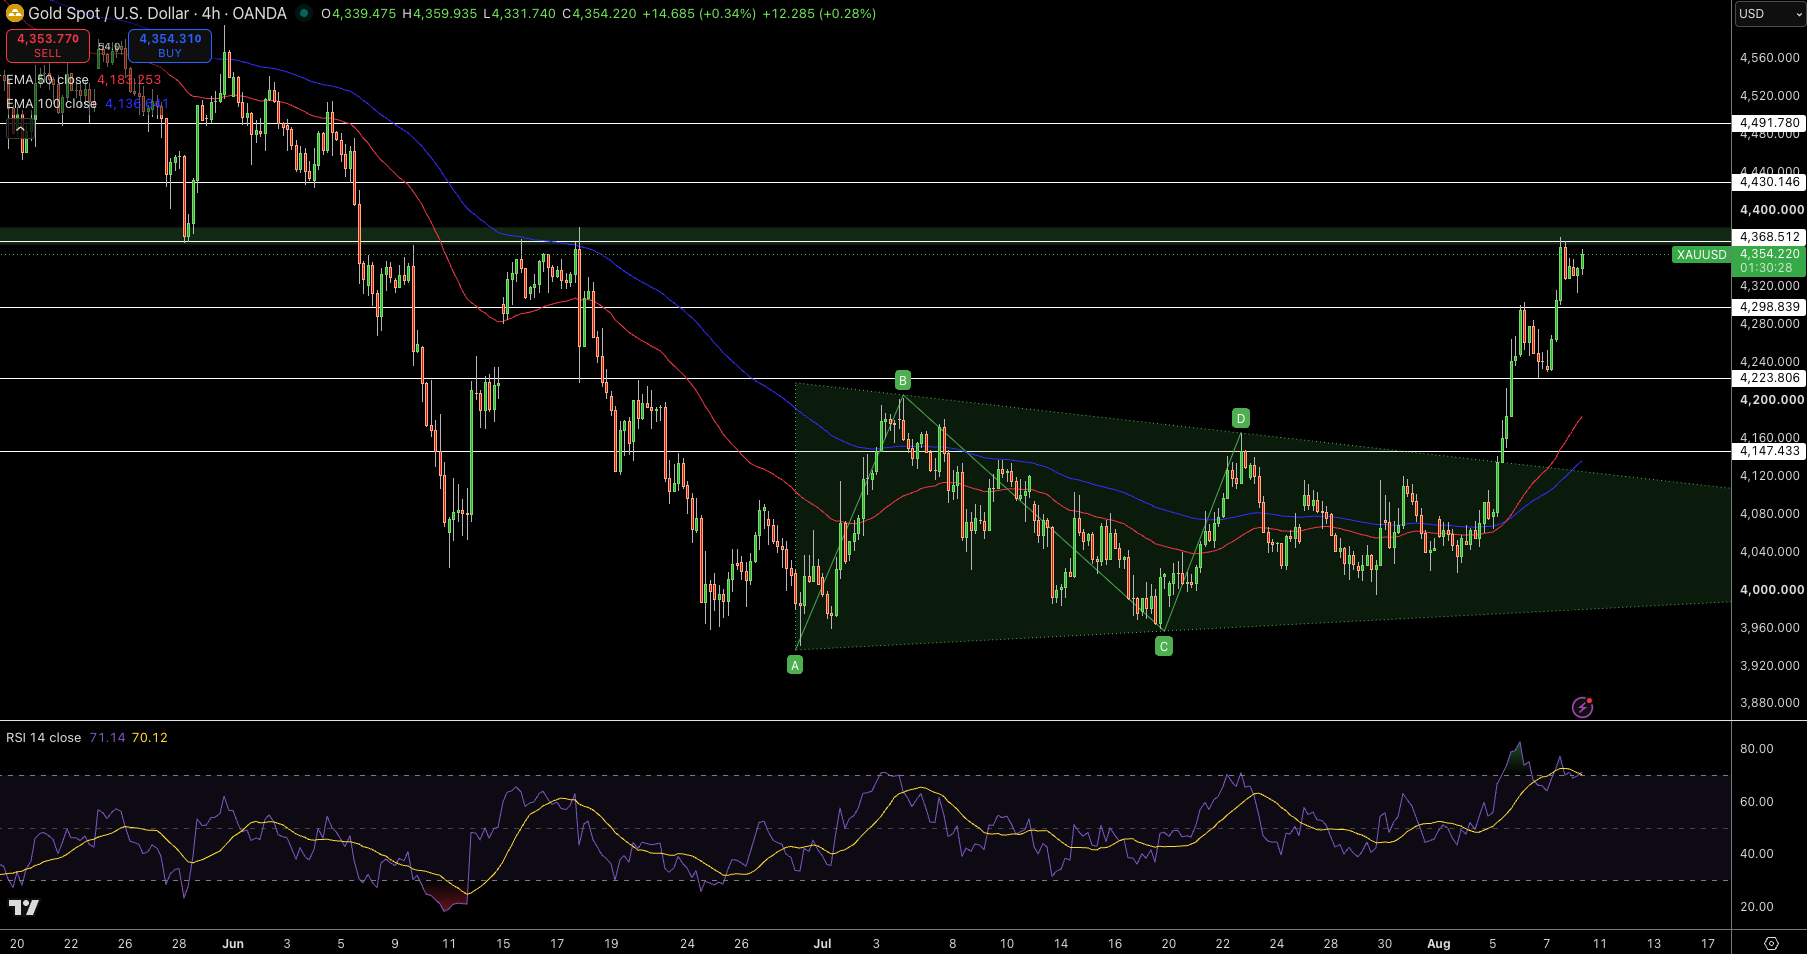
Gold is valued at around $4,354, breaking out of its consolidation pattern after trading above both the 50-day ($4,183) and 100-day ($4,136) EMAs. There is currently bullish price action with larger candles. However, the bullish momentum has produced smaller candles against the $4,368 resistance level. The broken descending trendline has shifted the former resistance level of $4,299 to support.
Currently, price is meeting resistance at $4,368, while future resistance will be at $4,430 and $4,492. Conversely, price will find support at $4,299, $4,223, and $4,147. With an RSI of around 71, gold is in the overbought zone, making it more likely to consolidate or pull back.
The overall structure for gold is bullish while XAU/USD is above $4,299. A breakout above $4,368 will target $4,430. If price is rejected at $4,368, there will be an attempt to retest the breakout zone prior to gold trading in either direction.
Gold Price Forecast
Every new Gold analysis as it publishes, today's technical signal and key levels, live price — on one page.
See all Gold forecastsSilver Encapsulated In Rising Channel While Resistance Lies At $65.21
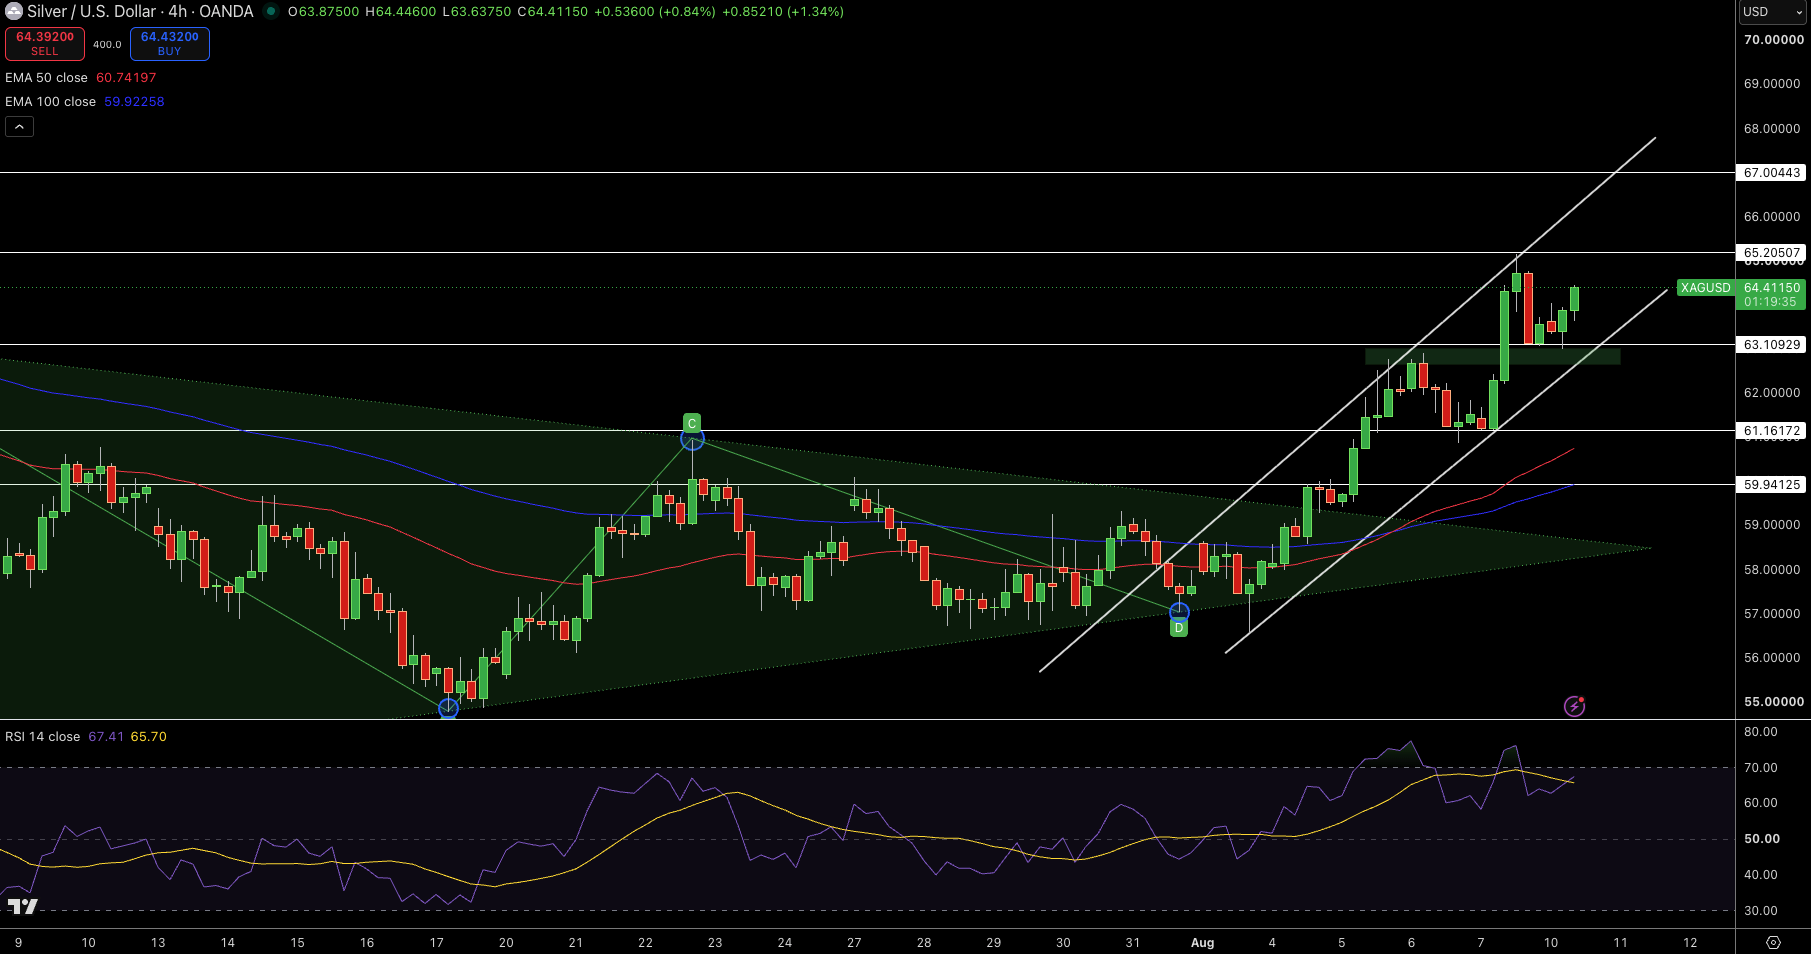
XAG is valuating at $64.41 and is comfortably moving along the trading channel after breaking the previous consolidation structure. Current pricing is at levels above the 50 and 100 session exponential moving averages located at $60.74 and $59.92 respectively. This is a confirmation of a short-term bullish move. The last few candles closed with price consolidating with a high likelihood of a continuation pattern, which is supported by the breakout zone around $63.10. The RSI suggests that bullish momentum is strong and price is slightly above the ‘overbought’ levels. This will slow the bullish price action.
The first level of resistance is at $65.21 with a greater level at $67.00. Conversely, $63.10, $61.16, and $59.94 will provide support to price action. Given the overall bullish posture, I anticipate Silver will remain above the support level of $63.10 and continue the bullish move. Closing above $65.21 will accelerate the upward move to $67.00 while price closing below the support of the channel will invalidate the current bullish posture.