


Gold & Silver Outlook: Weaker Dollar Supports Metals as U.S. Inflation Test and Iran Conflict Loom
Gold and silver head into a more bullish Thursday and a weakening dollar, with investors backing up expectations for inflation data that may determine whether the Federal Reserve moves forward with its interest rate hike for September. The dollar has been losing ground despite higher U.S. yields. This makes the conditions even better for dollar-denominated metals.
The first up is the U.S. Producer Price Index slated for Thursday at 12:30 GMT, with the consumer inflation coming in on Friday. Futures markets are giving a about 60 percent likelihood for a Fed funds rate hike for September 15-16 after more positive August jobs data. However, most economists are more cautious. In a survey conducted by Reuters, more of the responders indicated the Fed would keep its position. Rising inflation would strengthen the case for tightening and increase the opportunity cost of holding metals.
Bond markets are already alluding to this possibility. Benchmark U.S. Treasury yields have moved to their highest levels for 2023. This is due to escalating energy costs which is helping to fan inflation concerns. This also provides a good counterbalance to the dollar weakening and the support for gold.
Geopolitics is helping to maintain demand as well. Iran said that it attacked 10 ships in the Strait of Hormuz, following the U.S. sinking five Iranian oil tankers, which has been the largest attack on shipping during the 6-month conflict. This is helping to create a supply disruption of Middle Eastern oil which is helping to create a safe-haven demand while increasing the concerns of inflation.
Gold also has demand from the U.S. fiscal sustainability concerns after the federal debt eclipsed forty trillion dollars for the first time last month. ANZ said that fiscal pressures are creating doubt in the U.S. government’s ability to service their debts and maintain their currency.
For silver, the backdrop is a strong monetary environment coupled with a tight physical market. The Silver Institute forecasts a sixth consecutive annual deficit in 2026. Stocks have drawn down by 762 million ounces since 2021. Despite an anticipated increase in investment demand for silver in the bar and coin form of 18%, a slowdown in industrial demand will likely slow the growth.
Fundamental bias: We are moderately bullish on gold and silver, and near term U.S. PPI and CPI will be most important.
Gold Technical Analysis: XAU/USD Stalls Below $4,422 as Descending Trendline Keeps Bulls in Check
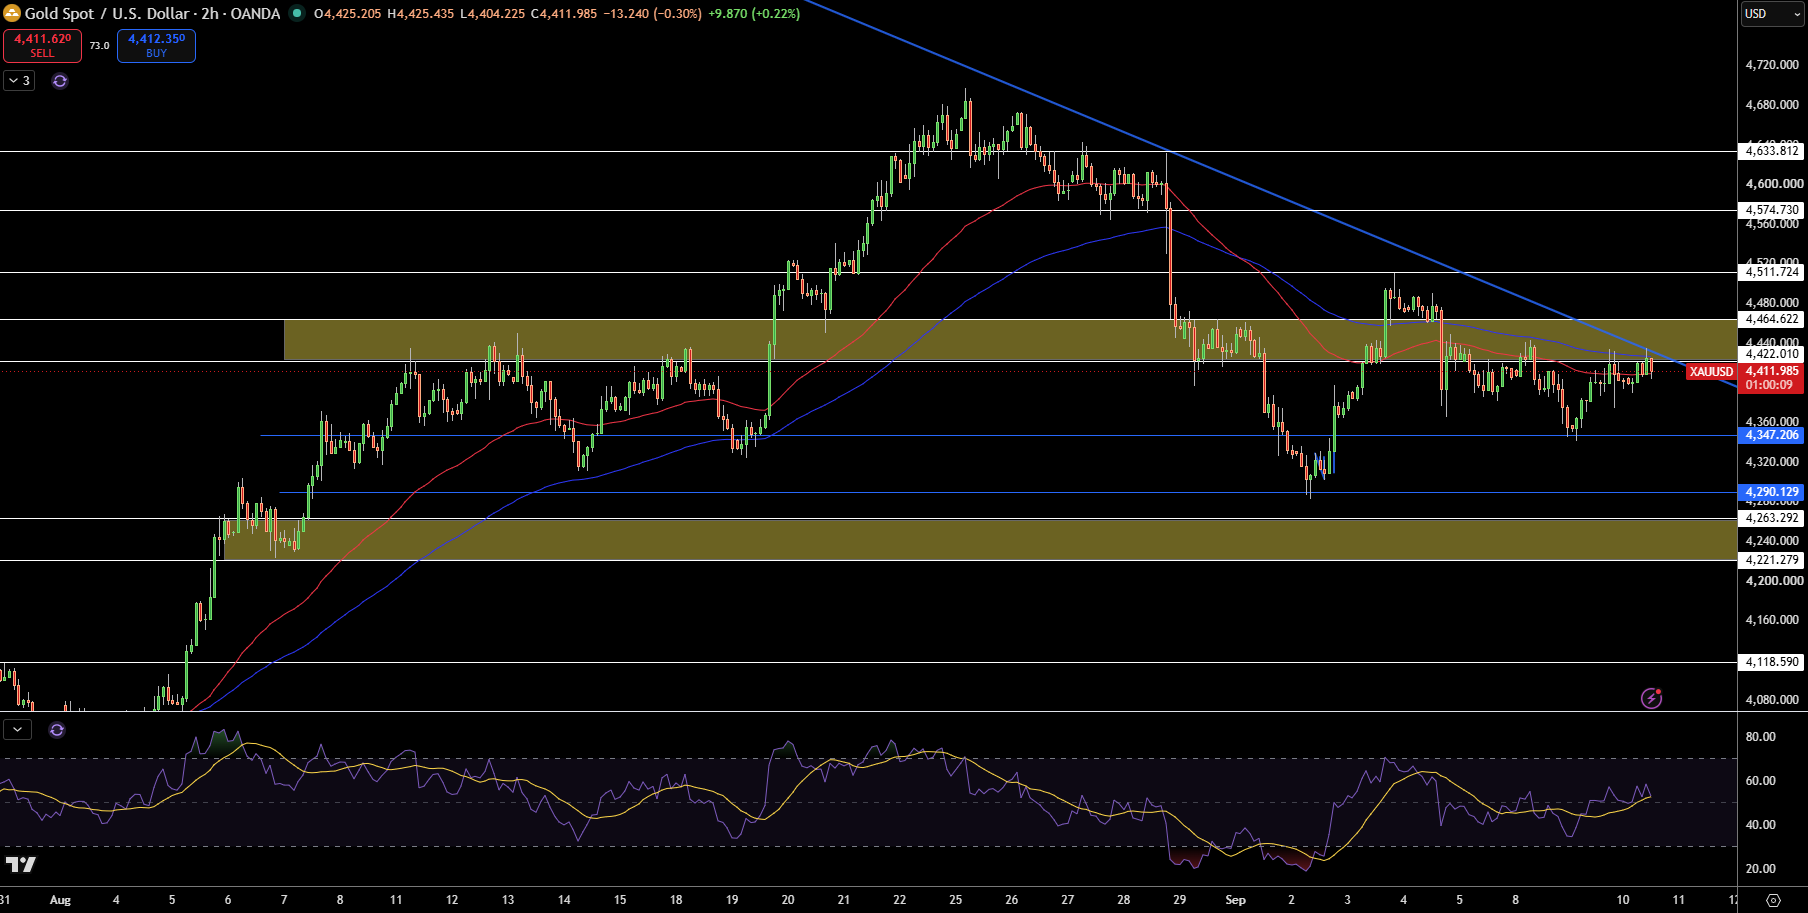
Gold trades at $4,413 in the 2 hour timeframe and what stands out is how buyers continuosly defend the horizontal level $4,347. However, resistance at the descending trendline and the upper band of the resistance zone $4,422 – $4,465, continues to cap the gains and keeps the recovery constructive but not sufficient to signal a bullish reversal just yet.
The first level of interest to the upside is the level at $4,422. A break above will open up $4,465 and $4,512 to the bulls. On the other hand, $4,347 and $4,290 will provide horizontal support to the downside. A break below the horizontal zone will bring the demand zone of $4.263 – $4.221 into play.
The RSI is recovering at the upper half of its range, implying a bullish bias but not yet signalling an overbought condition. Gold below $4,422 – $4,465 remains neutral with a bearish bias. A bullish case will be stronger on a consolidated break above $4,465 while the opposite is true on a break below $4,347.
Gold Price Forecast
Every new Gold analysis as it publishes, today's technical signal and key levels, live price — on one page.
See all Gold forecastsSilver Technical Analysis: XAG/USD Breaks Descending Trendline as $67.21 Turns Into Key Support
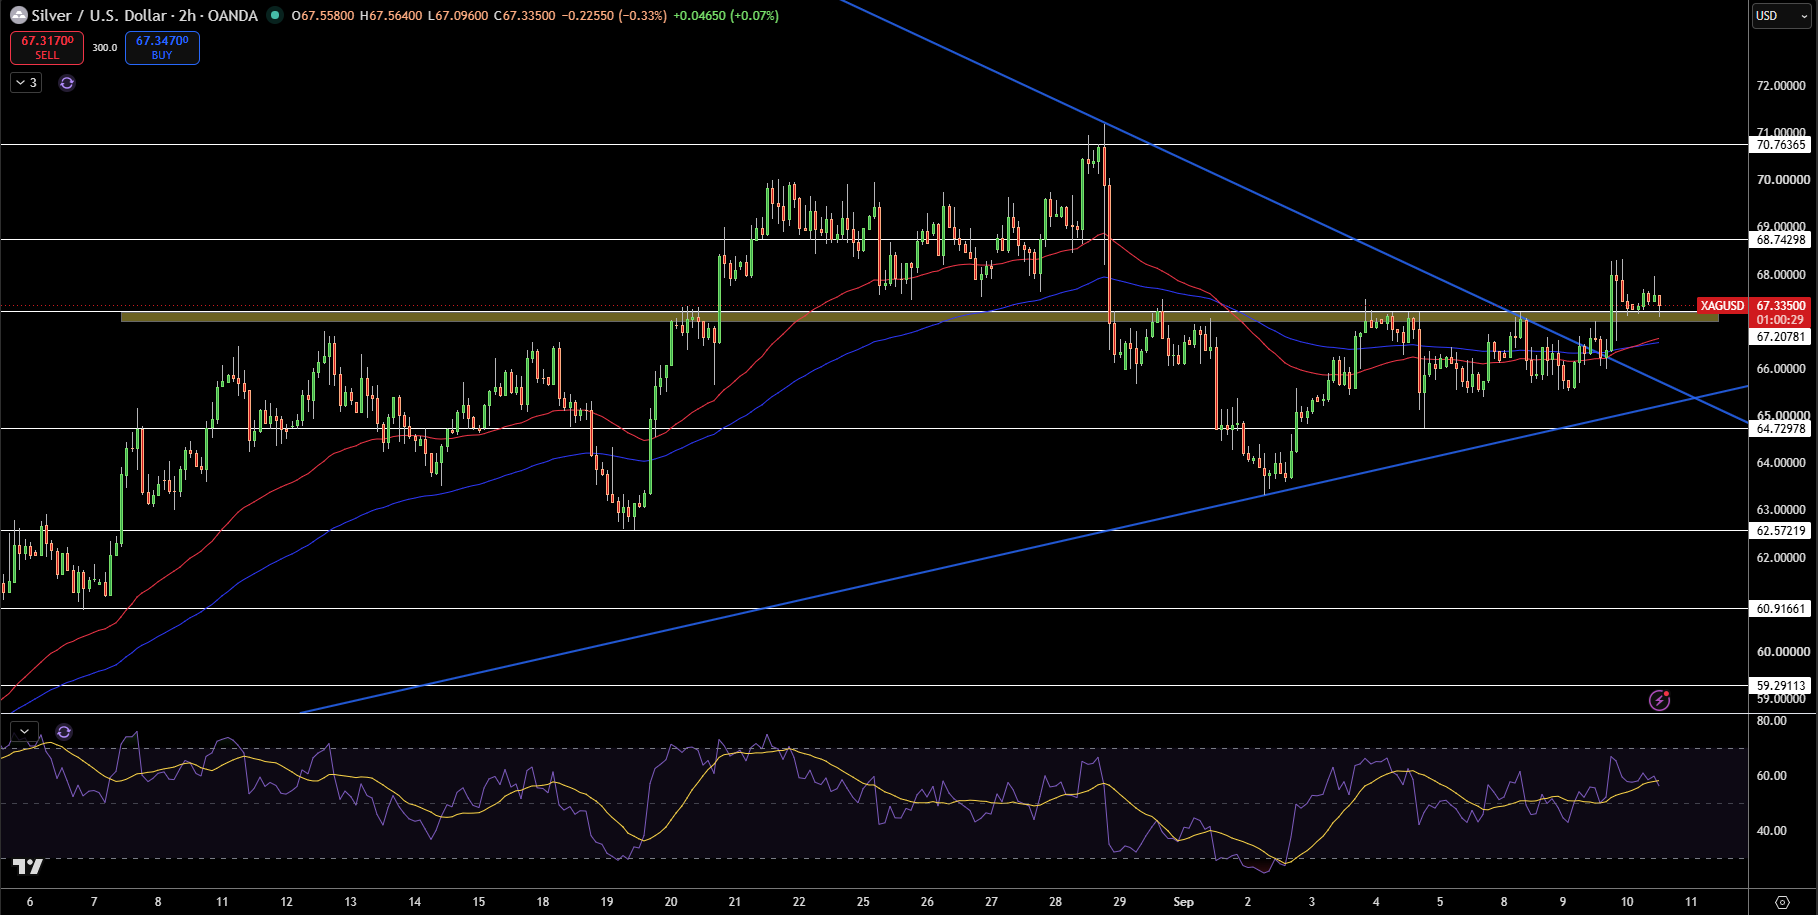
Silver currently trades at $67.34 in the 2 hour timeframe. First, I notice the break of the descending trendline and the resistance at $67.21. Additionally, silver is now trading above both moving averages. So this break has much more force to it than the prior break attempts.
First of all, the support I am tracking is now at $67.21. If the buyers are able to keep that former resistance, the following potential targets are at $68.74 and $70.76. If the price falls again below $67.21, then the breakout would be weaker and would expose the levels at $64.73 and $62.57 in case the selling pressure builds up.
RSI is currently above the midline and is rising which shows that the momentum is good and it is not overextended, and I am still bullish until the price of silver is below $67.21, in which case I would reassess and examine whether the breakout happened. If the price is above $67.21, I would favor a continuation to the level at $68.74.