



Dollar Index Outlook: Dollar Struggles as ECB Hike Looms and Oil Shock Lifts Global Inflation Risk
The U.S. dollar remains flat amid higher treasury yields driven by soaring energy costs. With Brent crude topping $100, worries of inflation across the globe are coming back, with the U.S. 10-year yield climbing to a 2023 high. That said, the dollar has remained unchanged, demonstrating lack of interest from investors to add long positions before the release of the upcoming US inflation data and next week’s FOMC meeting.
The U.S. data on tap to influence markets is the Producer Price Index (PPI) today and Consumer Price Index (CPI) on Friday. The market currently puts odds at around 60% that the Fed may hike at its next meeting on Wednesday, following strong labor market data and increased energy shock. The energy crisis may also bring inflation concerns to investors, while the data may be weaker and may even lead market analysts to turn less hawkish.
The euro zone also remains front and center. The ECB is going to hike rates by 25 bps today and mail the deposit rate at 2.50%. The consensus in the market is that the ECB will not hike again this year. Euro zone inflation was at 3.3% in August, and pressure on energy prices is building, with Deutsche Bank calling for a December rate hike.
Sterling remains subdued. The Bank of England is more cautious than its peers. There is a high consensus in the market that the BoE will hold rates on September 17. 57 of the economists polled in the REUTERS survey expect the BoE to hold for the remainder of the year. Energy concerns are high, and wage and price inflation are still muted.
As indicated in the chart, tightening by the ECB contrasts with the Fed’s data dependency and the BoE’s wait-and-see approach.
Fundamental bias: DXY neutral-to-bearish, EUR moderately bullish, GBP neutral.
U.S. Dollar Index Technical Analysis: DXY Stays Below 98.90 as Sellers Keep Control
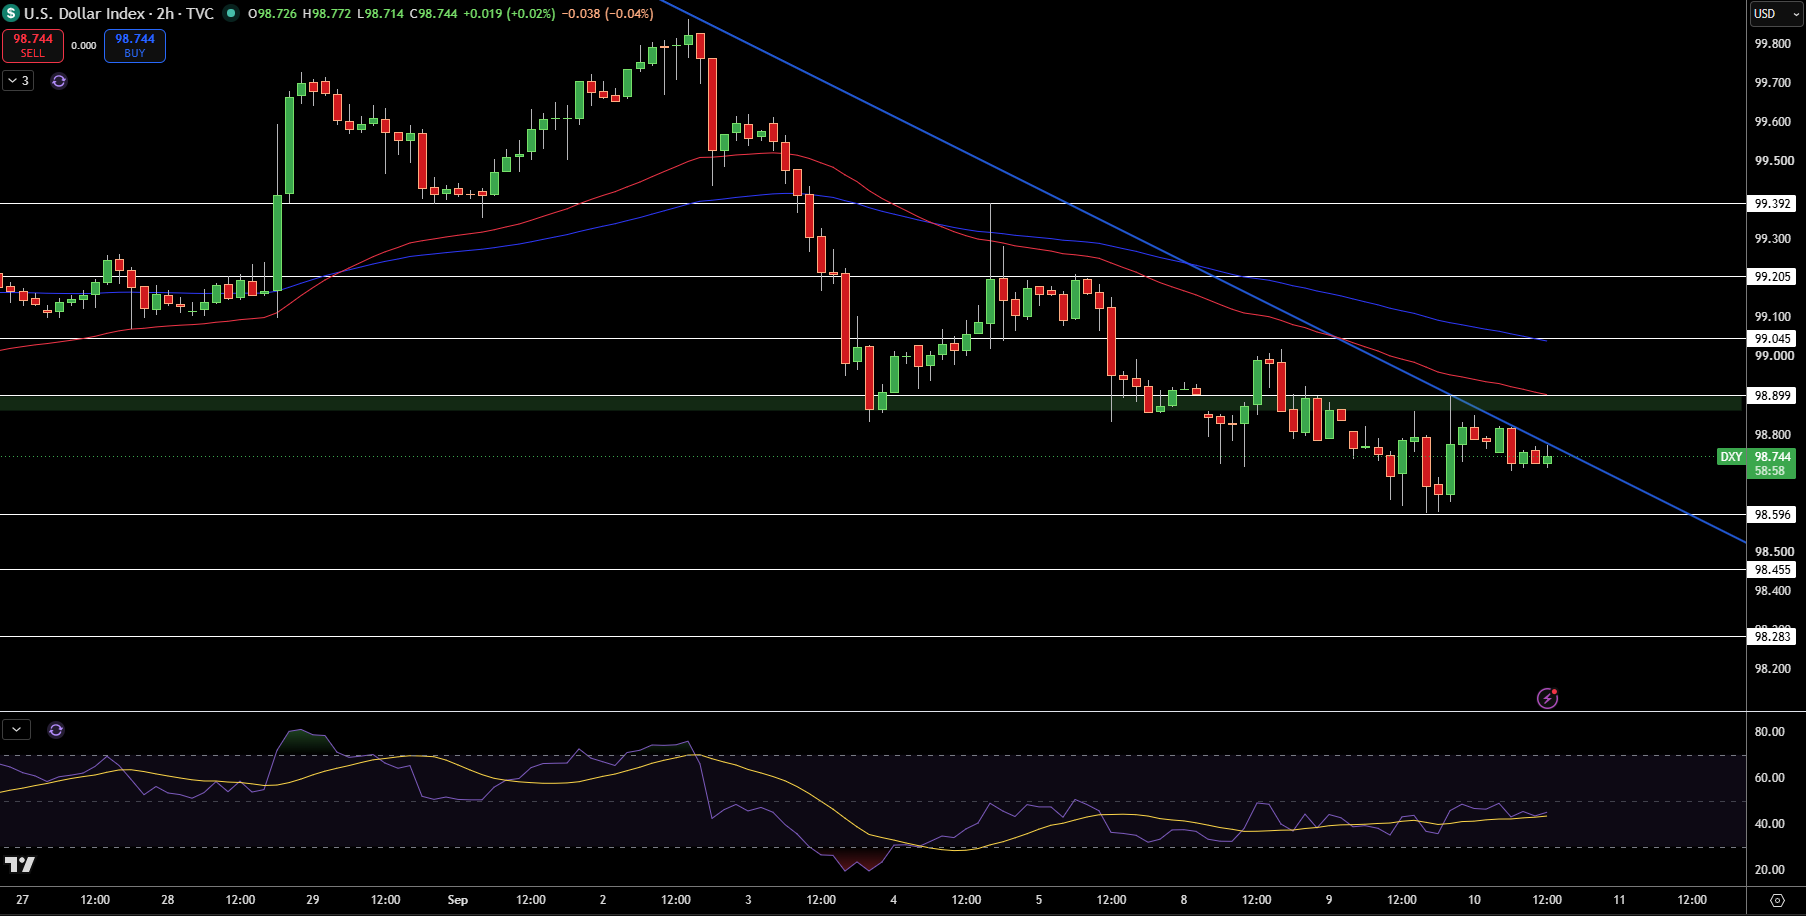
On the 2-hour chart, USDX resides around 98.74, and what captures my interest is that price respects the descending trendline and remains below both moving averages. Price failed to close above 98.90 more than once, implying that there are sellers defending rebounds from forming a meaningful trend reversal.
First, I watch 98.60. A break of the support zone would take price down to 98.46 and 98.28. 98.90 becomes the first zone of resistance, and price would be considered bullish if it were to break that zone. 99.05 and 99.21 become important zones of resistance should the bulls control price action.
RSI remains in territory implying price action remains weak. I am therefore leaning bearish until 98.90 is successfully challenged and USDX is above 99.05. Closing above 99.21 would then negate this bearish thesis. Until then I favor price action moving down to 98.60.
EUR/USD Price Forecast
Every new EUR/USD analysis as it publishes, today's technical signal and key levels, live price — on one page.
See all EUR/USD forecastsGBP/USD Technical Analysis: Sterling Holds Above 1.3526 as Rising Trendline Supports Recovery
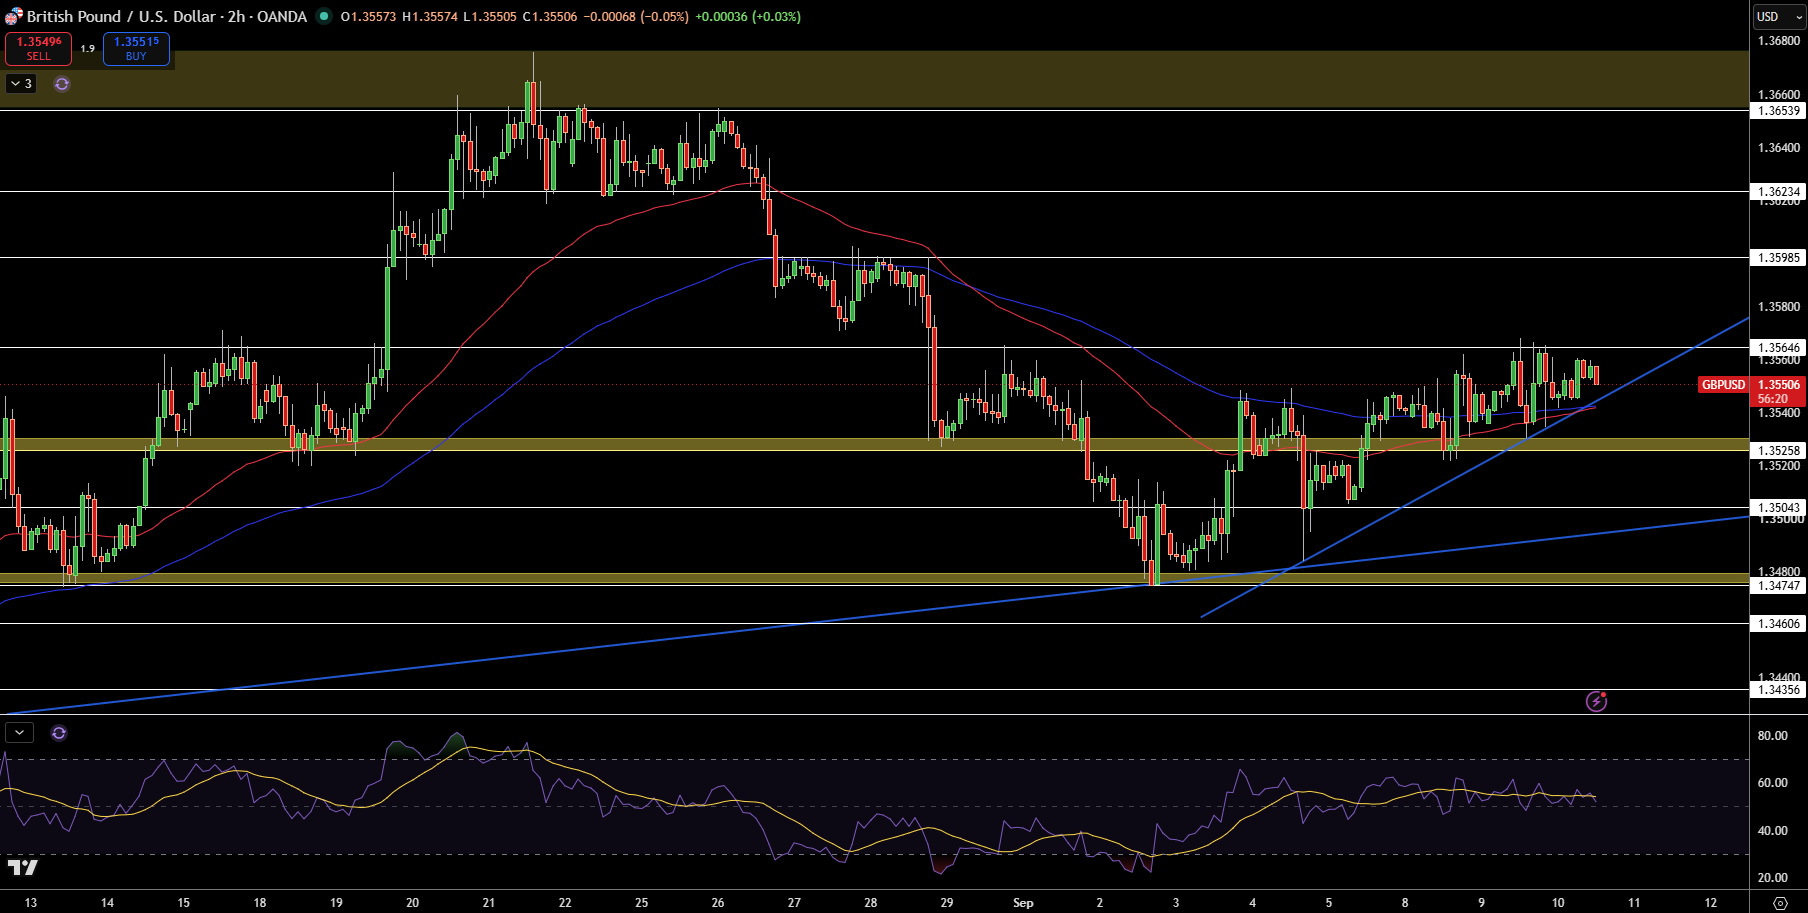
GBP/USD is currently trading at 1.3551 on the 2 hour frame. What I have noted is that pound buyers are defending the rising trendline and keeping the price above the 1.3526 support area. The pair is also trading sideways around the moving averages which indicates that the recovery is holding and has some base, however, there is not much recovery momentum.
The first resistance is around 1.3565. A break above that would open 1.3599 and further areas at 1.3623 and the resistance area at 1.3654. For now, the 1.3526 area is the main support. Below that there are supports at 1.3504 and 1.3475 for now, but these would be more important if the pound buyers were to lose control.
I am still slightly bullish as it is trading around the 1.3526 support area and the rising trendline. A break below 1.3475 would require me to distract from the long bias, whereas a break above 1.3565 would justify a stronger bullish view.
EUR/USD Technical Analysis: Euro Holds Rising Trendline as 1.1642 Breakout Comes Into Focus
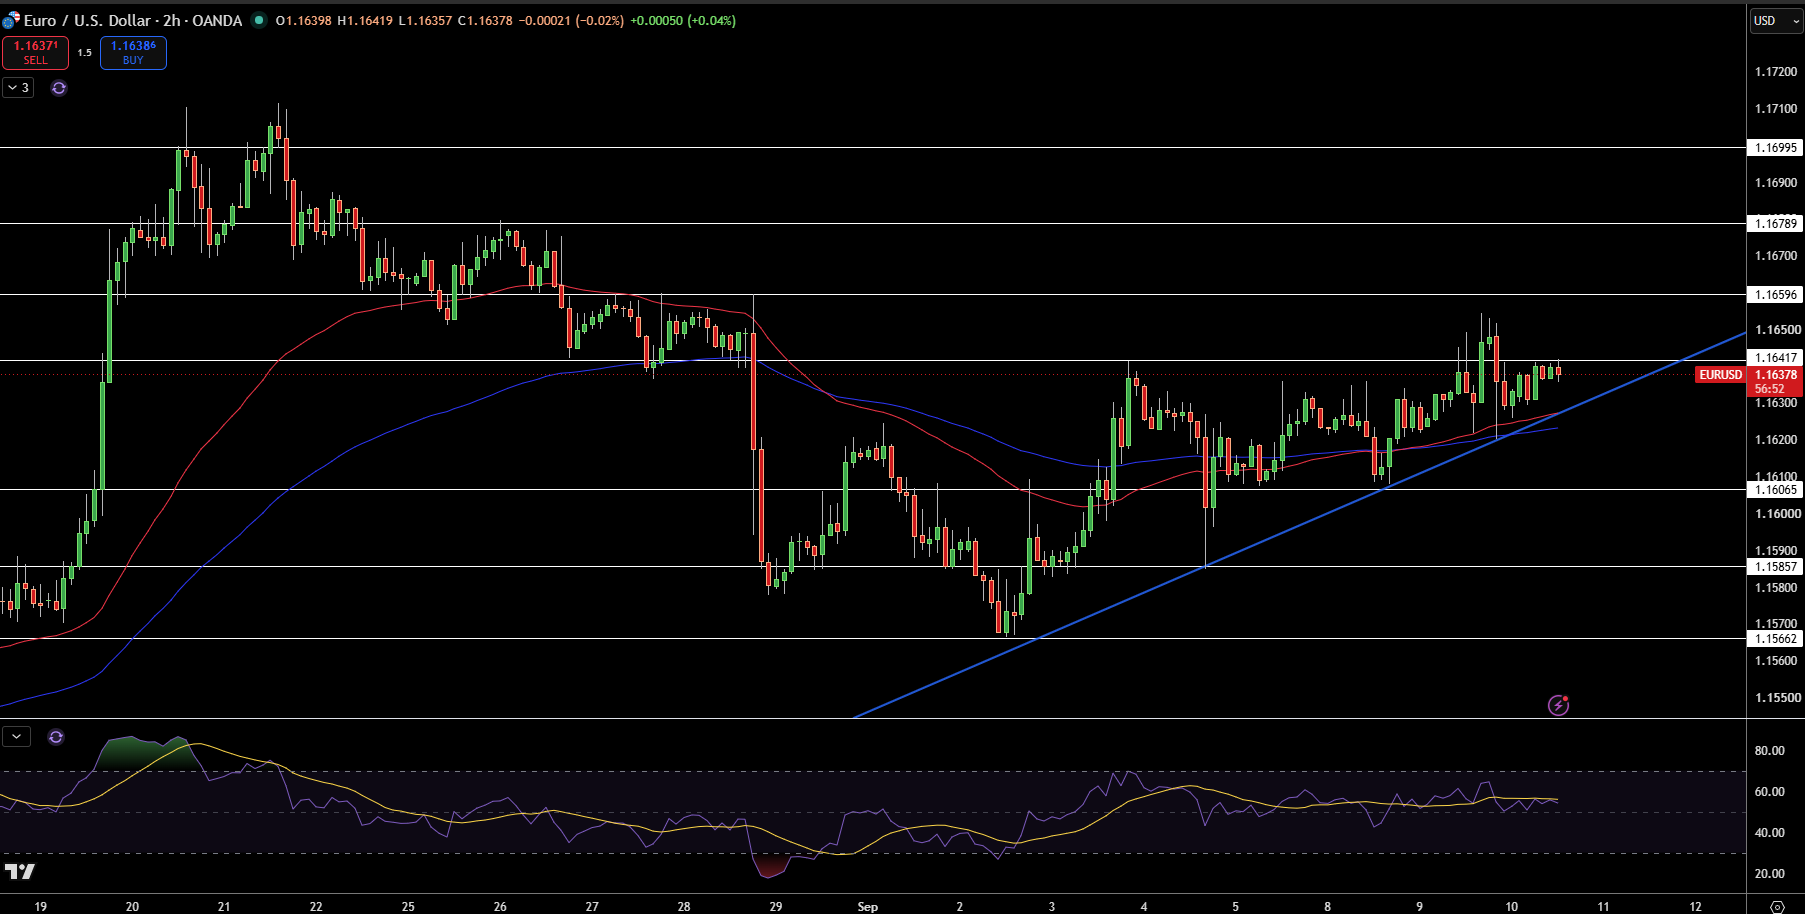
EUR/USD is trading at 1.1638 on the two-hour chart. Price is building higher lows within the rising trendline and is trading above both moving averages. The structure is there, but buyers trading within this pattern need to clear 1.1642 in order to continue the upward trend.
I’m watching the first resistance level on the chart at 1.1642. A break above this level would show the next resistance levels at 1.1660, 1.1679, and 1.1700. Potential support levels in the event a rising trendline is broken and the price begins to drop are 1.1607, 1.1586, and 1.1566 in that order.
The RSI is trending in the upper half of its range meaning there is a bullish bias. I am bullish and will maintain this position as long as EUR/USD is above 1.1607. A sustained 2 hour candle break above 1.1642 would support the next level of potential resistance at 1.1660 and 1.1679. A break below 1.1586 would discount the resistance levels above.