Gold Trapped Below $4,467 After Warsh Warning
Gold cannot get out of its own way on a Sunday night. Spot Gold (XAUUSD) whipped through a $30 range in the first twenty minutes of the week. The open at $4,445.72 ran to $4,466.95 in the first few minutes. The rally did not hold. Sellers knocked it back to $4,435.82 before the market found its footing near $4,460.
Warsh’s Jackson Hole speech is still sitting on this market. He put the 2% inflation target back in the conversation Friday and yields have not come in since. Meanwhile a U.S. strike on Larak Island near the Strait of Hormuz over the weekend pushed crude higher at the open. The same inflation pressure Warsh flagged on Friday just showed up in the oil market before the week even started.
Gold is still on the weak side of its 200-day moving average. The weight is coming from above.
The Treasury’s refinancing burden at $40 trillion is sitting underneath this market. It is not the Monday morning story. It is the reason gold finds a floor after rate-driven breaks instead of falling apart.
At 01:16 GMT, Spot Gold (XAUUSD) is trading $4443.93, down $11.05 or -0.25%.

Daily Spot Gold (XAUUSD) Technical Analysis
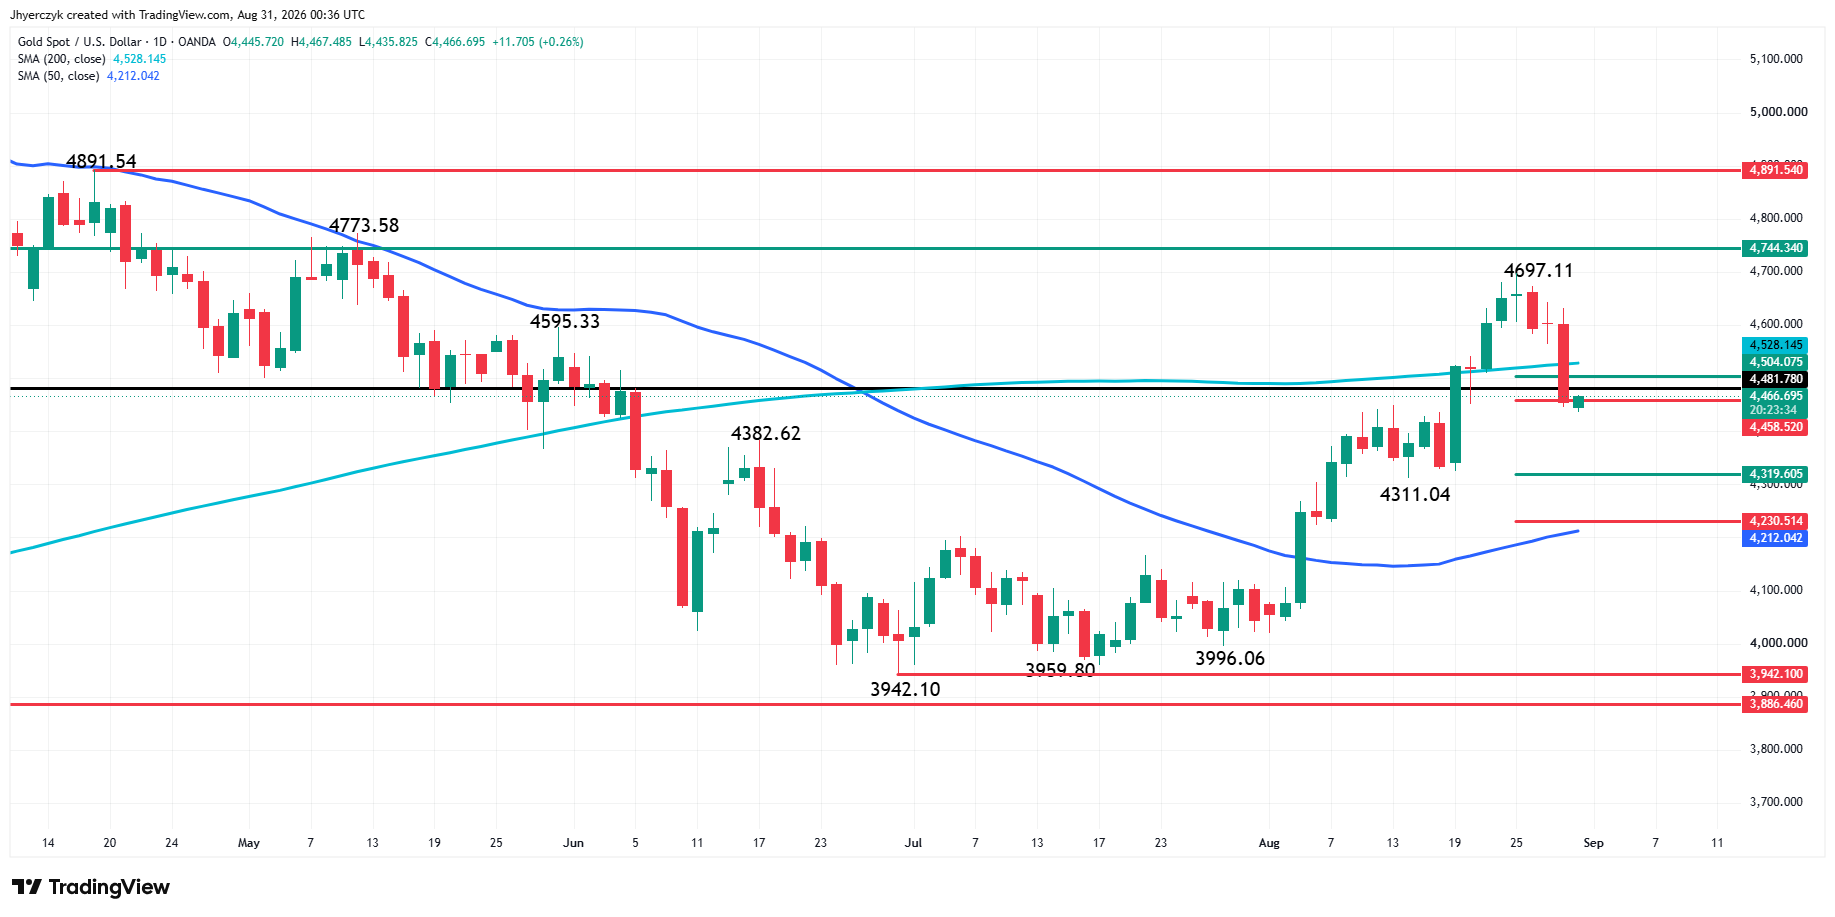
Spot gold is edging slightly higher early Monday following Friday’s sharp sell-off. Currently, the market is trading in bear market territory, on the weak side of $4481.78. This line represents 20% down from the all-time high at $5602.23. Spot gold is also trading on the weak side of the 200-day moving average at $4528.17, which is the indicator controlling the long-term trend.
Swing chart analysis shows gold is in an uptrend. A trade through $4697.11 will reaffirm the uptrend. The main trend changes to down on a trade through the swing bottom at $4311.04.
The short-term range is $4311.04 to $4697.11. Its 50% to 61.8% retracement zone is $4504.08 to $4458.52. The early trade has the market straddling the latter, or 61.8% level.
The intermediate term range is $3942.10 to $4697.11. If the selling extends beyond $4458.52 then we could see an acceleration into the retracement zone at $4319.60 to $4230.51. This is followed by the 50-day moving average at $4212.05.
Gold Price Forecast
Every new Gold analysis as it publishes, today's technical signal and key levels, live price — on one page.
See all Gold forecastsWarsh Put a Floor Under Yields
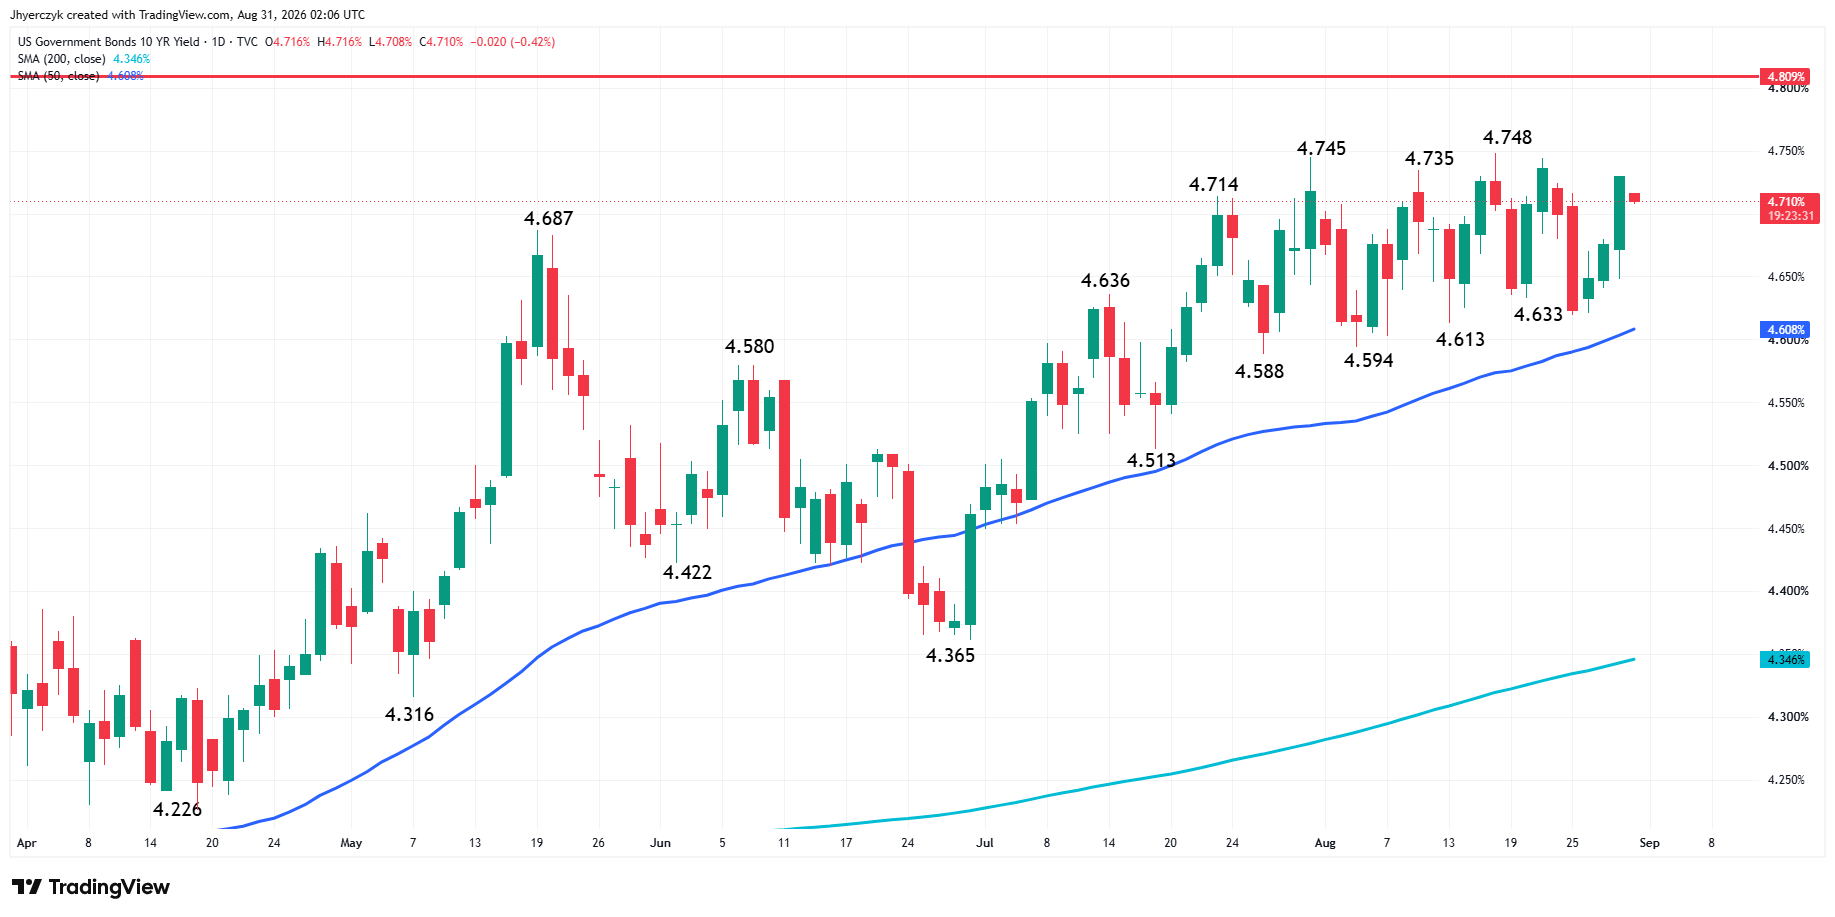
The 10-year near 4.72% is doing the damage. Long-end rates are above 5.2%. Warsh went to Jackson Hole and did not leave any room. The 2% target stands. The Fed still has work to do. Financial conditions do not look restrictive. Warsh said that Friday at Jackson Hole and the market took it as permission to reprice September.
The reaction was fast. Rate-hike expectations for September jumped. Short-term yields moved. The dollar bid that followed hit gold straight through the session close Friday and the selling has not really stopped. Sunday night picked up where the New York close left off.
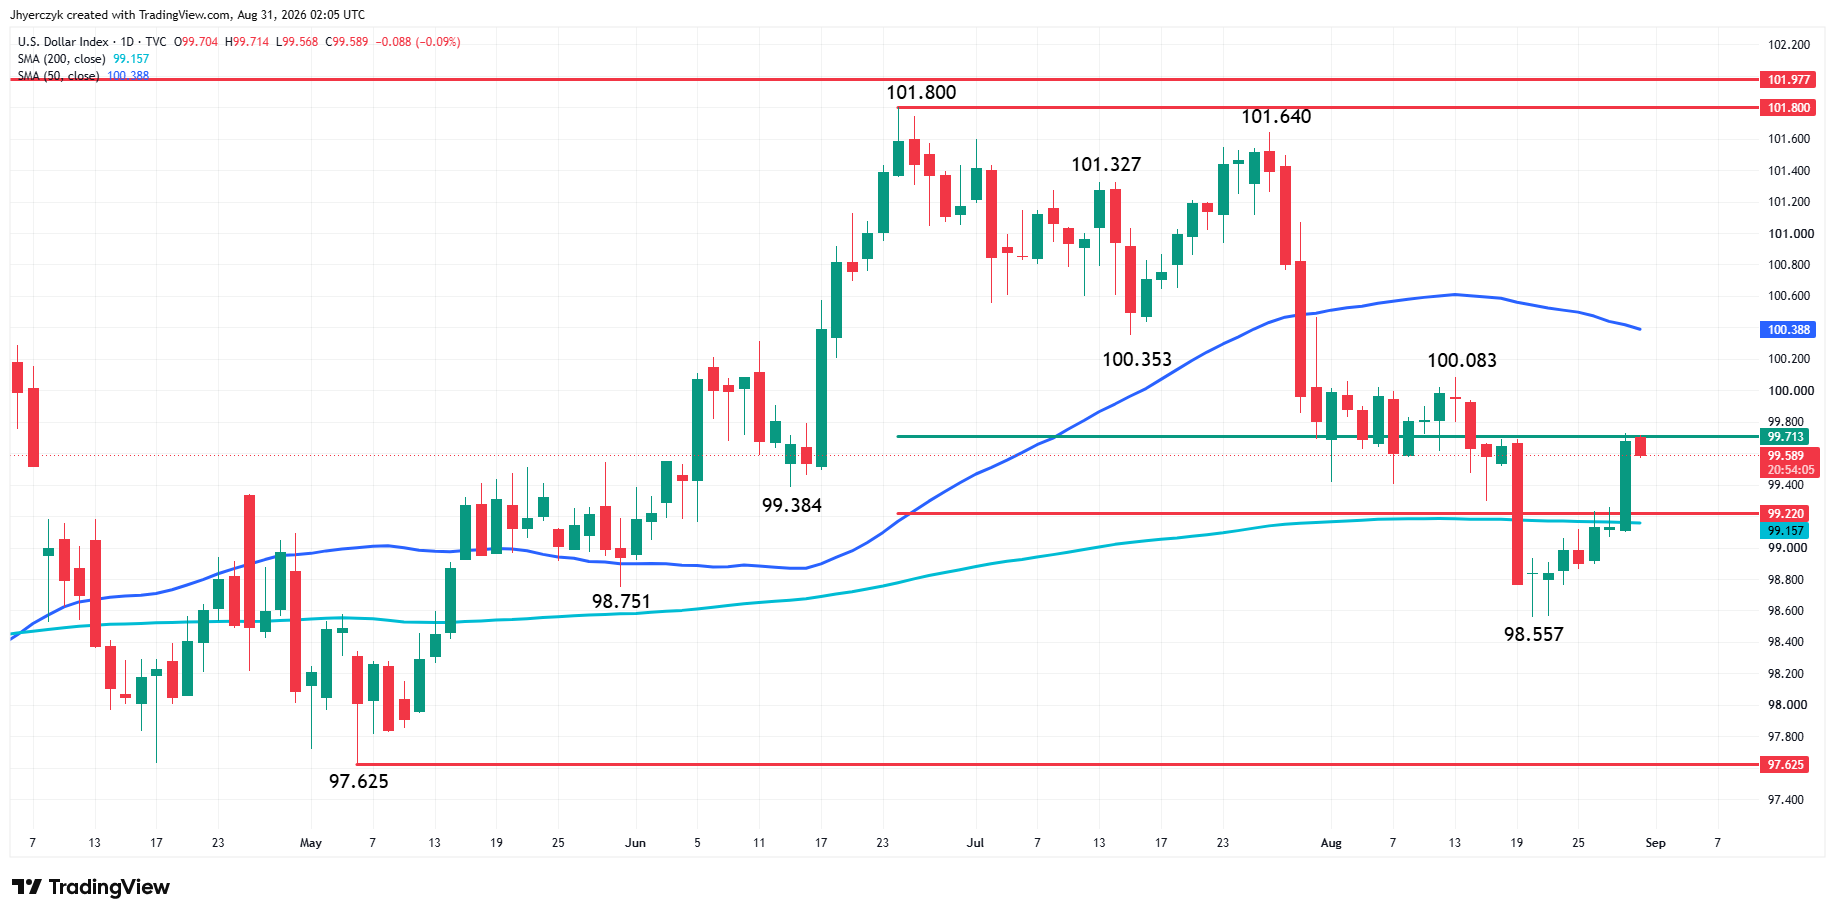
The dollar firmed after the speech. It has not given it back. Gold broke below $4,440 early in the session. The recovery stalled in the low $4,460s. Selling interest keeps catching up.
Larak Strike Feeds the Hawkish Case
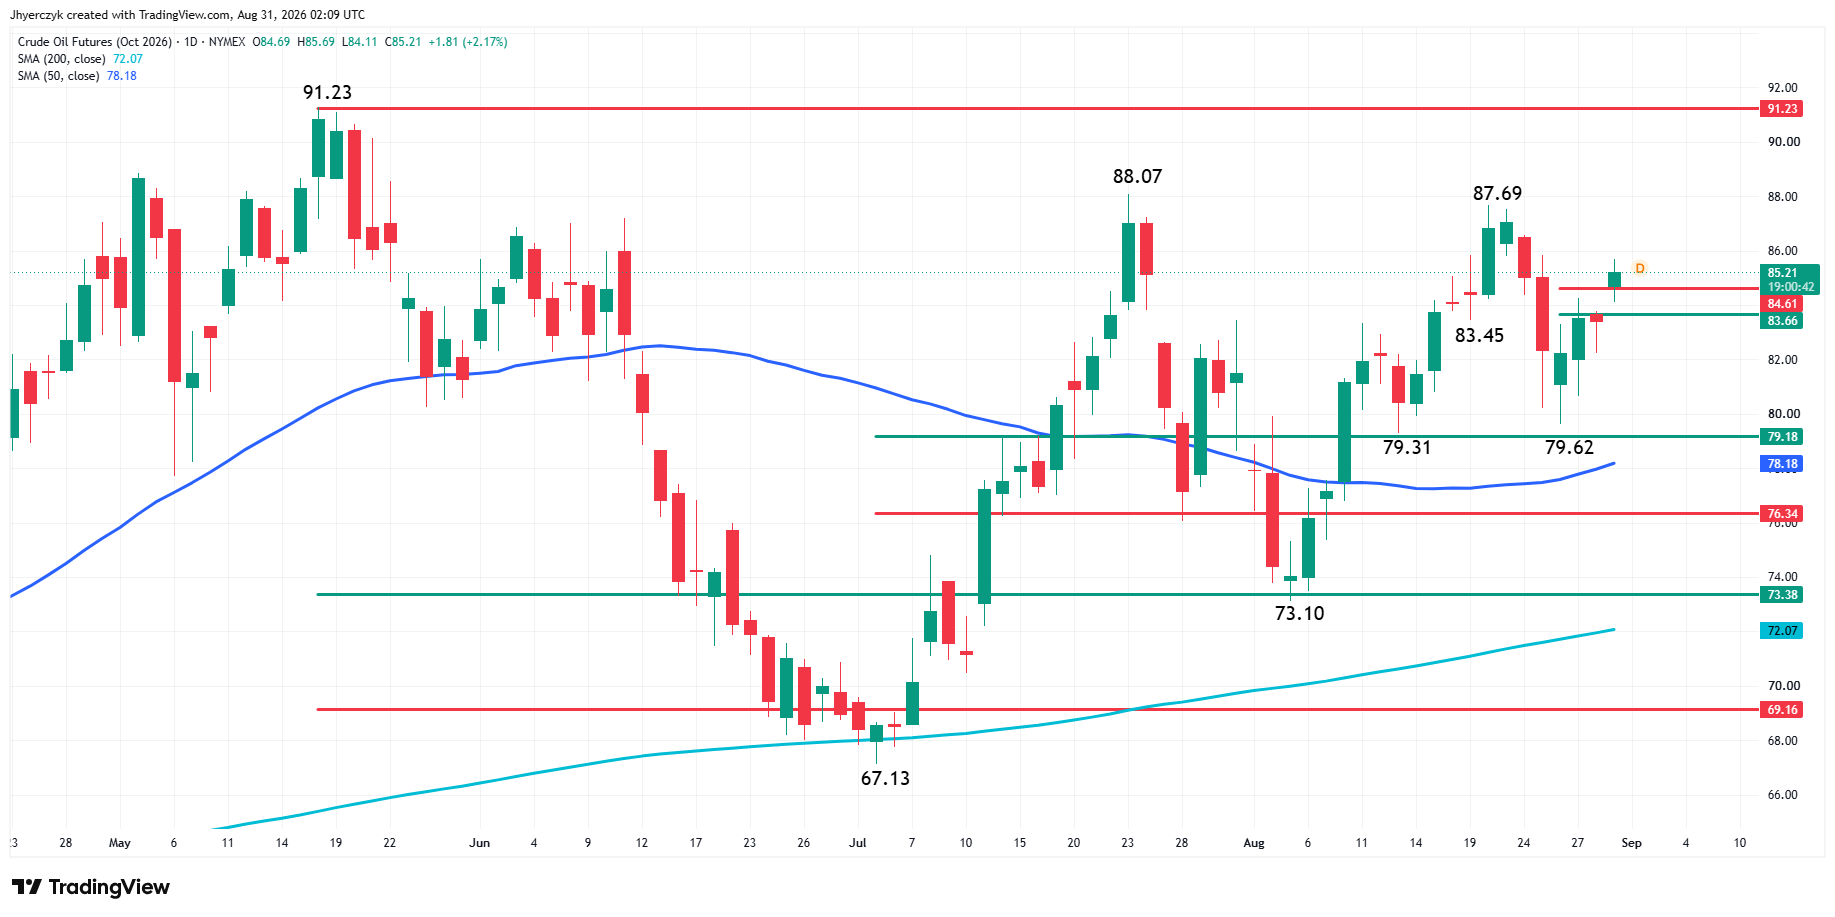
Crude pushed higher at the Monday open after reports of a U.S. strike on Iranian launchers on Larak Island over the weekend. Larak sits in the Strait of Hormuz. Rising oil after a hawkish Jackson Hole speech is the worst combination for gold longs. Warsh said Friday that prices are still too high. Crude is now confirming that for him.
Some traders are stepping in on dips anyway. The geopolitical risk is keeping them interested. Trade tension with Canada is adding to the background noise. Neither one is the lead story Monday.
The conflict is six months old. The Strait is still not flowing normally. Sanctions have not been lifted. No diplomatic breakthrough has produced reliable shipping through the region. Dip buyers keep pointing to that when they step in below $4,440.
What to Watch
Crude opened higher on the Larak Island strike and Warsh’s Jackson Hole speech is still sitting on yields. That is oil and rates moving against gold at the same time. The 10-year has not come off 4.72%. The dollar has not faded. Gold broke below $4,440 in the overnight session and could not get past the low $4,460s on the bounce.
Monday’s regular session is the first real test. The overnight range was set on thin volume. New York and London have not weighed in yet. The $40 trillion refinancing burden underneath this market is the reason gold keeps finding buyers after rate-driven breaks instead of falling apart. That has not changed. What changed Friday is the short end of the curve.
The 200-day moving average is overhead and gold is sitting right on the 61.8% retracement level. The swing chart uptrend is still intact. A break with volume confirms the early week direction.
If you’d like to know more about how to trade gold, please visit our educational area.