


Gold Stays Caught Between War Demand and the Fed Rate Trade
Gold is getting support from the U.S.-Iran war, but the same conflict is keeping the metal from building a stronger bid. The Strait of Hormuz risk has pushed crude oil higher, and that is reviving the inflation trade. Treasury yields are firm. The U.S. dollar is firmer. Those are headwinds for non-yielding gold.
The market is not trading a clean safe-haven story. It is trading a war that can disrupt oil supply, keep inflation elevated and force the Federal Reserve to hold rates higher for longer. Gold has defensive demand underneath it, but the rate market is limiting the upside.
At 13:48 GMT, Spot Gold (XAUUSD) is trading $4011.53, down $5.785 or -0.14%.
Hormuz Shipping Risk Keeps the Oil Premium Alive
Shipping through the Strait of Hormuz has largely stalled under active military pressure. The United States launched another round of strikes against Iranian military command centers, coastal surveillance sites, missile and drone launch sites and maritime capabilities after the death of another American service member.
Iran retaliated against Bahrain and Kuwait. A vessel near Oman caught fire after being struck by a projectile. That is enough to keep a serious supply-risk premium in crude oil.
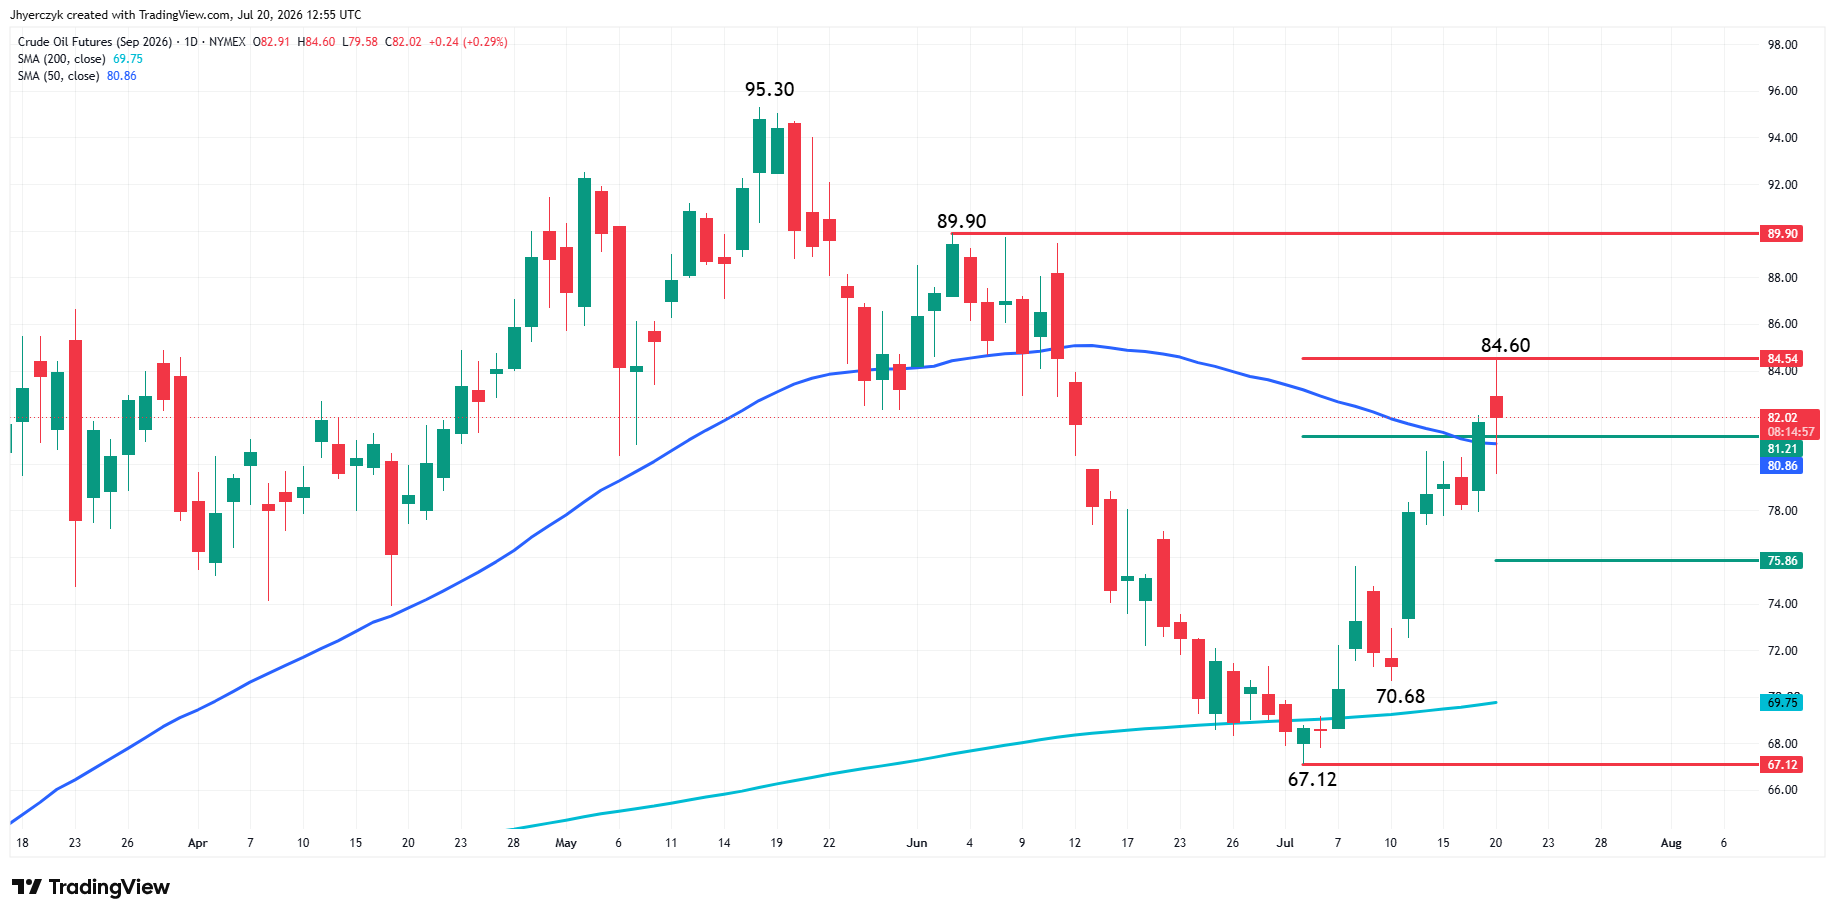
Nymex WTI crude oil is trading in the $82.00 to $83.00 area. Brent crude is holding near $89.00 to $90.00 per barrel after moving above $90 earlier.
The oil market remains the key for gold. A further disruption to Hormuz shipping sends crude higher, but it also strengthens the inflation argument. That can lift Treasury yields, support the dollar and make gold more expensive to own.
Gold Price Forecast
Every new Gold analysis as it publishes, today's technical signal and key levels, live price — on one page.
See all Gold forecastsStrong U.S. Data Keeps the Fed From Turning Dovish
The earlier reaction to softer June inflation data gave gold traders a reason to look for a softer Fed. That view has weakened.
Retail sales came in stronger. Jobless claims came in lower. The Philadelphia Fed manufacturing survey rebounded sharply. University of Michigan consumer sentiment also improved. The reports do not support an immediate turn toward easier monetary policy.
Traders still expect the Fed to leave rates unchanged at the July 29 meeting. The bigger issue is what happens after July. Higher energy costs are putting at least one additional rate hike back into the discussion later this year.
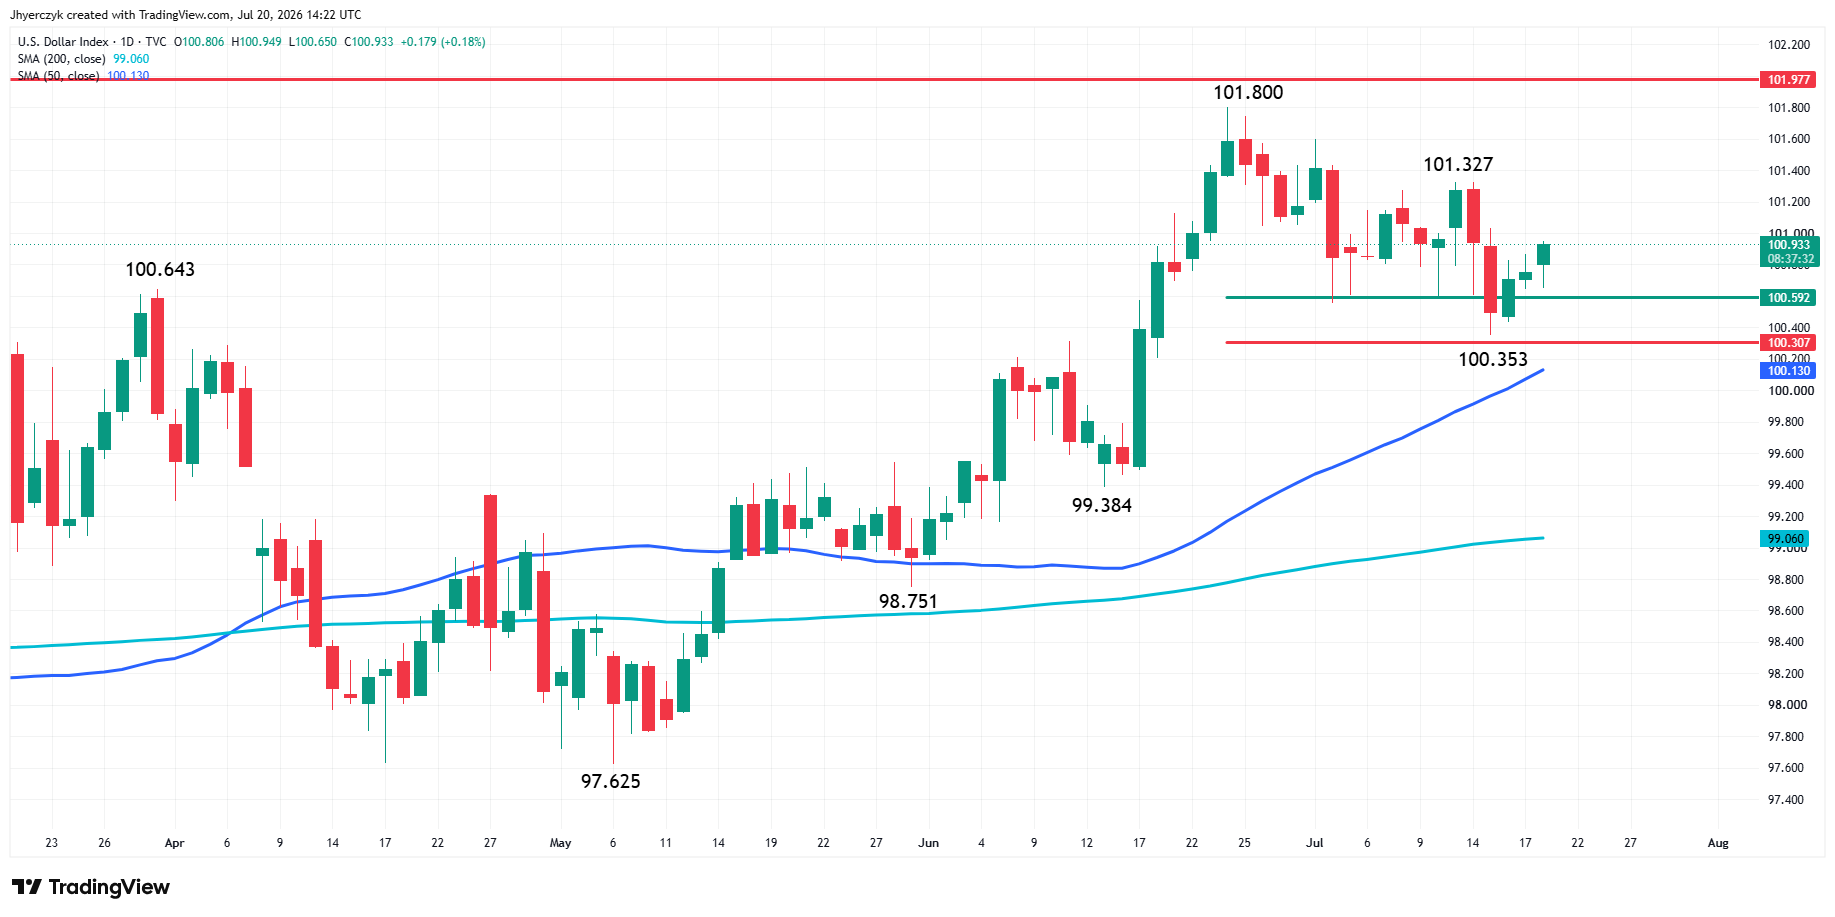
The 10-year Treasury yield is holding near 4.57%. The U.S. Dollar Index is near 100.87. Neither market is offering gold much help.
Gold Has Support, but the Ceiling Is Still Rates
The war is keeping defensive buyers interested. The oil move is keeping rate traders cautious. That is the conflict holding gold in place.
A ceasefire or a clear reopening of Hormuz shipping lanes would take some of the defensive demand out of the market. But another strike, a new attack on shipping or wider retaliation could quickly bring buyers back.
For now, gold needs one side of the trade to break. Either the war premium expands enough to overwhelm yields and the dollar, or crude oil eases enough to bring the Fed-rate trade back down. The metal is stuck between those two forces until the next headline changes the balance.
Daily Spot Gold (XAUUSD) Technical Analysis
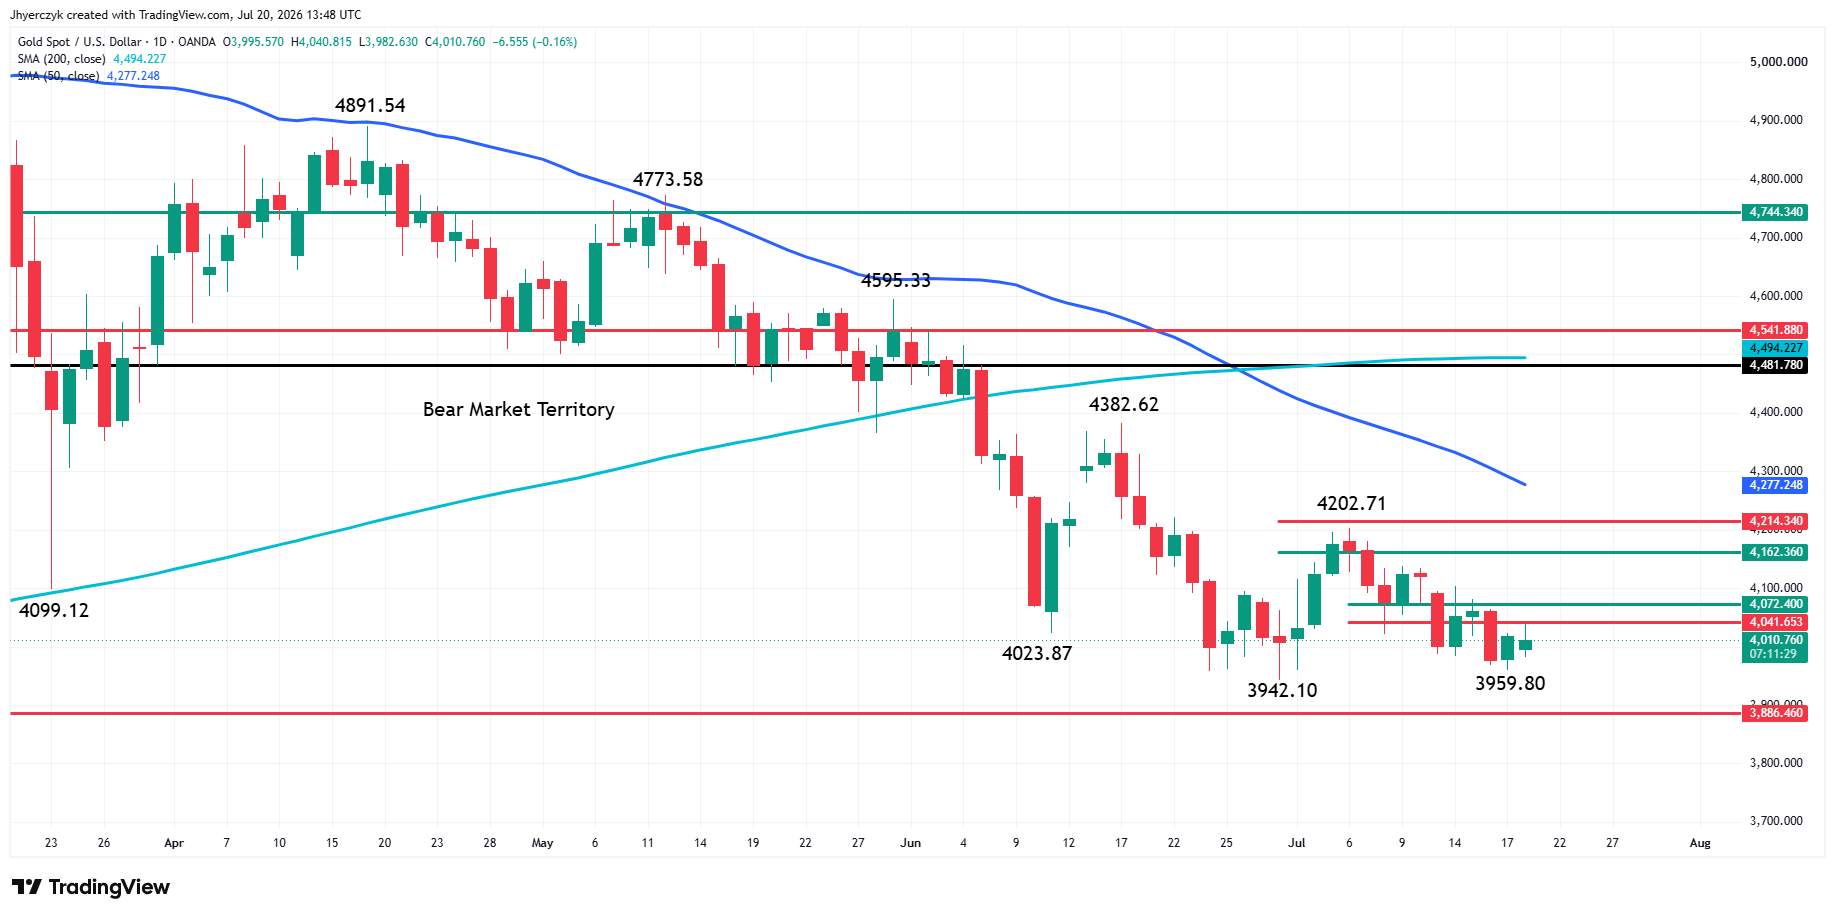
Spot gold is putting in a steady-to-mixed performance early Monday with the price action indicating the on-going battle for short-term control between the bulls and the bears.
By all of my major metrics, the main trend is down on the daily chart. The series of lower-tops and lower-bottoms on the swing chart clarify this assessment. The nearest swing top is $4202.71. The formation of the swing bottoms at $3942.10 and $3959.80 is most interesting to me right now.
I’m trying to determine if the buying that came in to stop the slide at those levels is profit-taking or bottom-picking due to some metrics like RSI indicating oversold conditions. The key filter to keep an eye on may be the open interest. Volume is one thing once a rally starts moving, but rising open interest on the long side may actually tell us if new buyers are actually coming in and establishing positions. Rising prices and falling open interest will tell me that the shorts are just lightening up.
The daily chart indicates there is long-term support at $3886.46. With the selling pausing slightly above this area, one can build a case for traders defending against a sharp sell-off under this support.
The aforementioned analysis has one thing in common and that is, it suggests passive bidding on weakness. And that centers the issue I have with gold right now. On the way up last December and January, gold investors were willing to take out offers, which is an aggressive way to trade, but also one of the best to get a market moving higher at a faster pace. What we’re looking at now maybe buying, more controlled entries that seemingly say buyers are letting the market come to them. That’s ok over the long-run for investors who believe in the upside potential of this market, but very frustrating for short-term players who want to make a quick buck.
The price action and the fundamentals are in sync, in my opinion. At the start of the year, investors were aggressively buying because the market had priced in as many as three Fed rate cuts. Now, the market is toying with the idea of a Fed rate hike, but no one is certain if it’s going to be in September, December or early next year. I’m convinced that we’re going to see more of the same type of trading until the investors get some clarity from the Fed.
Technically, one sign of aggressive positioning could be the overtaking of short-term retracement zones at $4041.65 to $4072.40 and $4162.36 to $4214.34. The swing top at $4202.71 would also have to go to break the bearish pattern of lower tops and lower bottoms. But this would only bring us to the 50-day moving average at $4277.32.
Although we could see periodic rallies, gold faces enough headwinds to make any rallies labored events. I think that more than ever, a good player is going to have to determine if he’s trading gold or investing in gold.
What to Watch
Crude oil and the next Iran headline are still running this market. The war keeps defensive demand underneath gold but the same conflict is pushing crude higher, strengthening the inflation case and keeping the Fed from turning dovish. Strong retail sales, lower claims and a sharp Philly Fed rebound took the last soft-landing argument away from the rate-cut crowd. Gold is stuck until one side of that trade breaks. Either the war premium overwhelms the rate story or oil pulls back enough to let easing expectations rebuild.
The technical picture confirms the stalemate. Buyers are bidding passively on weakness, not taking out offers the way they did in December and January when three rate cuts were priced in. That controlled buying keeps a floor under gold but it does not produce rallies with any follow-through. The pattern of lower tops and lower bottoms is still intact and until the swing top breaks, rallies remain labored events.
If you’d like to know more about how to trade gold, please visit our educational area.