Hyperliquid’s HYPE token is showing signs of recovery after testing the lower trendline of its prevailing bull flag pattern as support.

HYPE’s Flag Hints At Price Boom Toward $100
As of Tuesday, Aug. 4, the HYPE/USD exchange rate was down approximately 30% from its record high near $77, established two months ago. This downtrend coincided with weakness in the broader crypto market, as traders de-risked ahead of a potential Federal Reserve rate hike in September.
Nonetheless, the drop left behind a sequence of lower highs and lower lows, forming what appeared to be a bull flag pattern.
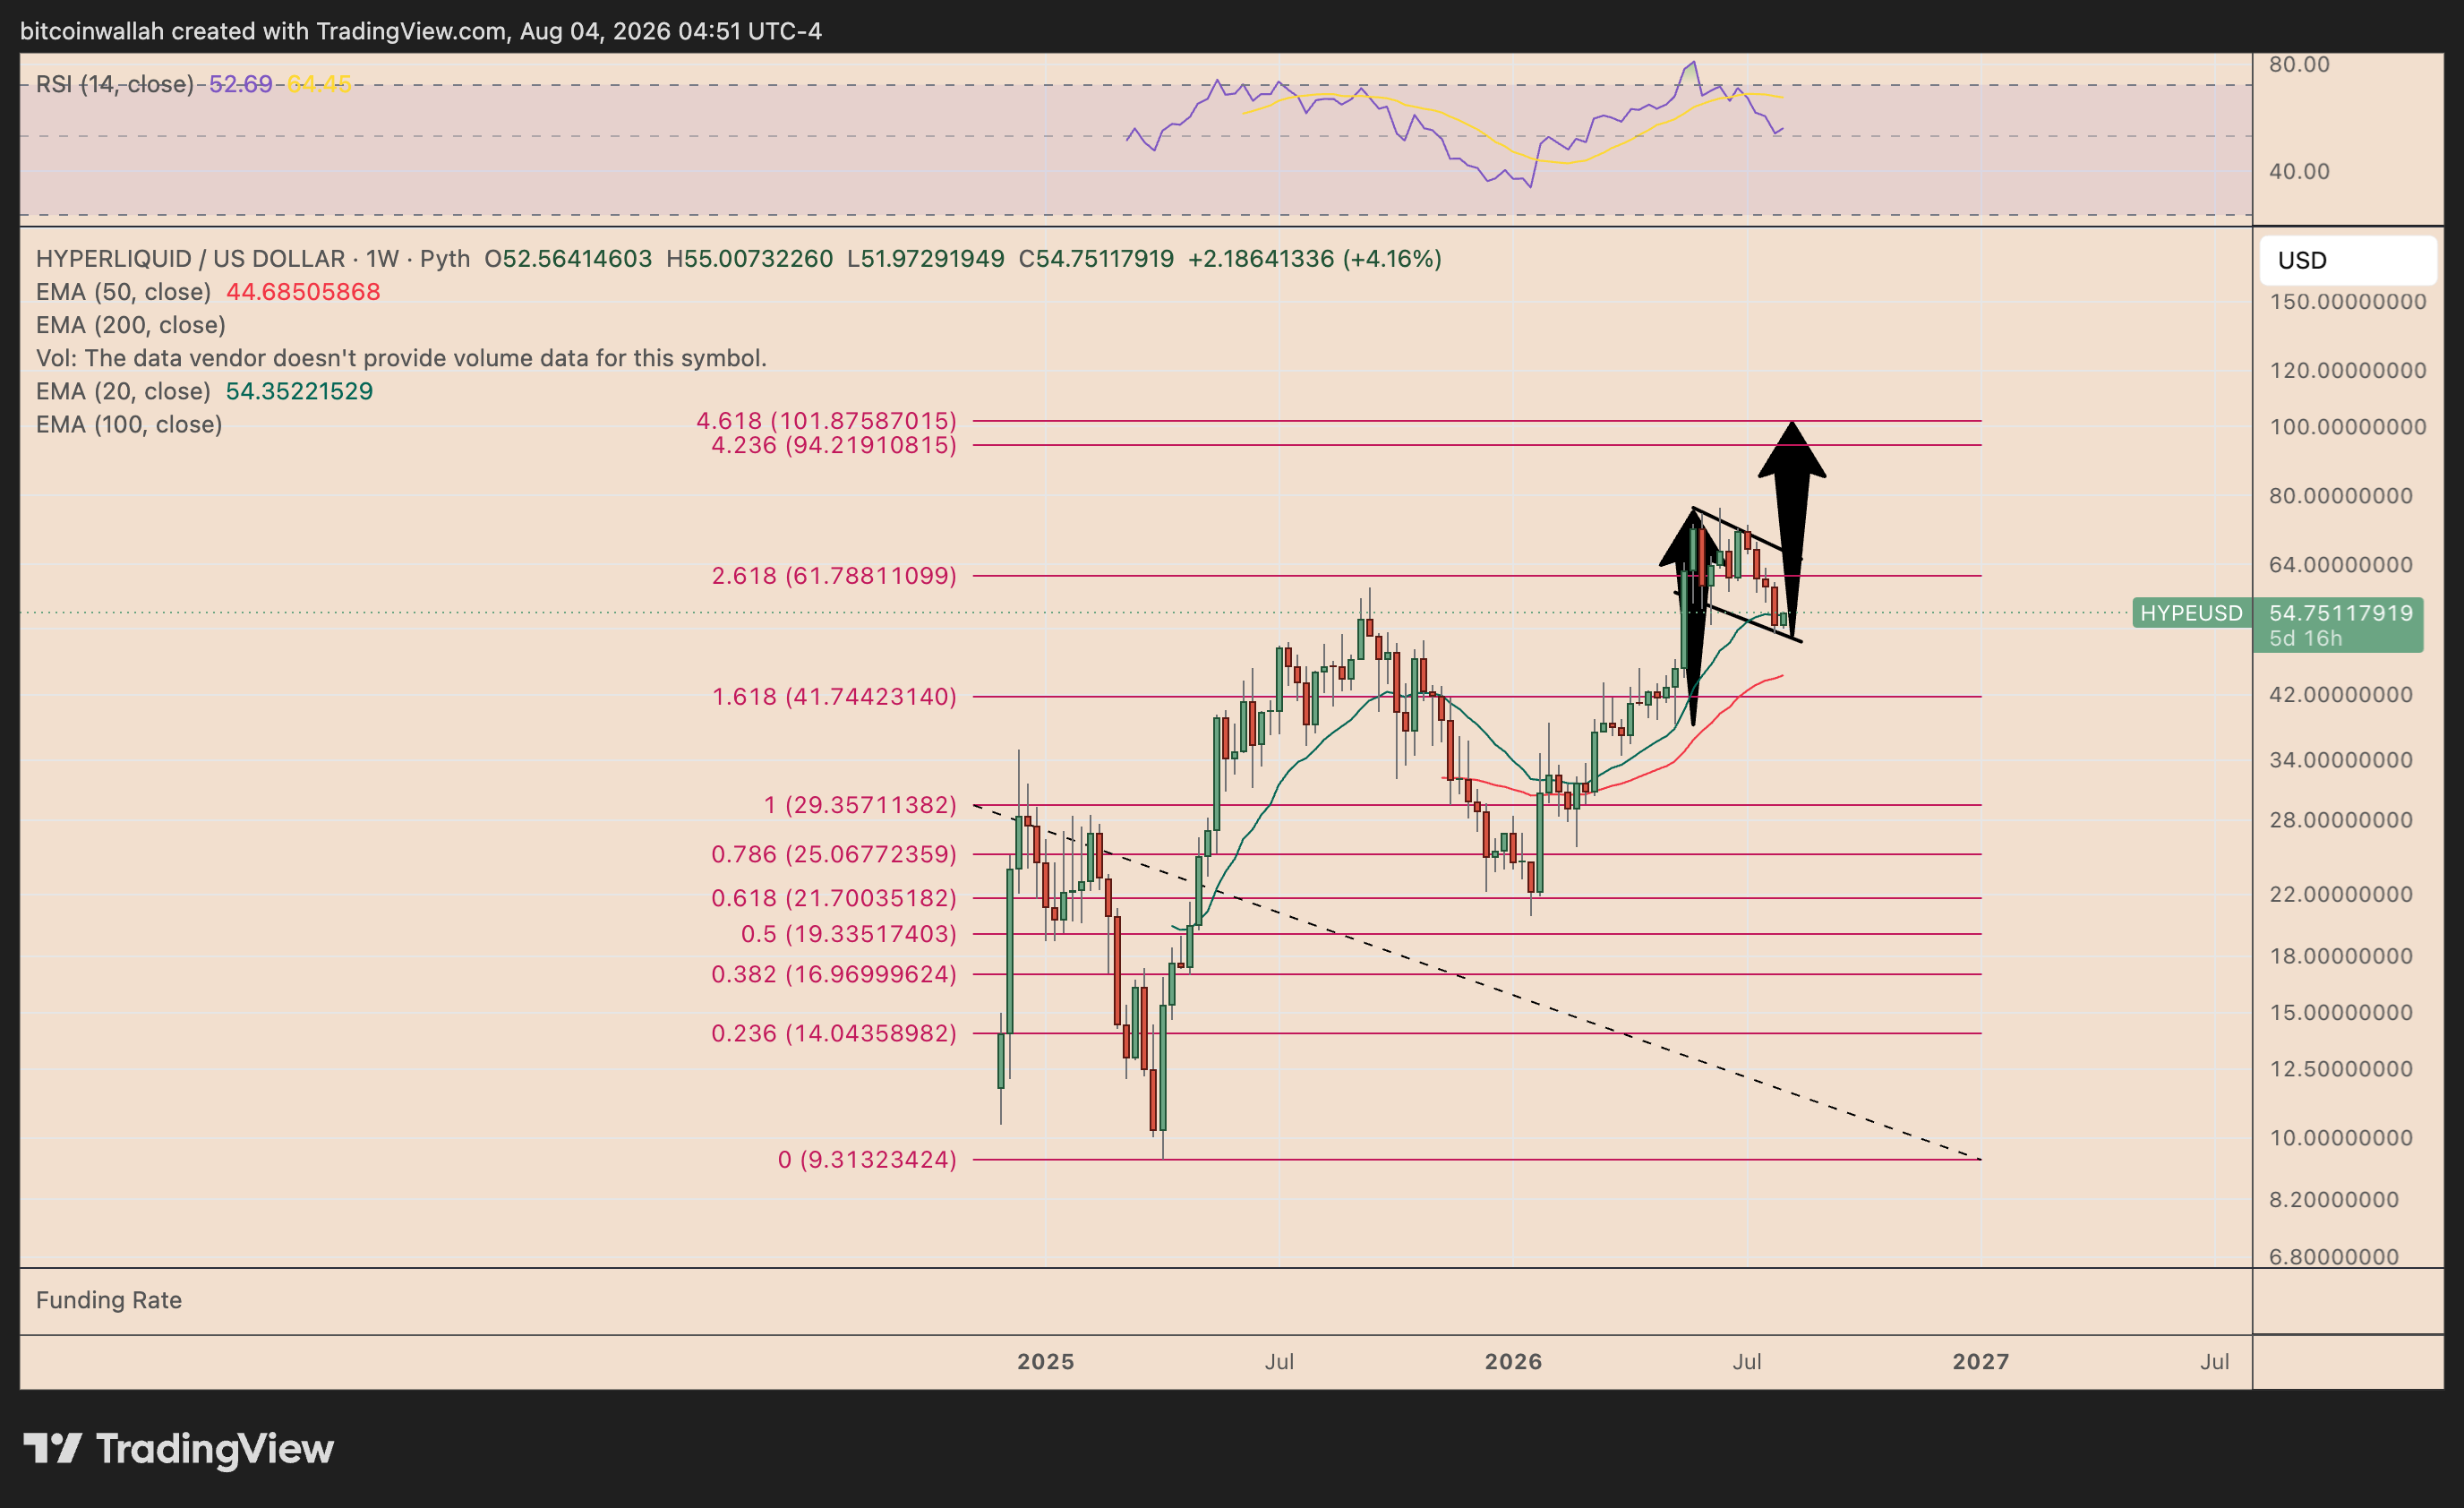
A bull flag pattern develops when price trends lower within a parallel descending channel after a strong uptrend. In technical analysis, such a setup resolves when the price breaks above the upper boundary and rises by as much as the height of the previous uptrend.
This week, HYPE bounced by approximately 4% after testing the flag’s lower boundary as support, increasing the odds of a short-term recovery toward the upper boundary, currently sitting around the $61–$65 area.
At the same time, the Hyperliquid DEX token may rally toward its bull flag measured target at around $100, a level coinciding with the 4.618 Fibonacci retracement line, if the price decisively breaks above the flag’s upper boundary.
In other words, a circa 85% price rally by 2026’s end.
What Could Go Wrong With This Bullish HYPE Forecast?
HYPE’s bounce has led us to a key resistance area led by its 20-week exponential moving average (20-week EMA, the green wave) near $54.35. A pullback from this zone may lead the price below the flag’s lower trendline, which will likely invalidate the bullish continuation setup.
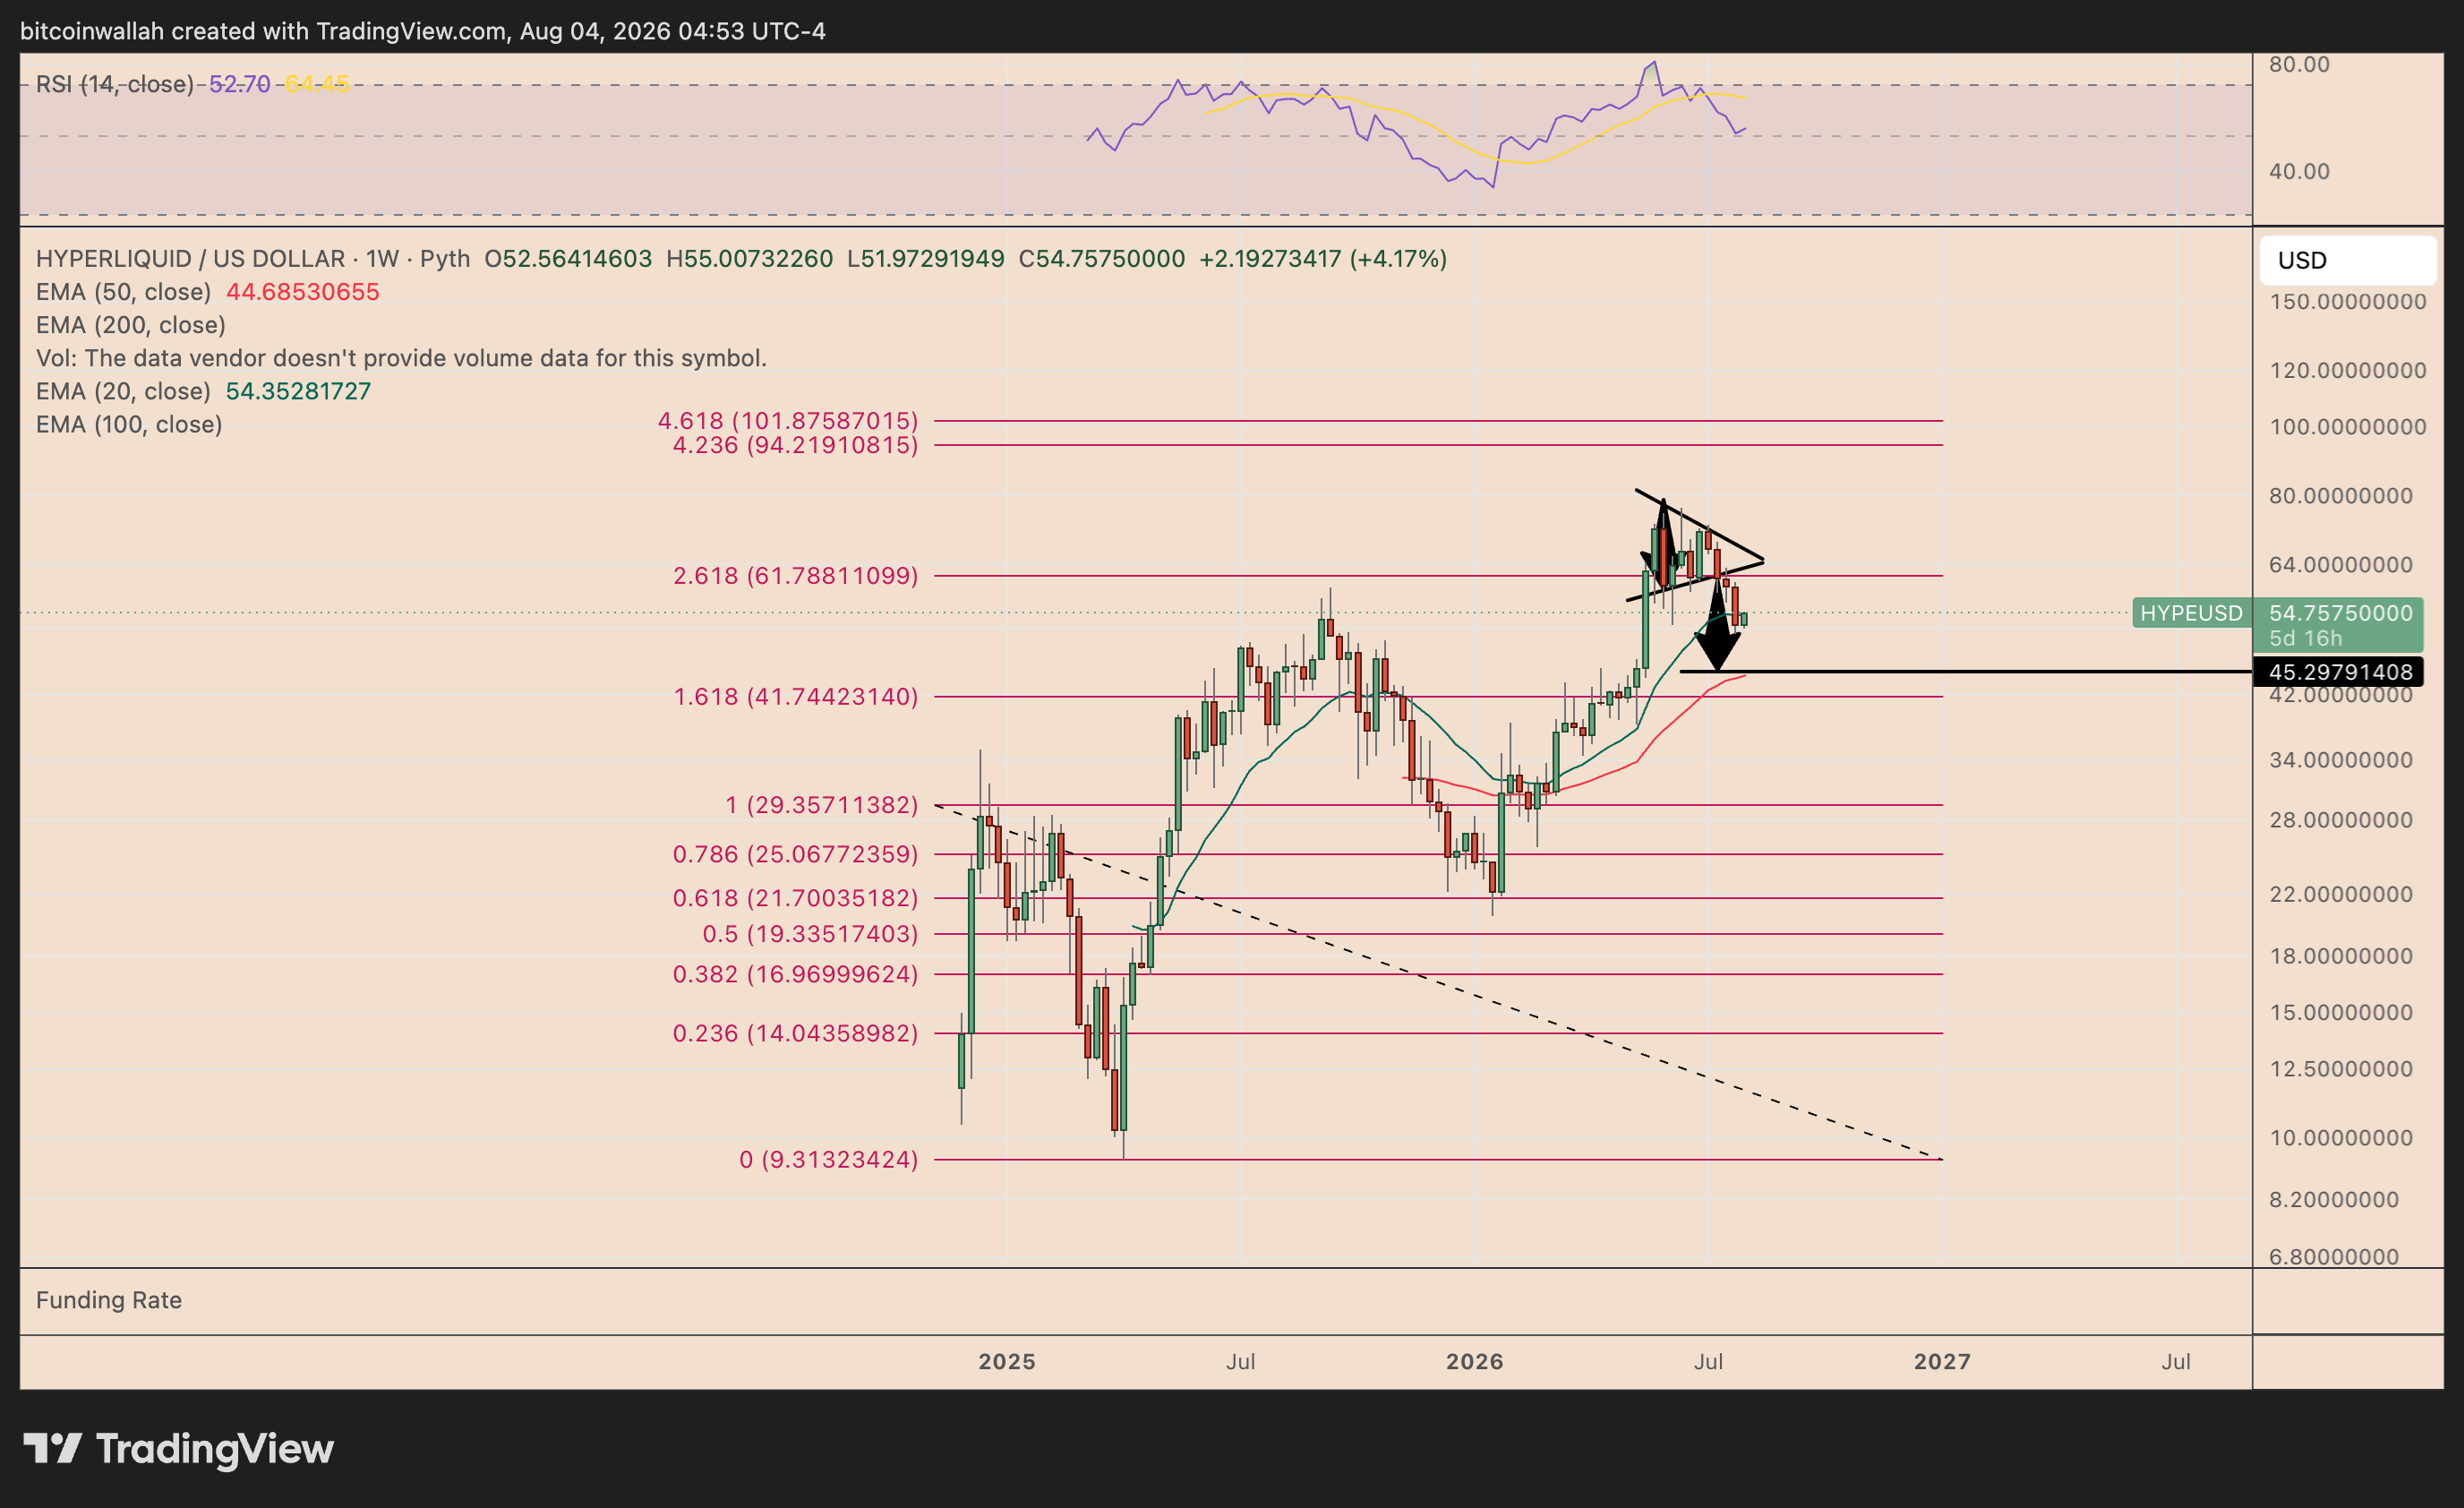
The HYPE/USD pair has already broken below the triangle’s lower trendline and is now eyeing a decline toward $45, a level measured after subtracting the triangle’s maximum height from its breakdown point near $61.75.
This downside target also coincides with the 50-week EMA (red) and the 1.618 Fib retracement line.
A breakout above the 20-week EMA risks invalidating the triangle breakdown setup.