



Gold News: Fed Outlook and Jobs Data Keep Metals in Focus
With the Federal Reserve’s policy considerations and the U.S. economic timetable being of primary concern, market participants will await July’s non-farm payrolls for further market cues. Recently, the Federal Reserve reviewed the U.S. cash rate in an anticipated 3.50% -3.75% range. This decision recorded a rare 9-3 majority vote. The 3 dissenting members remained hawkish. Fed Chair Kevin Warsh once more reiterated that future policy decisions will remain dependent on data, balancing the rate of inflation and prediction of risks. For the time being, markets will contend if the data will support a September pivot.
Recent data shows that although there continues to be strong demand for gold and silver from the institutional market, the purchasing of these metals by the official sector has lessened. The World Gold Council reported that in May, central banks purchased a net 41 tonnes of gold, with Poland and China being the largest buyers. The World Gold Council revised estimates of purchases during the first quarter, and the new, lower figures, showed that reserve accumulation slowed in early 2023. The Council’s annual survey reported that in the next 12 months, 89% of surveyed central banks expect holdings of gold will rise, confirming the reserve diversification role of gold.
Silver fundamentals remain strong as structural industrial demand persists, even with a weaker manufacturing environment. Demand for solar photovoltaics, AI infrastructure, power-grid investments, and advanced electronics continue to support silver’s price long-term. Since these developments are stronger than investment flows, they support the silver market. The constant developments in the Middle East will continue support silver as a safe-haven and will allow for inflation to increase and support negative real rates of return.

Gold (XAU/USD) Technical Analysis: Triangle Resistance Keeps Bullish Breakout on Hold
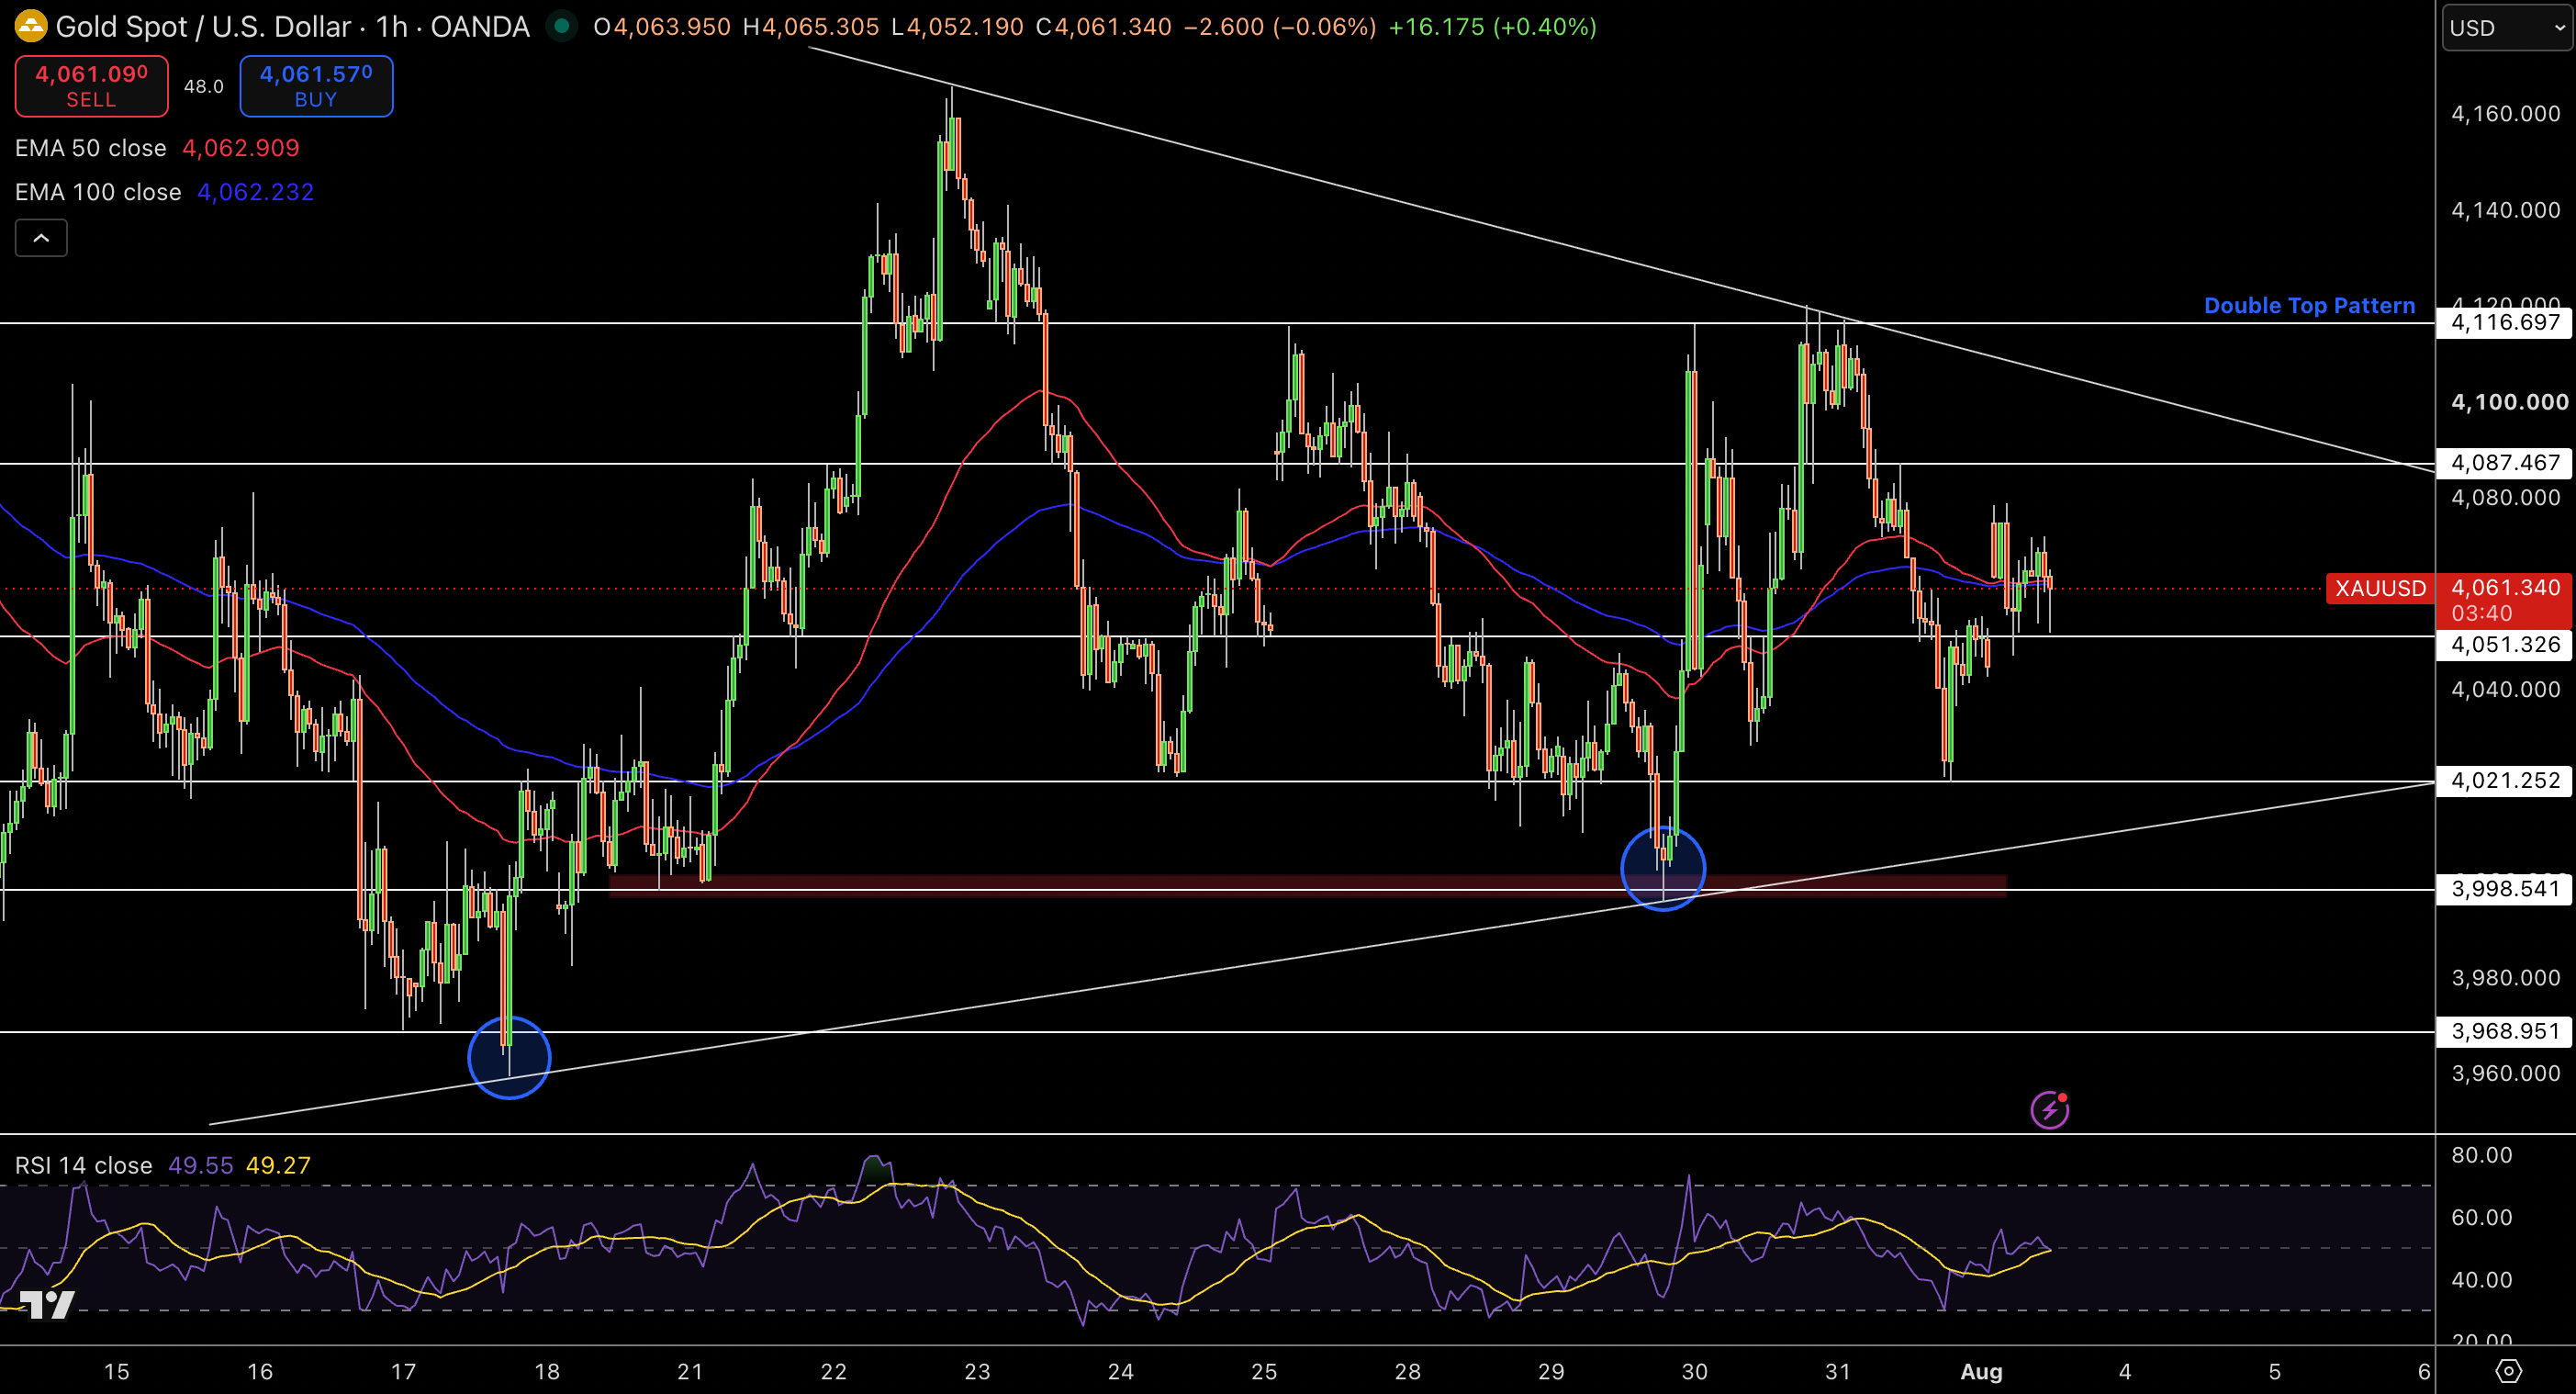
Gold (XAU/USD) prices have strongly resumed a bullish trend. They have bounced off the major support at $4000 and broken the consolidation at $4061. The 1-hour prices are at the 50-EMA ($4062.90) and the 100-EMA ($4062.23). The buyers have not managed to overcome the declining resistance of the most recent price levels, but the consolidation of the prices has been characterized by the formation of higher lows, which gives it a bullish outlook.
The first resistance zone is at $4087 to the double-top resistance at $4116. The region is expected to produce the highest prices to date. The demand zone is expected to protect the $4051 support, and the $4021 and $4000 levels.
The RSI is neutral at 50, and the lack of a market trend reinforces a price consolidation. The first resistance zone is at $4087. A break is expected to give the market a bullish outlook. In the absence of that, a consolidation of prices will be sustained.
Silver (XAG/USD) Technical Analysis: Symmetrical Triangle Signals Imminent Breakout
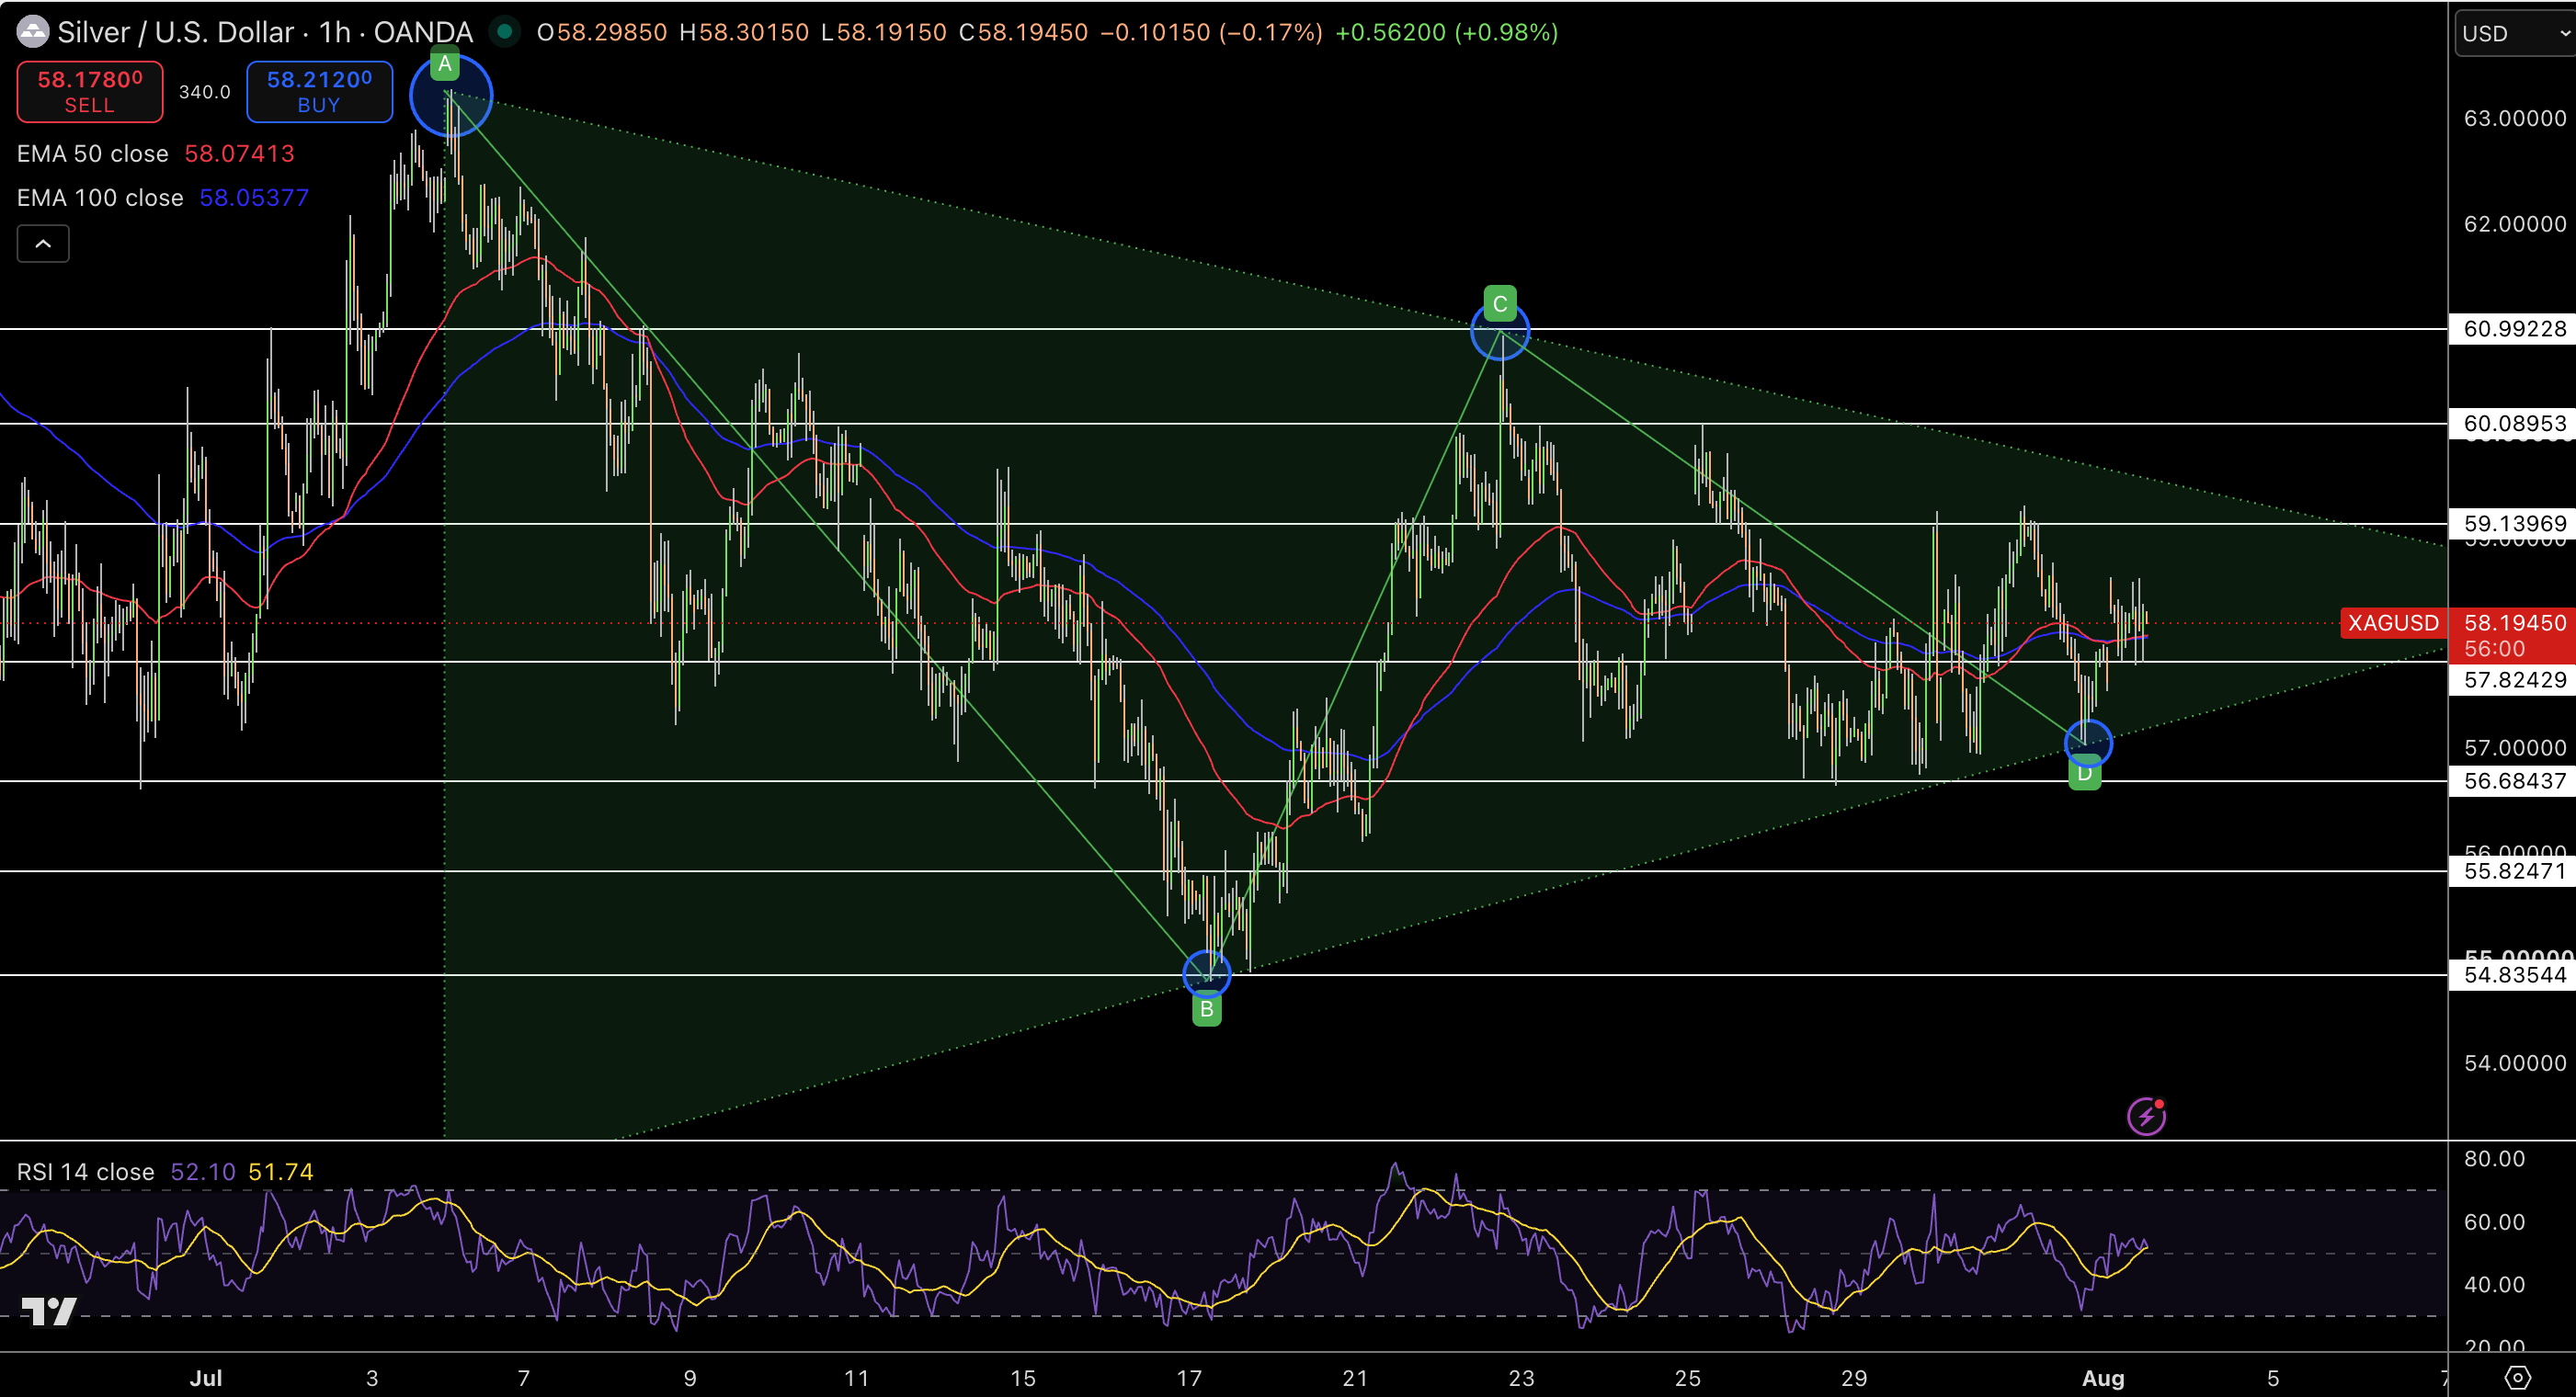
Silver is working to create a symmetrical triangle consolidation pattern. The mid-point of this pattern is at $58.32, which has a price of $58.32 and is slightly bullish since it is above both the 50-EMA ($58.07) and the 100-EMA ($58.05).
Gold Price Forecast
Every new Gold analysis as it publishes, today's technical signal and key levels, live price — on one page.
See all Gold forecastsThe triangle pattern shows a series of lower highs and higher lows and it is indicative of a decrease in volatility prior to a breakout. Bullish momentum is increasing and RSI has surpassed 50 but is not yet in the overbought region.
Resistance levels occur at $59.14, $60.09, and at the significant swing high of $60.99. Support begins at $57.82 and $56.68 is a target for buying activity should silver fall to the lower trendline.
The expectation is for an upside breakout with silver remaining above the rising trendline. Breakout of $59.14 is anticipated to propel silver to $60.10–$61.00, on the other hand, a fall below $57.82 is expected to break the bullish scenario and silver will fall to $56.68.


