Microsoft Technical Analysis
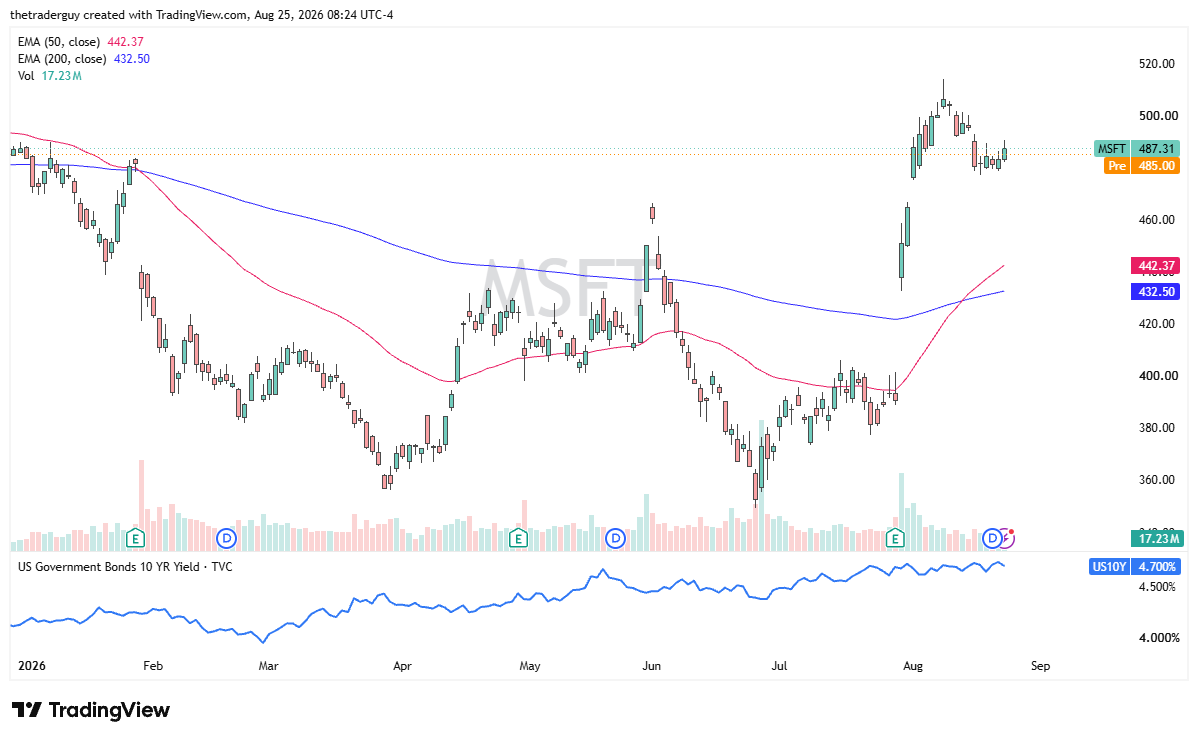
The pre-market trading for Microsoft is a little bit soft, but we are right in an area that has been significant support over the last couple of days, so it looks more or less like it is going to be more of the same.
The $500 level above is an area that a lot of traders will be paying attention to, as it’s a large, round, psychologically significant figure and an area that is very noisy from what we had seen previously.
Overall, this market is one that had exploded to the upside, so a little bit of a pullback wouldn’t necessarily be overly surprising. The Golden Cross occurred several days ago, and the ex-dividend date has just passed.

Oracle Technical Analysis
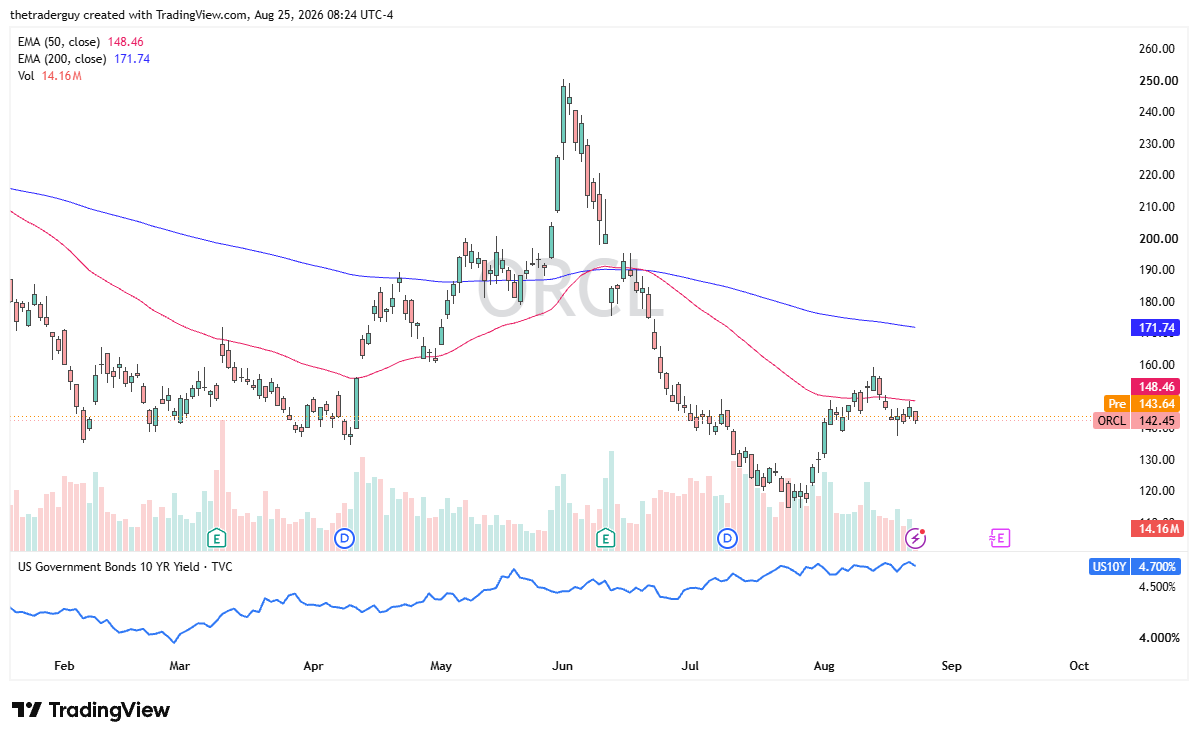
Oracle looks like it is going to be slightly positive during trading here on Tuesday with the 50-day EMA sitting just above, offering a little bit of technical resistance.
Oracle has rallied quite nicely over the last month or so after falling apart, but it’s worth noting that we have an earnings call in September, right around the middle of September, so the next couple of weeks might be perhaps trying to get in position ahead of that.
Intel Technical Analysis
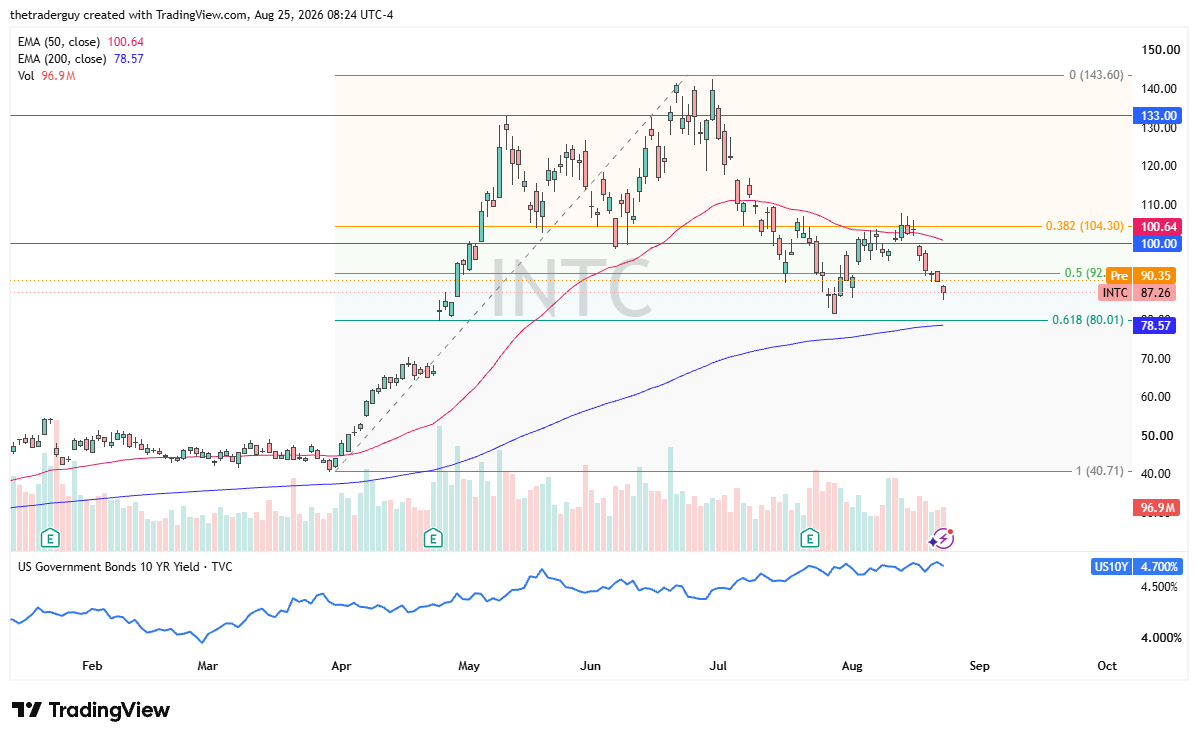
Intel looks like it is going to gap higher to kick off the trading session on Tuesday after forming a bit of a hammer on a negative gap lower on Monday. Intel had been one of the better performers that I watch, but now is currently in the midst of trying to form some type of range.
The 200-day EMA sits right around the $78.57 level, which is also where the 61.8% Fibonacci retracement level holds. So with that, I think we have to look at this as a market that’s in the midst of trying to find its floor. The rally first thing in the morning, though, is a good sign.
If you’d like to know more about technical analysis and how traders use it, please visit our educational area.