The Nasdaq 100 has corrected from 31,400 as semiconductor stocks came under selling pressure. The competition from Chinese chip manufacturers has raised concerns about future profits. High cost of borrowing makes large infrastructure projects harder to justify. ASML and TSMC reported strong results last week, but concerns about AI funding and future returns on investment continue to weigh on sentiment.
Inki Cho, Senior Financial Markets Strategist at Exness, commented:
The appetite for AI chips hasn’t slowed down, but more competition keeps investors wondering who will come out on top. Chinese manufacturers are catching up fast, raising questions about how much profit the established chipmakers can hold on to. At the same time, AI infrastructure still costs a fortune to build, so companies are under growing pressure to prove the investments are actually bringing in revenue. All eyes are on ASML and TSMC’s upcoming results, which could give a clearer read on demand and the problems chipmakers are facing.
In my view, steadier chip stocks and greater confidence in AI funding could help improve the outlook for Nasdaq. This article discusses the latest developments and conditions that could shape the next move in the Nasdaq index.

Nasdaq 100 Fundamentals: Semiconductor Selloff and China Competition
China Competition Weighs on Semiconductor Stocks
The Nasdaq 100 closed at 29,213.4 on Friday after the selling in semiconductor stocks deepened the correction from the early record high in October. Concerns about Chinese competition and the funding needed for AI infrastructure continue to weigh on sentiment.
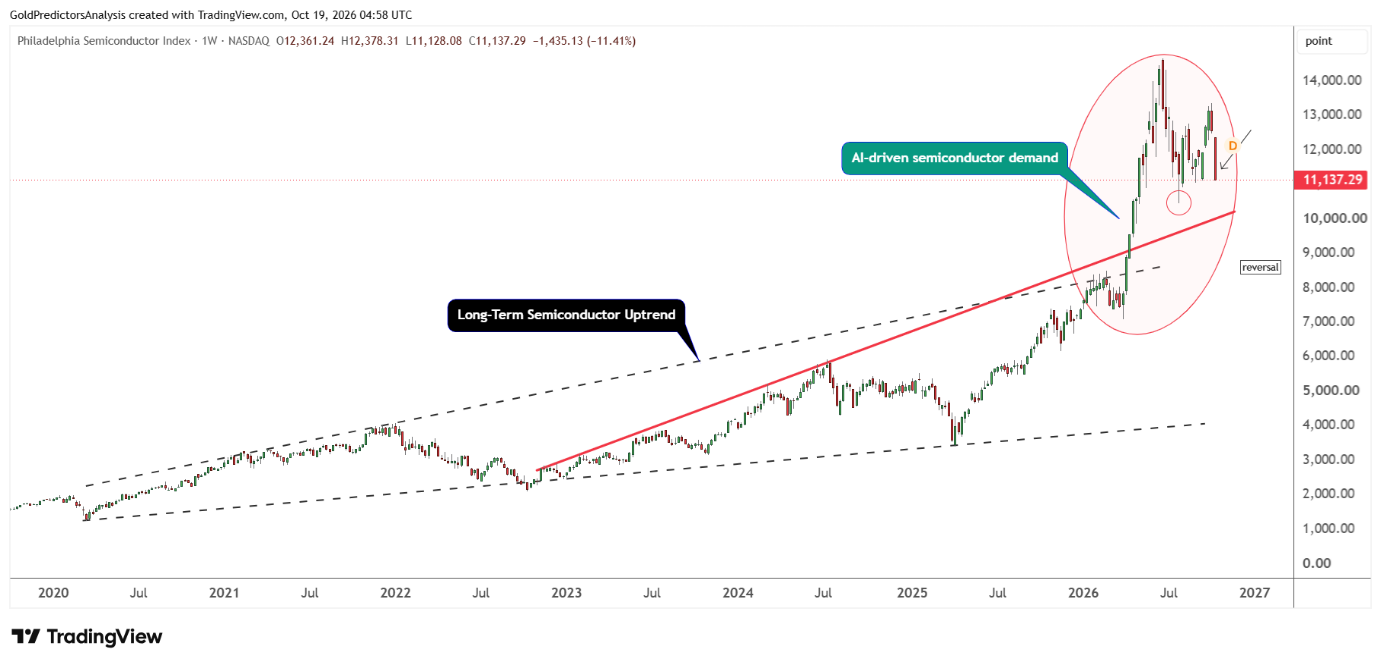
The chart below shows the Philadelphia Semiconductor Index continues to drop towards the rising trend line near 10,200. The index dropped about 11.41% last week. This decline signals weaker momentum in the short term and keeps the lower support area in focus.
The competition from the Chinese chip manufacturers has become a fresh source of concern. Progress in memory technology at ChangXin Memory Technologies (CXMT) contributed to the selloff in semiconductor stocks last week.
Investors are worried about the strong competition that may weaken the pricing power of established memory suppliers. That may put future margins under pressure even if demand remains strong.
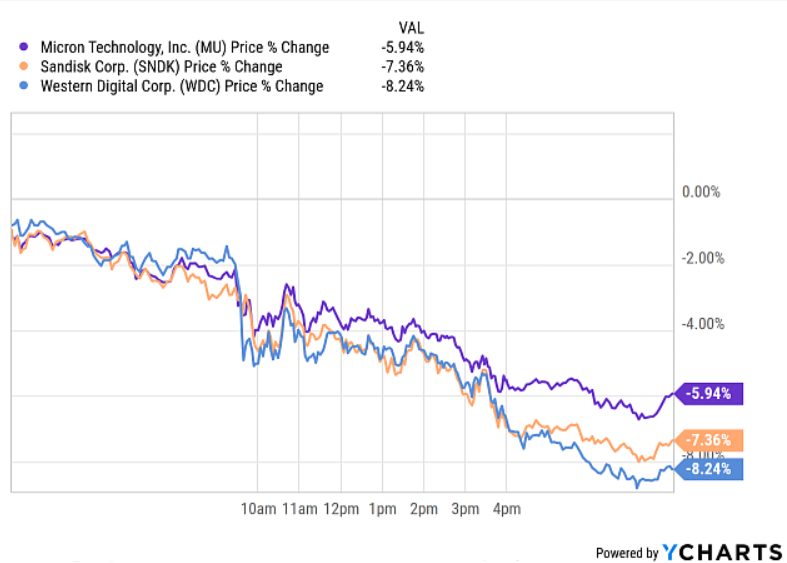
The chart below shows that the major memory chip stocks lost momentum during the past 24 hours. Micron Technology Inc. (MU) lost 5.94%, SanDisk Corp. (SNDK) lost 7.36% and Western Digital Corp. (WDC) lost 8.24%.
NASDAQ 100 Price Forecast
Every new NASDAQ 100 analysis as it publishes, today's technical signal and key levels, live price — on one page.
See all NASDAQ 100 forecastsNvidia Loses Ground in China
Nvidia Corp. (NVDA) is losing ground in China. Nvidia’s share of China’s data-centre AI chip market dropped to 34% in the first half of 2026. Its AI accelerator shipments to China dropped 44% from a year earlier, while Huawei captured 28% of the market. The US export restrictions and the push of China toward domestic suppliers helped drive the shift. These figures add to concerns about Nvidia’s access to a major market.
The funding has become another major concern. Broadcom CEO Hock Tan said on October 12 that capital would become the biggest constraint of the company as it overcame wafer and memory shortages. BlackRock also reduced the US equity view from overweight to neutral to manage volatility around the AI buildout. BlackRock described the change as short-term risk management and retained the conviction in AI fundamentals. These developments suggest that the investors want clear evidence that expensive projects can produce worthwhile returns.
Nasdaq 100 Outlook: Strong Chip Earnings Face AI Funding Risks
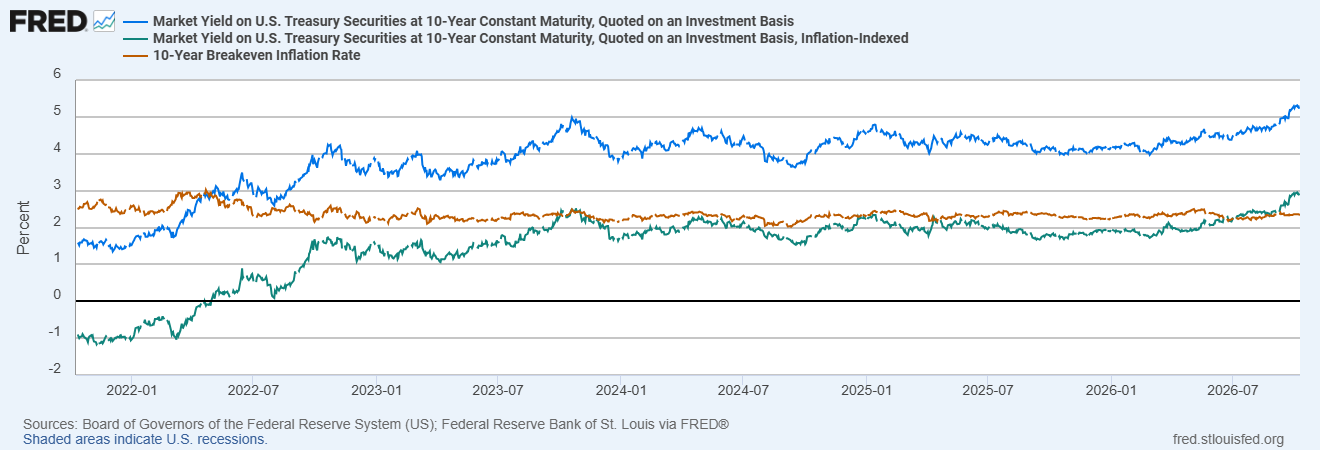
The correction in 10-year US Treasury yields after reaching a high of 5.36% could support valuations for the technology stocks in the short term. But this correction does not remove the cost of funding large AI projects.
Brent crude oil also trades near $109.50, which keeps the risk of inflation in focus. The chart below shows that much of the increase in Treasury yields reflects higher real yields while breakeven inflation has changed less.
ASML Holding (ASML) reported record quarterly sales of €11.7 billion on October 14 and projected full year sales of €44 billion to €45 billion. The company said that the investment in AI continued to drive customers’ equipment demand forecasts. These results support continued spending on production for advanced chips.
Taiwan Semiconductor Manufacturing Company Ltd. (TSMC) also reported quarterly revenue of $46.72 billion on October 15 and forecast Q4 revenue of $52.3 billion to $54.3 billion. These earnings support the outlook for chip demand. But the strong supplier revenue alone does not establish whether customers will earn enough from AI services to justify the infrastructure spending.
Meta Platforms Inc. (META) introduced Muse Wonder and Muse Wonder Full on October 12. Microsoft Corp. (MSFT) also announced plans to expand the Maia AI infrastructure with Maia 300 production deployments planned for 2027. These announcements suggest that the investment in AI persists. In my view, a clear recovery in Nasdaq also requires greater confidence that this spending can support profits.
Nasdaq 100 Technical Analysis: Key Support After the Pullback
Bullish Chart Patterns Support the Broader Nasdaq Outlook
From a technical perspective, the Nasdaq 100 failed to hold above 30,600 and corrected lower. The index extended the decline and closed the week at 29,213.41. This reversal from the record high weakens the outlook in the short term.
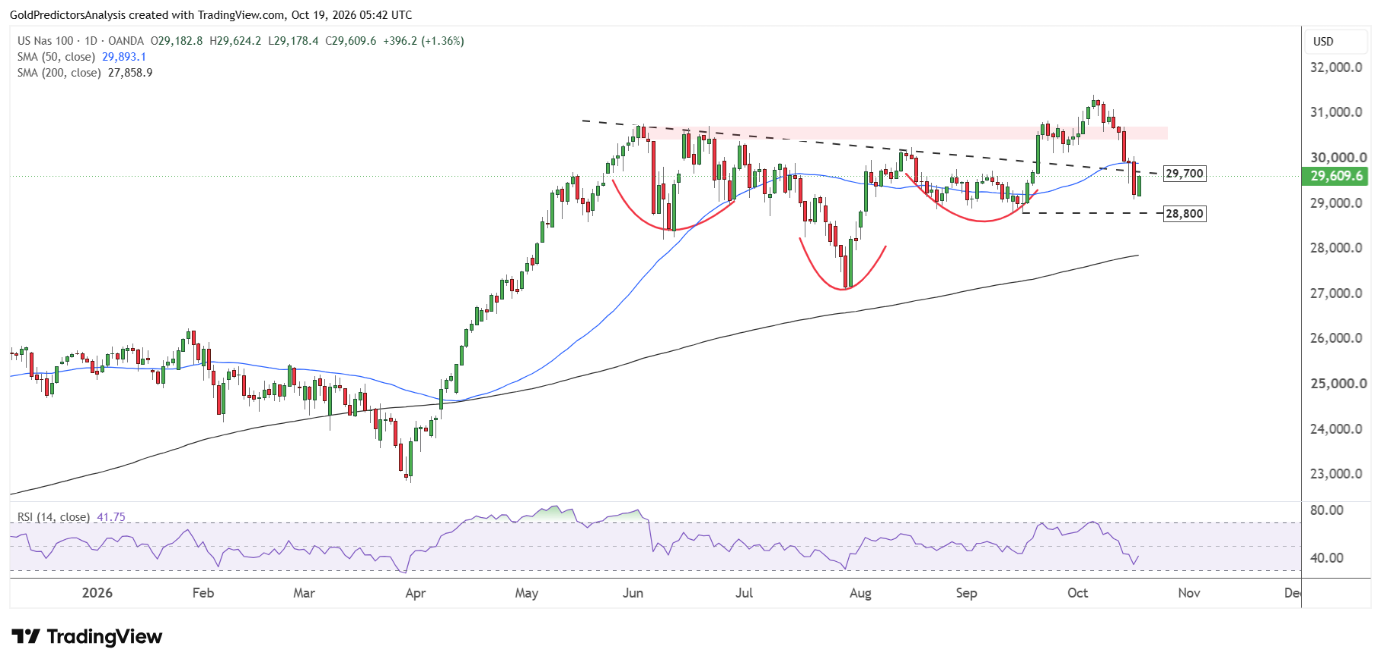
The earlier inverted head and shoulders pattern provides useful historical context. But the decline back below the neckline weakens the bullish breakout signal. The head formed in July at 27,093, the left shoulder formed in June at 28,202 and the right shoulder formed in September with a low at 28,795. Despite the correction, the index still remains well above the 50- and 200-week SMAs. The buyers need to hold the former support zones to strengthen the recovery outlook.
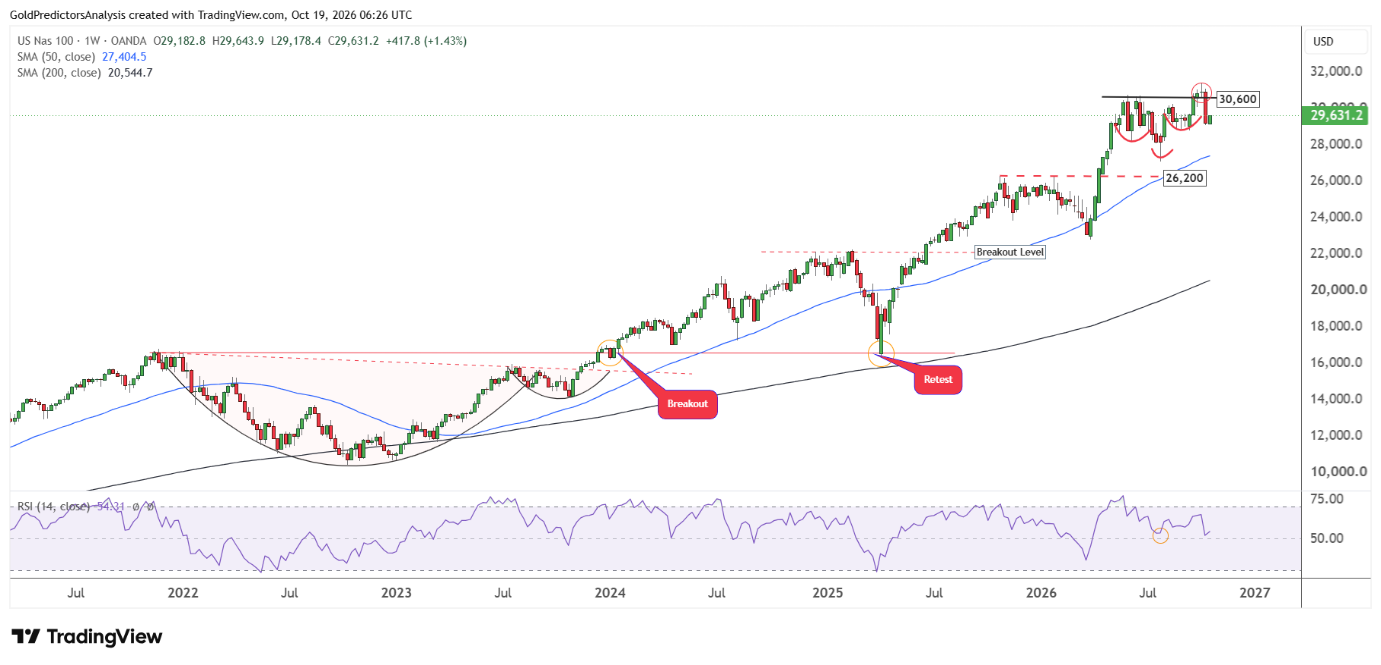
The formation of a cup and handle pattern from November 2021 to January 2024 suggests that the base has been formed. The V-shaped recoveries in April 2025 and March 2026 further support the strong bullish momentum. These structures suggest bullish view for the Nasdaq 100 in the long term.
Nasdaq 100 Daily Chart: Key Support at 30,400 and 29,700
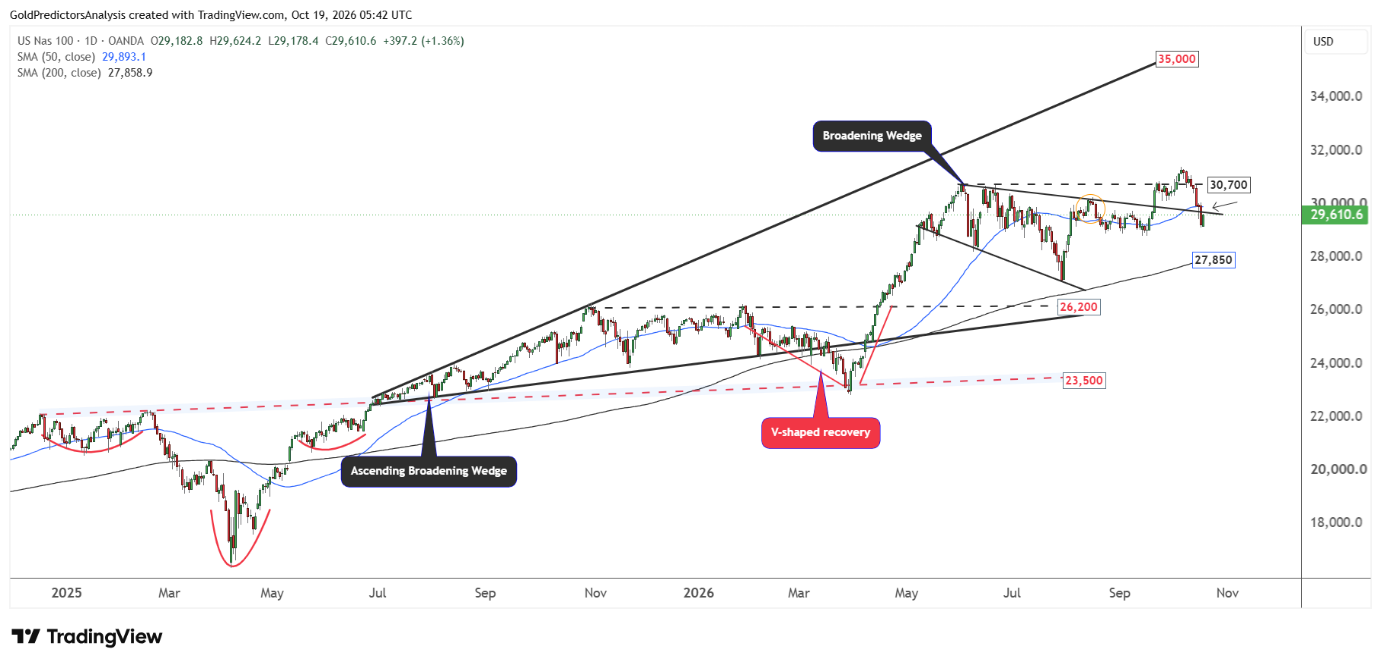
This bullish structure is also observed on the daily chart, which shows the formation of the inverted head and shoulders pattern from December 2024 to June 2025. Then the index formed an ascending broadening wedge pattern from June 2025 towards the record high.
The index has also formed a descending broadening wedge pattern that stretches from the June 2026 highs to September 2026. After the breakout from this wedge, the index continued to rally towards the record high. But the latest drop has pushed the index back within the descending broadening wedge. Now, the index needs to recover above the 50-day SMA at 29,900 to suggest a recovery.
The daily chart below shows that the Nasdaq 100 has dropped below the former support zones at 29,700. This support now becomes the immediate resistance during recovery. The low of September near 28,800 is the next historical support reference to examine whether selling continues.
What to Watch Next for the Nasdaq 100
The market now waits for Meta’s earnings results after the US market closes on October 21 for further clues on AI spending and profitability. The strong chip earnings support demand, but funding concerns remain important for market sentiment. The Nasdaq 100 needs to recover above 29,900 to open the way for a rally to 30,600. In my view, the index remains bullish in the long term, but the breakout failure at 30,600 calls for caution until the semiconductor stocks stabilize and the index recovers above 29,900.