
Oil News: Hormuz Diplomacy Deepens as U.S. Gas Stocks Rise
August 28 oil fundamentals show signs of diplomatic unrest in the Strait of Hormuz, though actual shipment levels remain far below normal. Iran is reportedly preparing to allow broader maritime traffic. Kpler data indicated only seven commodity vessels crossed the strait yesterday, compared to 17 the day prior and below the ten-day average of 15. Reuters estimates show little change in shipping levels and have shown shipping levels well below the pre-war levels. This has kept both WTI and Brent sensitive to supply disruptions.
OPEC+ is also struggling to impact supply. Reuters indicates the group’s global oil production, which was above 48% before the war, has dropped to about 40% in July, as Gulf oil production and exports have been limited by the war. Meanwhile, China’s crude imports have remained relatively low, acting as a demand-side oil import buffer to the Middle East supply disruptions.
U.S. petroleum inventory reports continued to show mixed results. EIA data for the week ended August 21, showed Commercial crude stocks remained at around 428.9 million barrels, while gasoline stocks and distillate stocks fell, although distillate inventories remained very low and provided continued tightness in the diesel and jet fuel market.
Natural gas inventory levels are also more comfortable domestically. EIA data released August 27 showed an increase of working gas in storage to 3,184 Bcf, up 15 Bcf from the prior week.
Vulnerabilities in global LNG supply persist, though Qatari supplies remain largely out of reach. As of the 28th, the global supply is fragile due to weak Qatari LNG exports despite improved Hormuz diplomacy and reduced risk for crude. Lack of availability of Gulf shipping, limited refined fuels and constrained Qatari exports still pose challenges to global supply.

Natural Gas Technical Analysis: NG Holds Breakout Above $2.90 as $3.00 Comes Into Focus
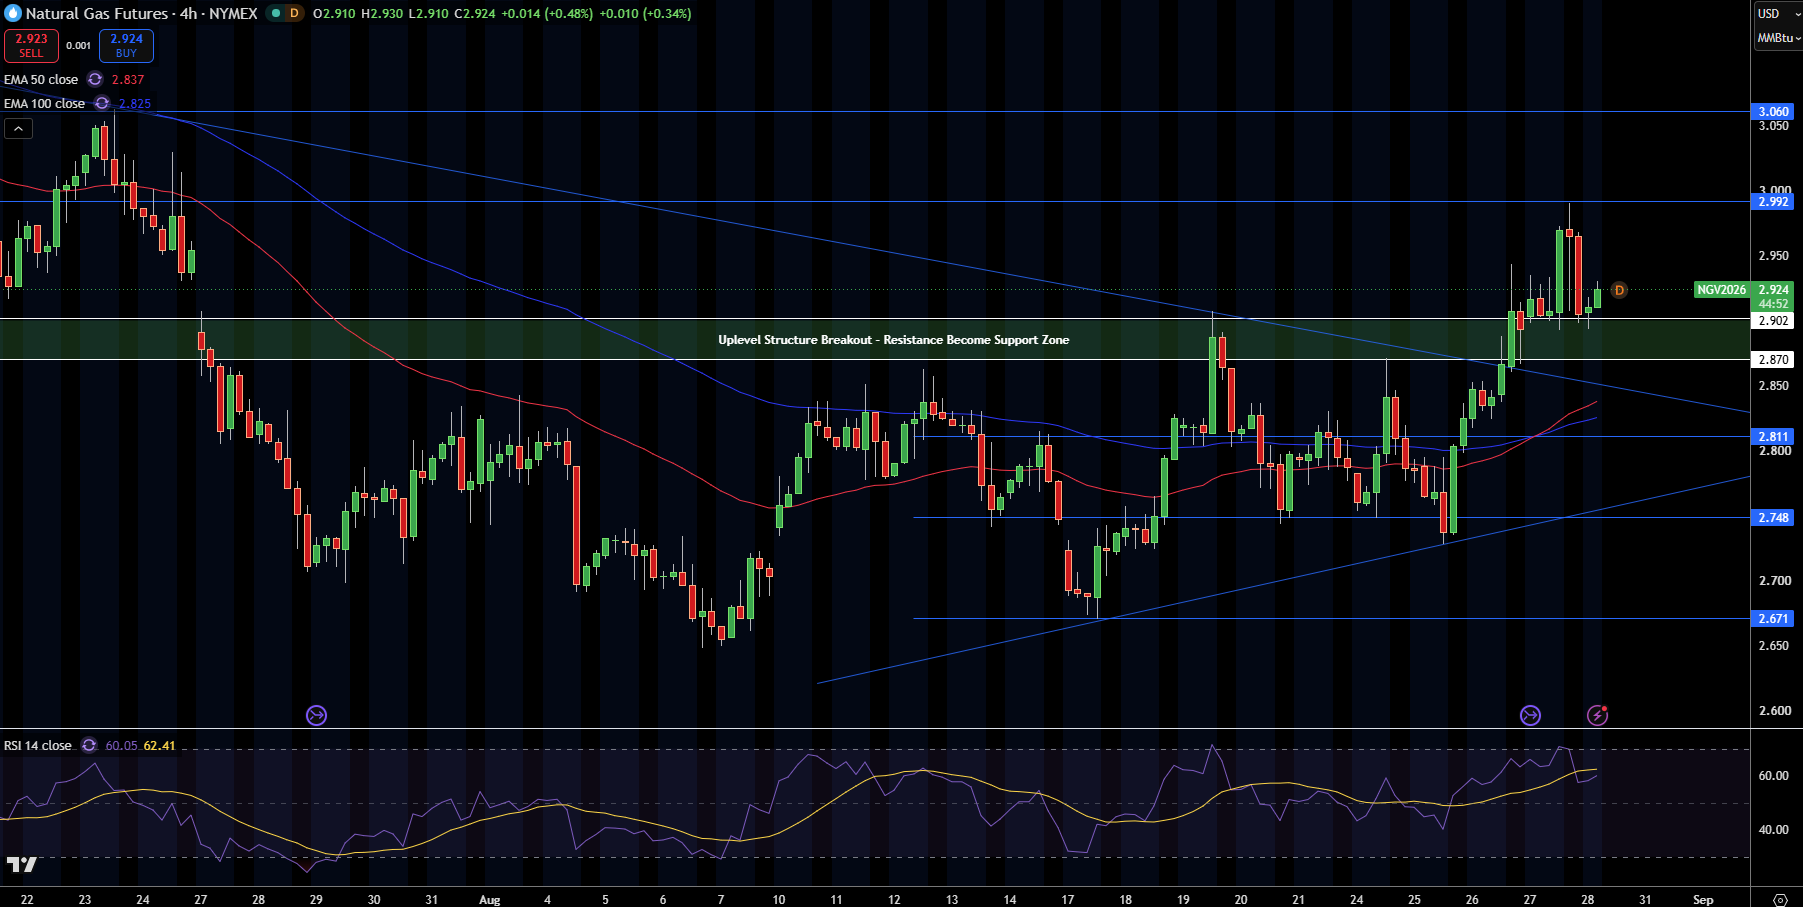
Natural gas is trading around $2.92 on the 4-hour chart after breaking above the descending trendline and holding above the previous resistance zone of $2.87-$2.90. That zone is now strengthening the structure of the bullish market (support). Finally, price is comfortably sitting above the 50-EMA at $2.84 and the 100-EMA at $2.83.
RSI is at 60, indicating a bullish structure without entering extreme overbought territory. Above this level, we can find potential resistance at $2.94, then $2.99, and $3.06. Potential support levels range from $2.90-$2.87, then $2.81, $2.75, and $2.67.
Based on this analysis, I believe natural gas holds a bullish structure as long as it is trading above $2.87-$2.90. A break above $2.94 may challenge the resistance zone of $2.99 and $3.06. A break of $2.87, however, would be a sign that natural gas needs to fill the gap at $2.81.
Natural Gas Price Forecast
Every new Natural Gas analysis as it publishes, today's technical signal and key levels, live price — on one page.
See all Natural Gas forecastsWTI Crude Oil Technical Analysis: WTI Reclaims $83.26 but Still Needs $85.73 Breakout
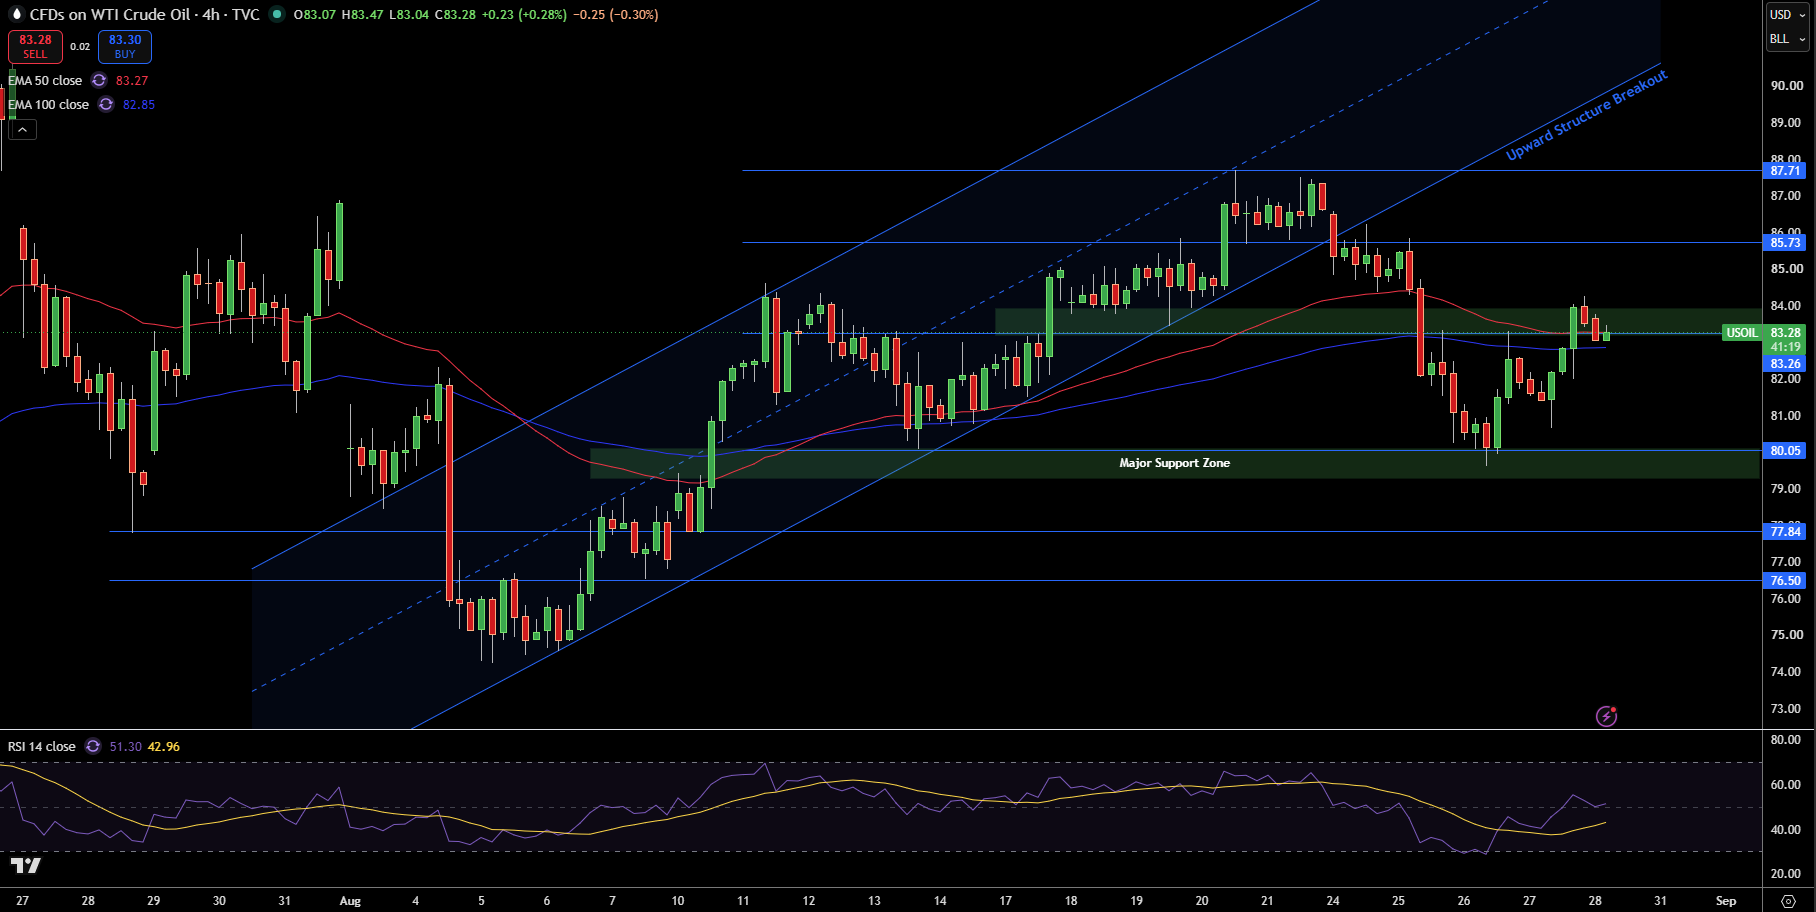
WTI crude oil is trading at approximately $83.28, after a significant bounce off of the $80.05 support zone. Price has also bounced above the 100-EMA located at $82.85. Price is now testing the 50-EMA at $83.27. Based on this price action, the $83.26 area is a key short-term price pivot. Although a previous rising channel has been broken, the price action demonstrates the support zone is of key interest to buyers, and thus the channel is still respected.
Momentum has finsihed neutral after a bounce from the oversold condition as the RSI has returned to the 51 level. Immediate resistance is at $83.26, $85.73, $87.71, and $80.05, $77.84, and $76.50 is support.
Technically, I believe a positive bounce has been created from the buyers at the support zone, however, the price action is not confirming a bounce. Price is still below $85.73. I believe as long as price stays above $83.26, then buyers should be able to push price to $85.73, however, if price is rejected from this area, we can expect price to drop to $80.05.
Brent Crude Oil Technical Analysis: Brent Rebounds From $84.89 but Faces EMA Resistance Near $88.50
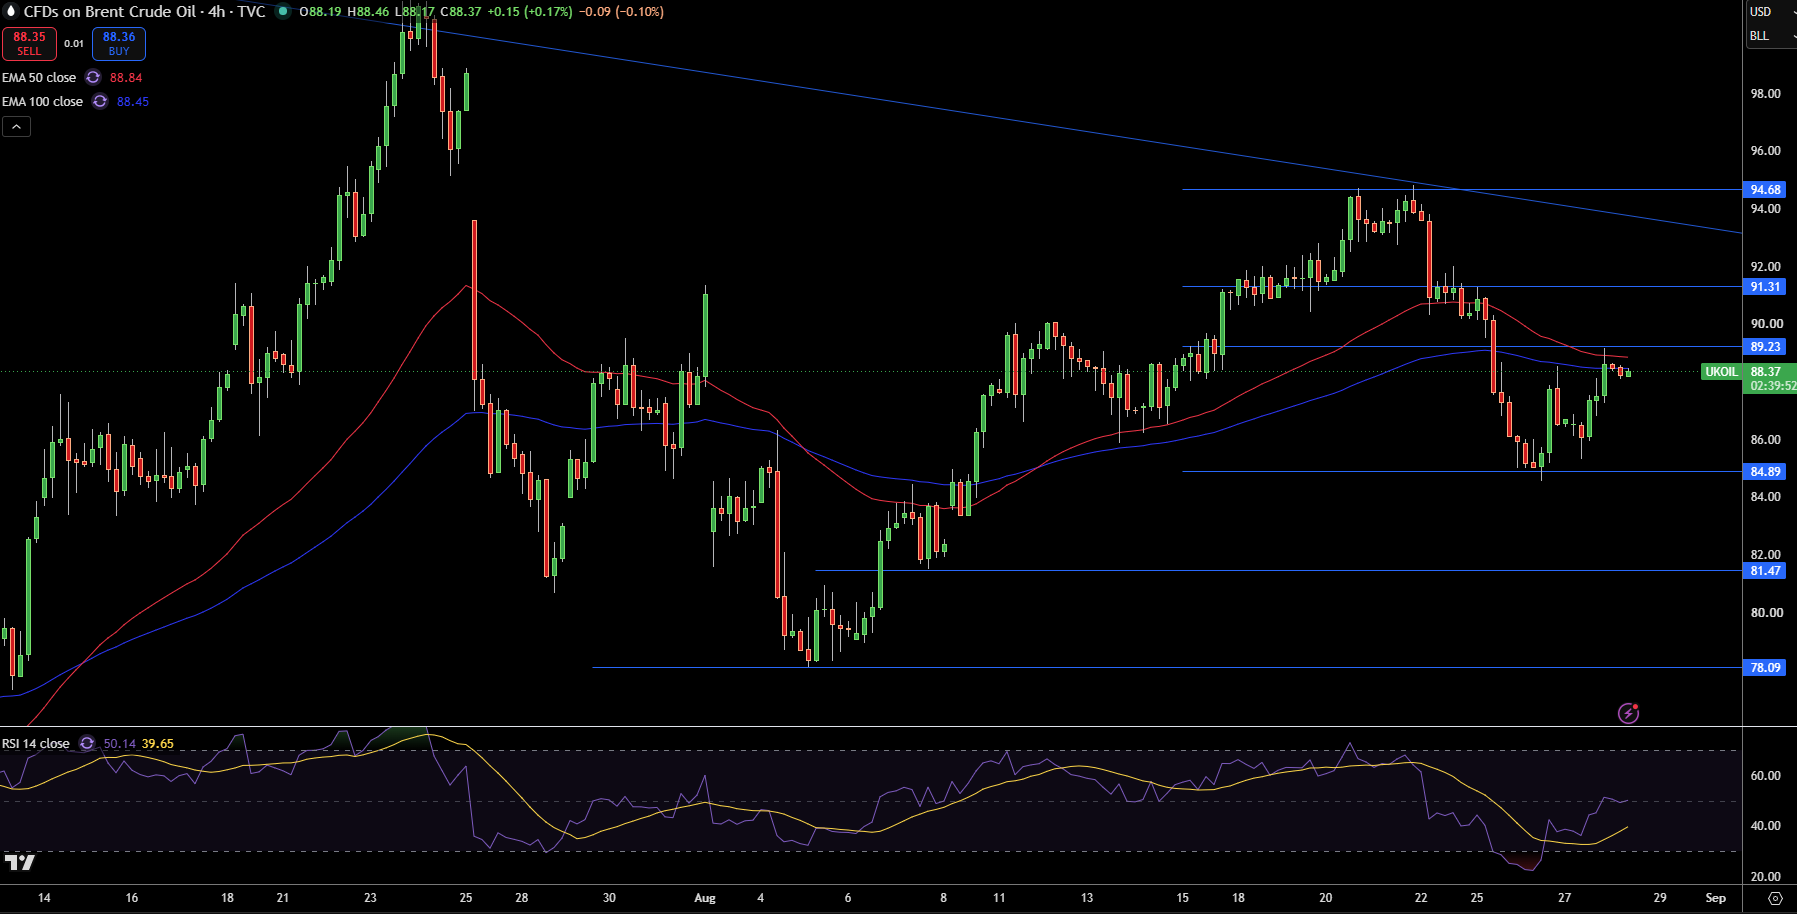
Brent crude is trading at approximately $88.37 after a bounce from the $84.89 support zone. Although the bounce is bullish and price has moved up, Brent is now testing an area of resistance as the 50-EMA is at $88.84, the 100-EMA is at $88.45, and the horizontal resistance is at $89.23. The resistance from the descending channel line is also present.
The RSI at 50 shows some normalizing of momentum after the previously noted oversold condition. The first resistance level is $88.45-$89.23, second is $91.31, and third is $94.68. The first support level is $84.89, second is $81.47, and third is $78.09.
I believe Brent is in the process of a recovering move, although a break of $89.23 is required for further upwards momentum. A failure to hold the break in the cluster of moving average towards $84.89 is likely, however, should there be a break, the shift in focus will be to $91.31.