
Oil News: Hormuz Talks Ease Supply Fears as U.S. Crude Stocks Rise
Oil markets are changing with talks between Iran and Oman over the Strait of Hormuz bringing promises that energy markets may improve. Iran and Oman have talks about cordoned navigation zones and clearing mines but there is still little to no movement. Kpler showed that on Tuesday only five cargo vessels crossed the Strait of Hormuz, on average 10 cargo vessels cross the Strait of Hormuz daily. Analysts said that sanctions and the U.S. blockade of Iran port activities mean that there is little to no movement of crude oil.
Risk to supply also increased after Iran blacklisted 45 vessels for violating Tehran’s rules. At least three Indian refiners and an international energy company are now avoiding blacklisted ships after threats of Tehran fines, detentions, and seizure of cargo. Restrictions may affect ship-to-ship transfers, a method used by Saudi Arabia and the UAE for export of Gulf crude.
U.S. oil fundamentals do not provide as much weight. The American Petroleum Institute said crude oil inventories increased by 4.2 million barrels.
Natural gas is in a similar position; strained globally but well supplied in the U.S. The EIA expects that LNG exports may touch 17.4 Bcf/d by the end of October, while natural gas production may increase to 111.2 Bcf/d.
Since the start of the war with Iran, global trade of LNG from Qatar has plummeted by 96%, with only 18 cargoes shipped compared to 509 a year before. U.S. LNG has made up for some of the loss caused by Qatar, but shipping routes to Europe are still at historically low levels for this time of year.
While the balance has improved slightly due to the Hormuz diplomacy for the 26th of August, physical shipping constraints, threats of Iranian enforcement, and the steep fall of Qatari LNG has left the global supply of energy vulnerable.

Natural Gas Technical Analysis: NG Tests Descending Trendline Near $2.80 as Buyers Attempt Breakout
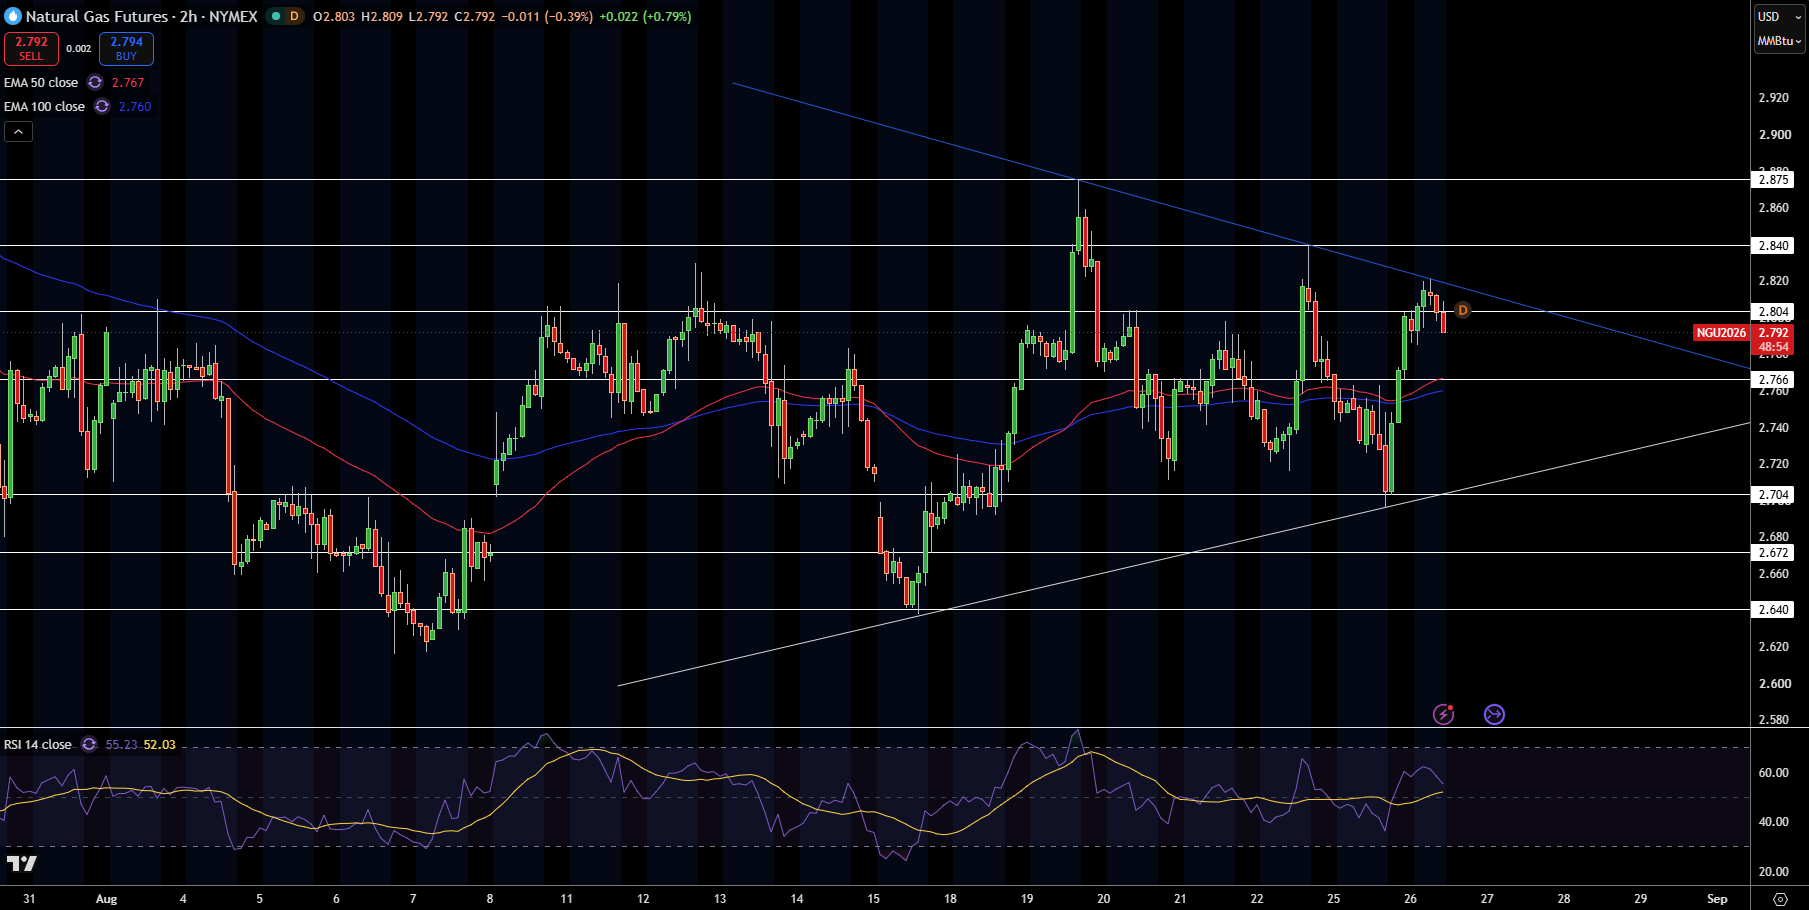
Natural Gas currently stands at $2.79 after a strong rebound from $2.70 on the 2 hour chart. Price currently stands to test a descending trendline at $2.80-$2.81. This is a key area for a potential breakout. Additionally,NatGas currently stands above the 50 EMA at $2.77 and the 100 EMA at $2.76. This means that Buyers v. Sellers is now in a neutral setup, as opposed to the earlier bearish setup. NatGas is currently trading in a bullish range.
RSI currently stands at 55, which shows a neutral, improving, bullish setup. Immediate Resistance is expected at $2.80-2.81, and extends to resistance at $2.84 and $2.88. For potential Support levels, $2.77 is expected, as is $2.70, $2.67 and $2.64.
In my view, natural gas is approaching a critical level. Should $2.81 break, then $2.84-$2.88 is expected to follow, while should $2.81 break, then $2.77 and $2.70 are expected to follow.
Natural Gas Price Forecast
Every new Natural Gas analysis as it publishes, today's technical signal and key levels, live price — on one page.
See all Natural Gas forecastsWTI Crude Oil Technical Analysis: WTI Breaks Below $80.82 as Selling Pressure Accelerates
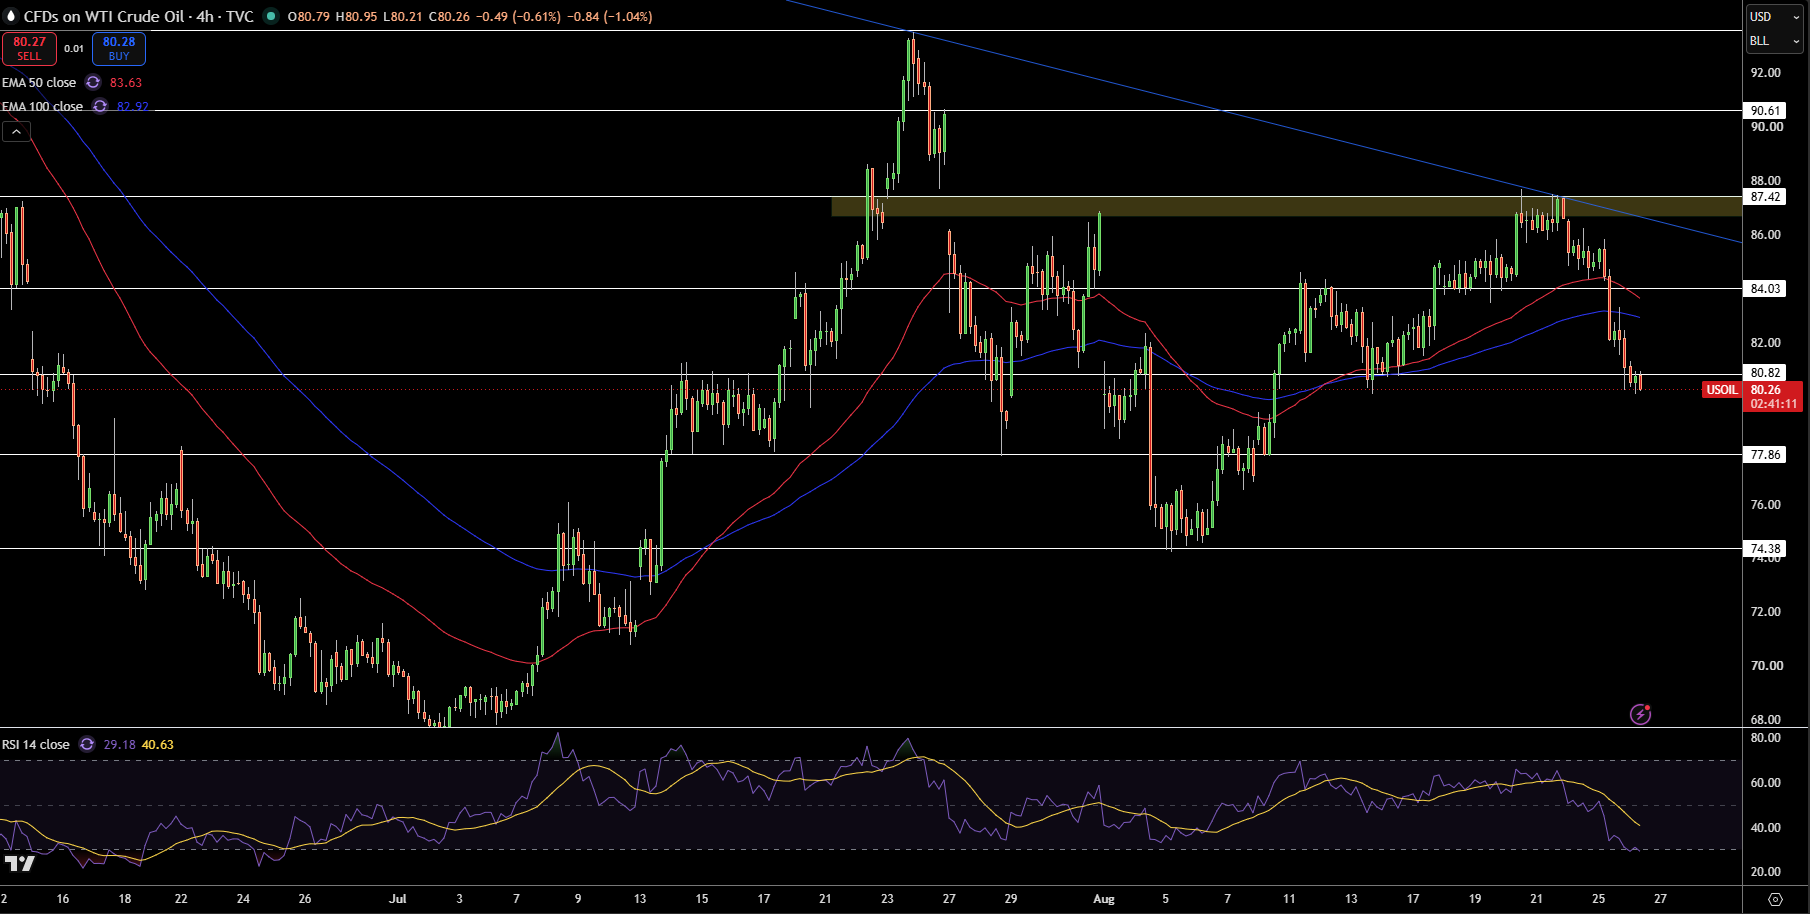
The sharp decline of WTI crude oil has now broken through the support level of $80.82, hitting a price of $80.26 on the 4-hour chart. WTI crude oil has also broken through the $87.42 resistance level. Selling pressure has accelerated as price has broken through the 50-EMA at $83.63 and the 100-EMA at $82.92.
The Relative Strength Index (RSI) of WTI crude oil has dropped to 29, indicating a sell signal and placing WTI in the oversold territory, which also indicates that price could rebound in the short-term. Immediate support for WTI crude oil is located at $77.86 and $74.38. Price resistance on the other hand, has been formed with the break of $80.82. Price has also formed resistance at $84.03, along with the EMA cluster at $82.92-$83.63.
Based on WTI’s current price action, I am bearish on the commodity while it is priced below $80.82. WTI crude oil will likely experience an oversold rebound, but for bulls to make any positive impact, they will need to break $82.92-$84.03. Continued selling pressure will place attention on $77.86.
Brent Crude Oil Technical Analysis: Brent Breaks Rising Trendline as $83.30 Comes Into Focus
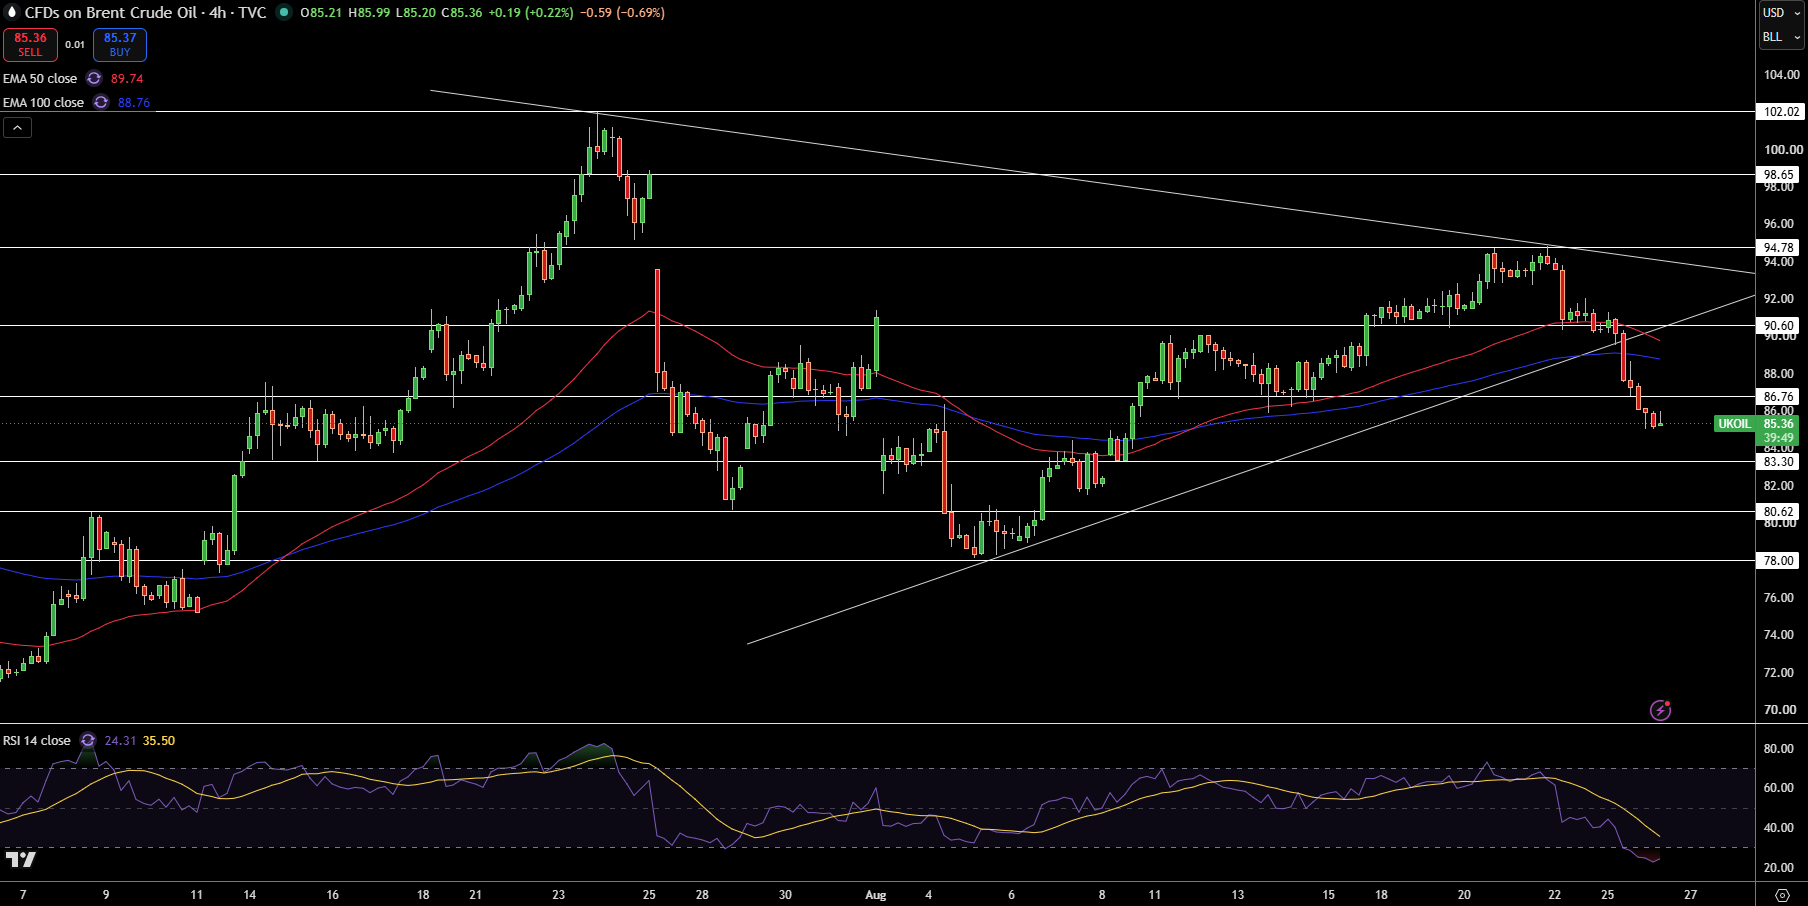
Brent crude oil, trading on the 4-hour chart, has breached the rising trendline and the support level at $86.76, hitting a value of $85.36. Selling has taken control over the short-term trend as price has also breached the 50-EMA at $89.74 and the 100-EMA at $88.76.
The rejection of the descending trendline at $94.78 has also resulted in a significant bearish reversal.
The RSI of Brent crude oil has also dropped to the oversold level at 29. This indicates a short-term buying opportunity. Price resisted at the $83.30 level, after which selling resumed. Below $83.30, price support is present at $80.90. Price resistance is present at the cluster of EMAs ranging from $82.92-$83.63 and at $84.03.
RSI is nearing 24, and, as such, Brent sits deep within oversold territory. This makes a corrective bounce increasingly plausible, however, momentum is clearly bearish at the moment. Immediate support comes in around $83.30, followed by $80.62 and $78.00. On the other hand, $86.76 is the first level of resistance, followed by $88.76 to $89.74 and $90.60.
For now, Brent remains bearish below $86.76. A small bounce to the upside may be likely due to RSI being extremely oversold, but a failure to regain the broken trendline would give support to $83.30. A breakdown below this level may decrease prices to $80.62.