Oil News: Iran Sanctions Continue to Tighten with Refined Fuels in Short Supply
The market focuses on Iran sanctions as primary and more visible refined fuels shortages, while the oil fundamentals on August 25 continue to develop. The U.S. has added more rigorous secondary sanctions as a means to pressure countries and companies to cut business with Iran or else be abandoned from any transactions involving the U.S. dollar. Chinese imports of Iranian crude oil have declined from 823,000 barrels per day (bpd) last month to 534,000 bpd this month, although Chinese independent refiners continue to purchase Iraqi crude.
The Strait of Hormuz remains the focal point of physical risk. Iran has implemented sanctions on 45 tankers for purported violations of new principles of passage and threatened to impose fines, detain vessels and seize cargo. Shipping companies avoid the passage, and unreliable tracking of vessels occurs as transponders are switched off. Another bullish signal was provided by Japan on August 25 when it stated it would not release national crude reserves in September or October, thereby reducing one source of emergency supply.
The larger concern is shortages of refined products rather than crude. For the entire month of May, imports of diesel, jet fuel, and gasoline were 21% less than before the war. Due to limited crude distillation capacity in the Middle East and weak refining in Russia, global diesel supplies are restricted.
opinions on natural gas fundamentals are firmly split. Coupled with high storage levels (expected to reach a record high of 3.985 Tcf by the end of October), increased U.S. dry-gas production is expected to average 111.2 Bcf/d in 2026. International markets are expected to remain tight as evidenced by the Hormuz disruption that has impacted Qatar’s supply and increased competition for U.S. oil cargoes. The global oil products and LNG market will continue to be tight due to sanctions and shipping constraints.
Without a doubt, the U.S. gas supply remains abundant when compared to the tightening global oil products and LNG markets as sanctions and shipping risks remain, disrupted normal trade flows.

Natural Gas Technical Analysis: NG Holds Rising Trendline Near $2.74 but Momentum Remains Weak
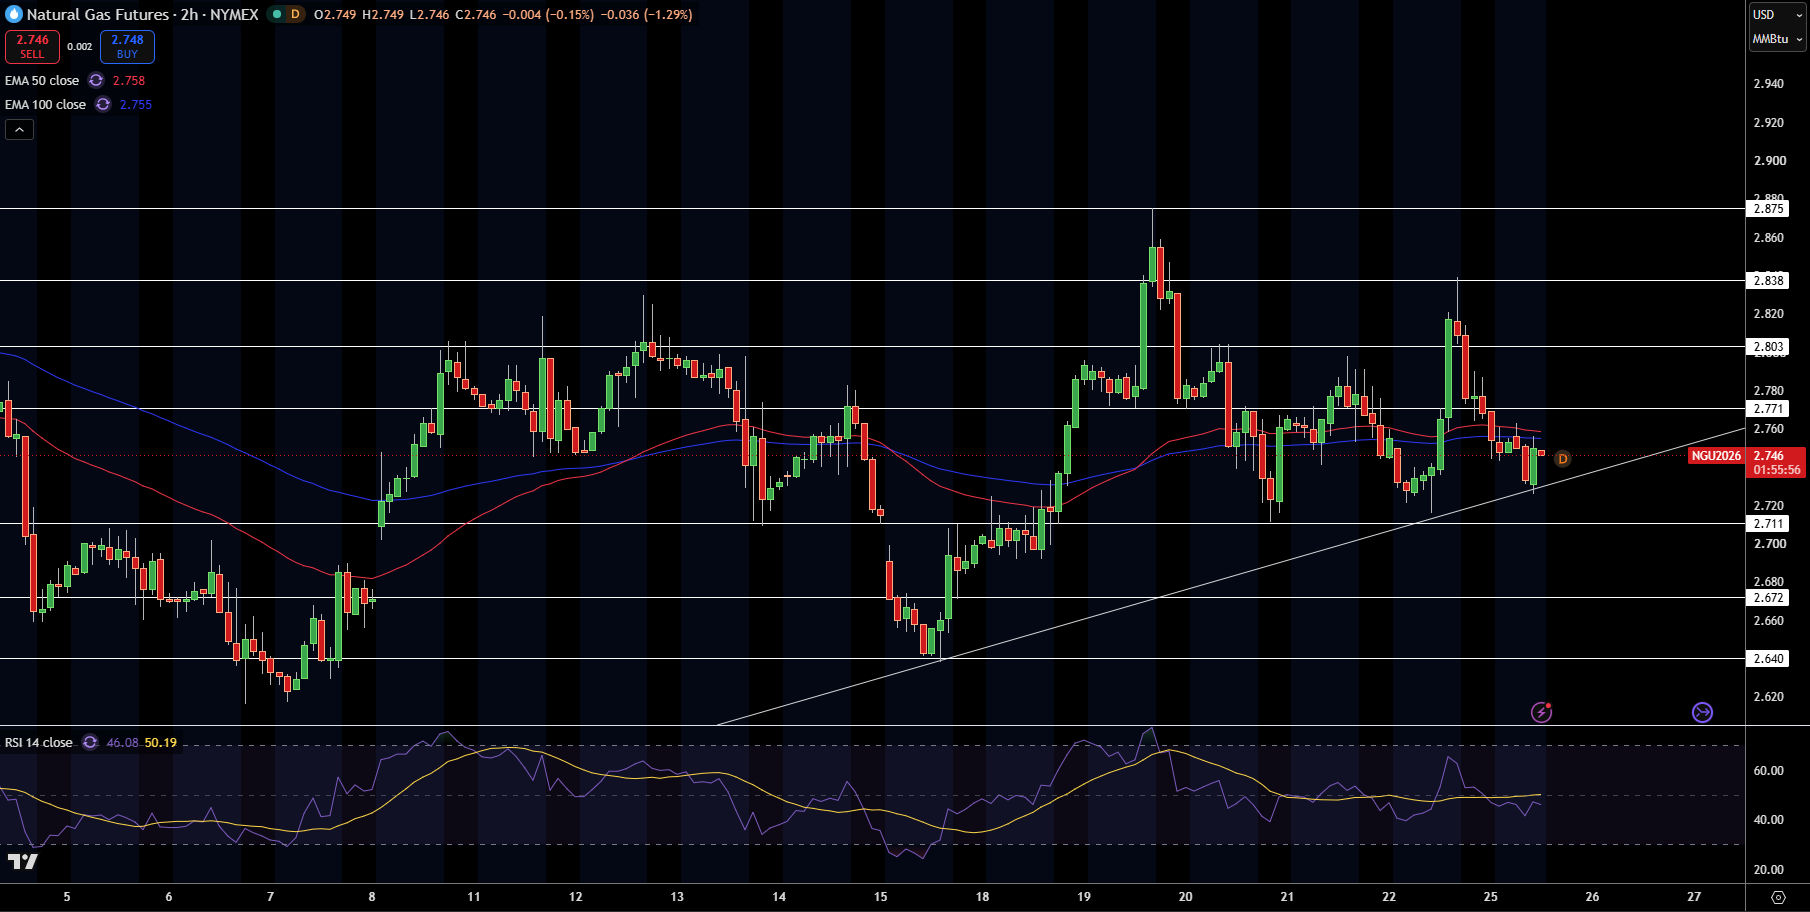
Currently trading at around $2.75, natural gas holds support from a rising trendline on the 2-hour chart at the lows of mid-August. Natural gas trades below a flat 50 and 100 EMA both at $2.76. Natural gas holds a neutral to slightly bearish trend for the time being. Sellers have prevailed after the price rejection from the higher levels of $2.84 to $2.88 by forming lower highs.
RSI is at 46, indicating a lack of momentum, but not oversold. Natural gas faces resistance at $2.77. Higher levels of resistance at $2.80, $2.84, and $2.88 await. Natural gas holds support at $2.71, $2.67, and $2.64 if price breaks lower.
In my opinion, trading within a rising trendline at $2.74 places natural gas at a technical decision point. A break below $2.71 will invalidate the rising trendline and increase the risk of a move to $2.67 and $2.64.
Natural Gas Price Forecast
Every new Natural Gas analysis as it publishes, today's technical signal and key levels, live price — on one page.
See all Natural Gas forecastsWTI Crude Oil Technical Analysis: WTI Stalls Below $87.42 as Double-Top Resistance Holds
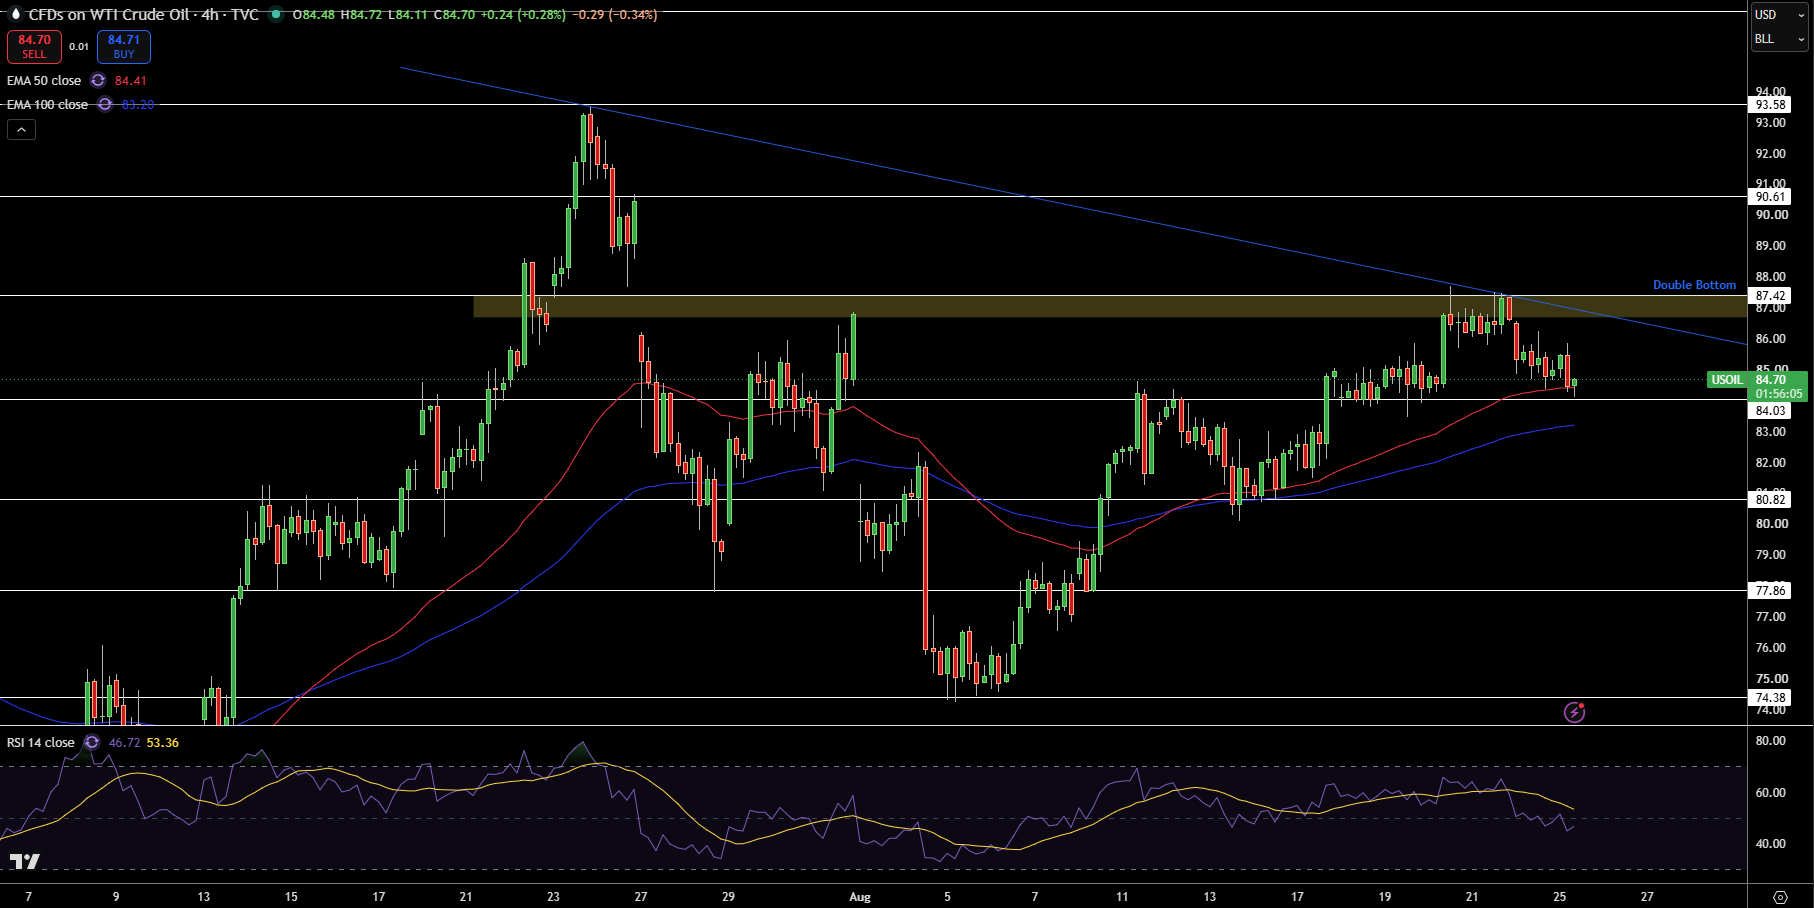
From the WTI Crude Oil Technical Analysis article, WTI Crude has rejected the $87.42 resistance, creating a double-top formation, which includes a descending trendline and a top and bottom. Price has built support around a price of $84 near the 50 period EMA and the 100 period EMA around a price of $83.20. The upward price action has not completely broken.
The momentum of the price action has stalled. The RSI is neutral. Immediate support has been built around $84, with more support around $80.82 and $77.86. The resistance remains at $87.42, with greater resistance at $90.61 and $93.58.
In my opinion, WTI Crude is slightly bearish and range bound. The price is range bound and bearish until it breaks $87.42. Once it breaks and is sustained, the price action will be bullish. The price action is potentially bearish if the price is sustained below $84.03 and will move towards $80.82.
Brent Crude Oil Technical Analysis: Brent Tests $90.60 Support as Triangle Compression Tightens
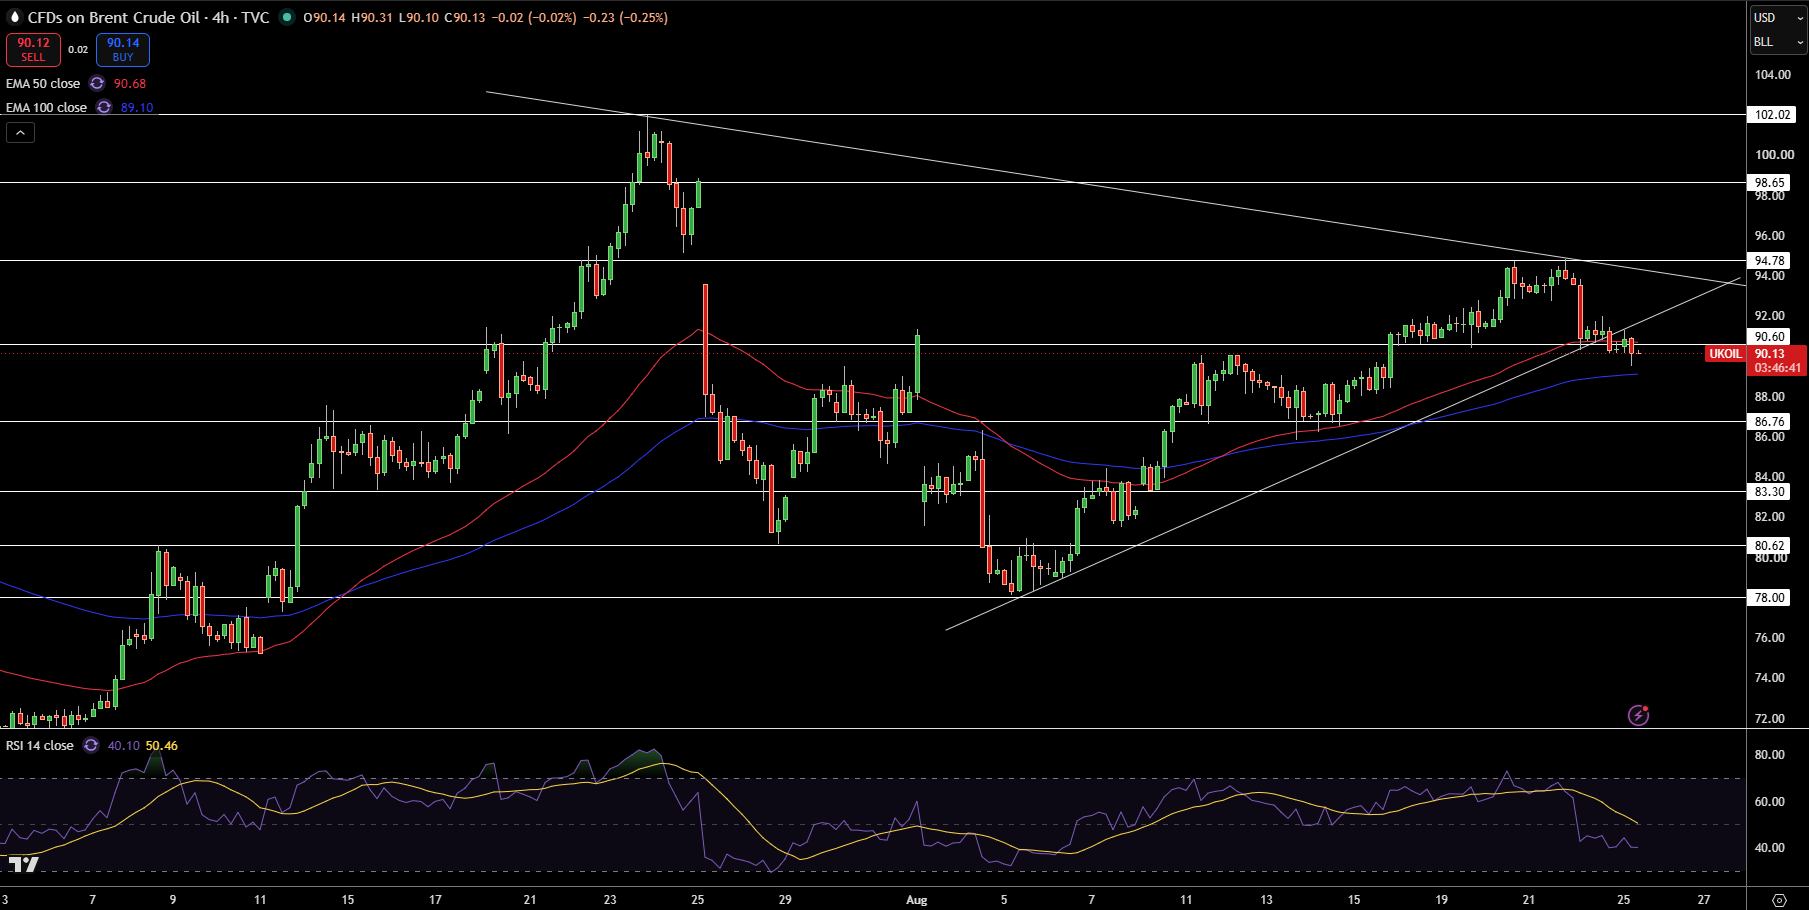
From the Brent Crude Oil Technical Analysis article, the price of Brent Crude is at $90.13 after rejecting the $94.78 resistance. The price is testing the lower boundary of the converging triangle around $90.00-$90.60. Price is also at the 50 period EMA around $90.68 and the 100 period EMA around $89.10. The $89.10 and $90.68 price action ranges will dictate the next move.
With the RSI at approximately 40, we see the current short-term control of the market by the sellers, while buying pressure has weakened. Levels of resistance are at $90.60, $94.78, $98.65, and $102.02, while levels of support are at $89.10, $86.76, $83.30,$ and $80.62.
I think that Brent is still weak as long as trades are below $90.60-$90.70. Breaking the $89.10 support level and the rising trendline would push the price close to $86.76. However, if the price moves back above $94.78, the bullish trend would continue.