
Market Overview
WTI crude slipped to $61.51 per barrel, logging a second straight loss as markets reacted to ongoing geopolitical tensions and supply concerns. Uncertainty around U.S.-China trade progress continues to pressure sentiment, heightening fears of a broader economic slowdown that could curb global energy demand.
Meanwhile, OPEC+ is expected to propose further output hikes during its upcoming May 5 meeting, adding to supply-side headwinds.
Traders are also monitoring U.S.-Iran nuclear talks, which, if resolved, may pave the way for increased Iranian exports. Collectively, these developments are clouding the short-term outlook for both oil and natural gas markets.

Natural Gas Price Forecast

Natural Gas Futures surged to $3.335, breaking decisively above the descending channel that defined price action since mid-April. The breakout was confirmed by a sharp rally through both the 50 EMA at $3.222 and the former resistance zone at $3.316, now acting as immediate support.
This bullish move ends a prolonged downtrend and opens the path toward the next resistance targets at $3.465, $3.556, and $3.665. However, the 200 EMA at $3.486 looms as a significant technical hurdle.
Momentum remains strong in the near term, but bulls will need to defend $3.316 on any pullback to confirm the breakout’s sustainability. As supply headlines and inventory data approach, volatility could increase—watch for follow-through above $3.465 to confirm trend reversal.
WTI Oil Price Forecast

WTI Crude Oil is under renewed pressure, trading at $61.51 after breaking below its ascending trendline and short-term support at $62.04. The recent close beneath both the 50 EMA ($62.49) and the 200 EMA ($63.15) underscores a bearish shift in momentum.
Natural Gas Price Forecast
Every new Natural Gas analysis as it publishes, today's technical signal and key levels, live price — on one page.
See all Natural Gas forecastsThe breakdown leaves oil vulnerable to further declines, with key support levels seen at $60.51, $59.63, and $58.77.
On the upside, any recovery faces resistance at the prior support level of $62.04, followed by the $63.48–$64.83 region. The price structure now suggests a short-term trend reversal unless bulls reclaim $62.04 with conviction.
Brent Oil Price Forecast
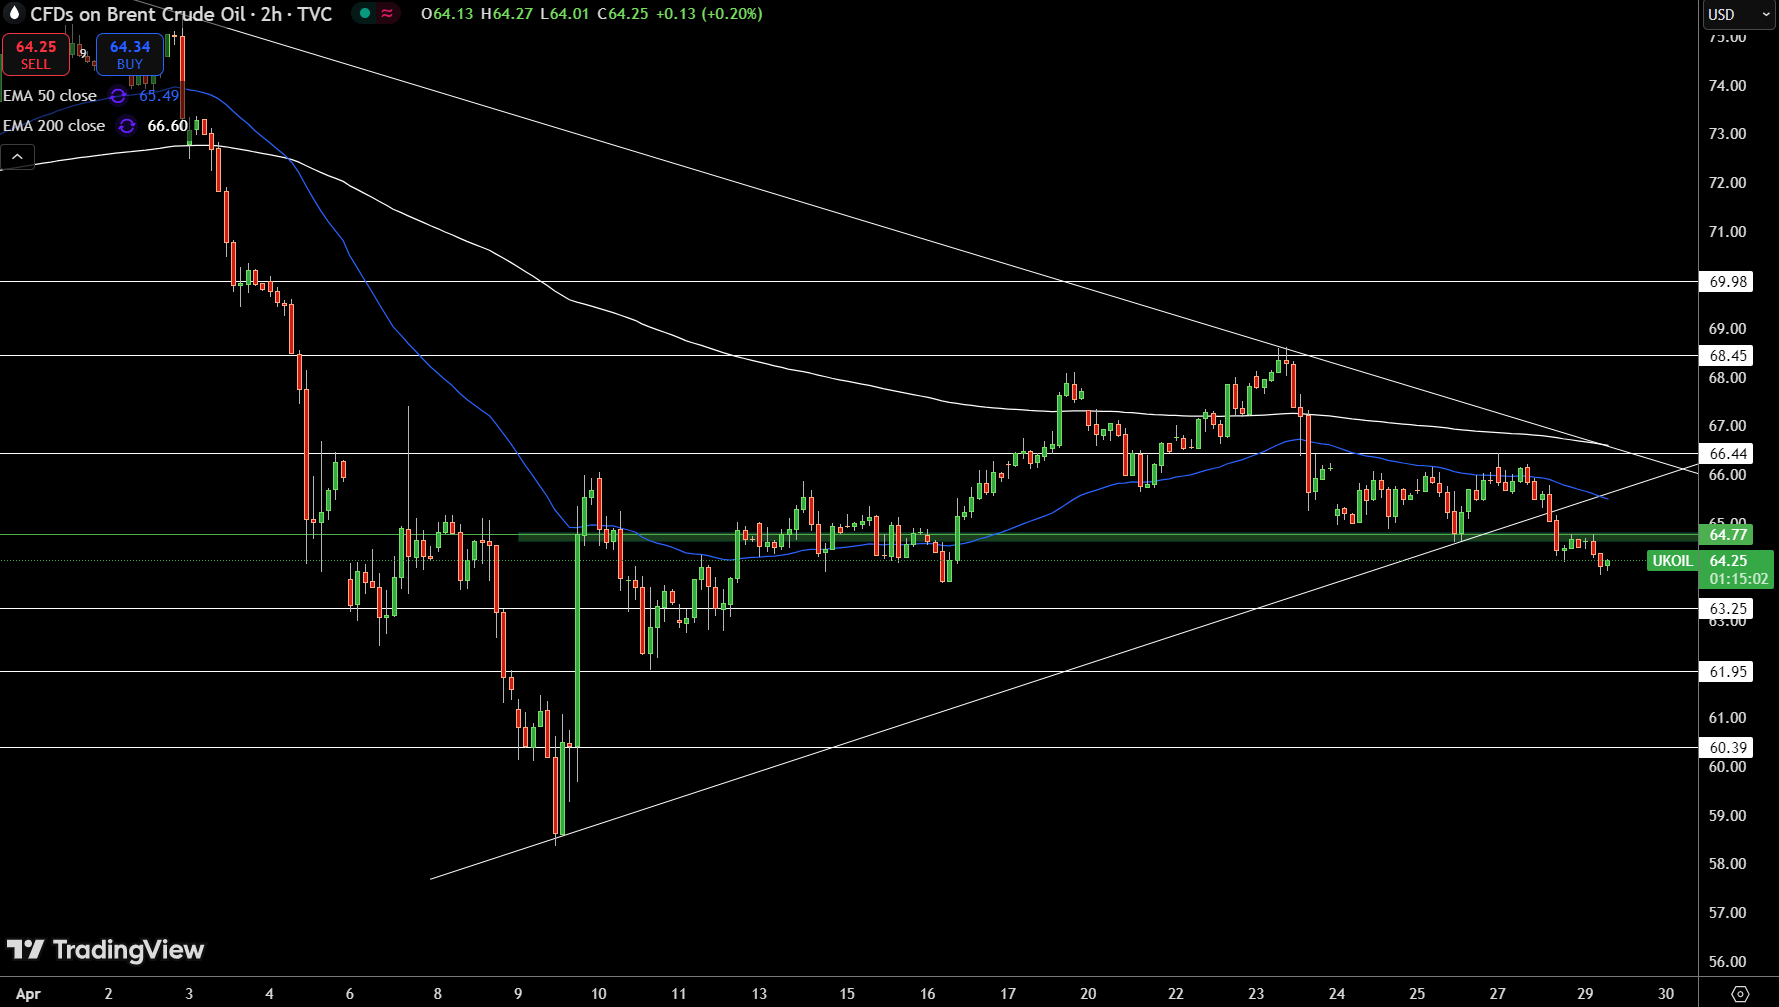
Brent Crude is trading at $64.25, losing grip on the key $64.77 support zone, now turned resistance. This decline places oil below both the 50 EMA ($65.49) and 200 EMA ($66.60), highlighting a deteriorating technical structure.
The recent breakdown of the ascending trendline confirms short-term bearish pressure.
Downside targets to monitor include $63.25, followed by $61.95. A sustained break below these could trigger deeper losses toward $60.39. On the flip side, Brent would need to reclaim $64.77, and ultimately $66.44, to stabilize the trend.