
Market Overview
Crude prices tumbled to four-year lows this week as rising geopolitical tensions and tariff-driven demand fears overshadowed supply fundamentals. Brent’s six-month spread collapsed 86% from January highs to just $0.79, signaling a looming surplus.
Brent and WTI have each fallen for five straight sessions, pressured by concerns that global trade disruptions could slow economic activity and energy consumption. OPEC+’s decision to boost May output by 411,000 bpd has added to the bearish tone.
Goldman Sachs now sees Brent and WTI falling to $62 and $58 by year-end. Meanwhile, U.S. crude stockpiles unexpectedly dropped 1.1 million barrels last week, offering modest support.

Natural Gas Price Forecast
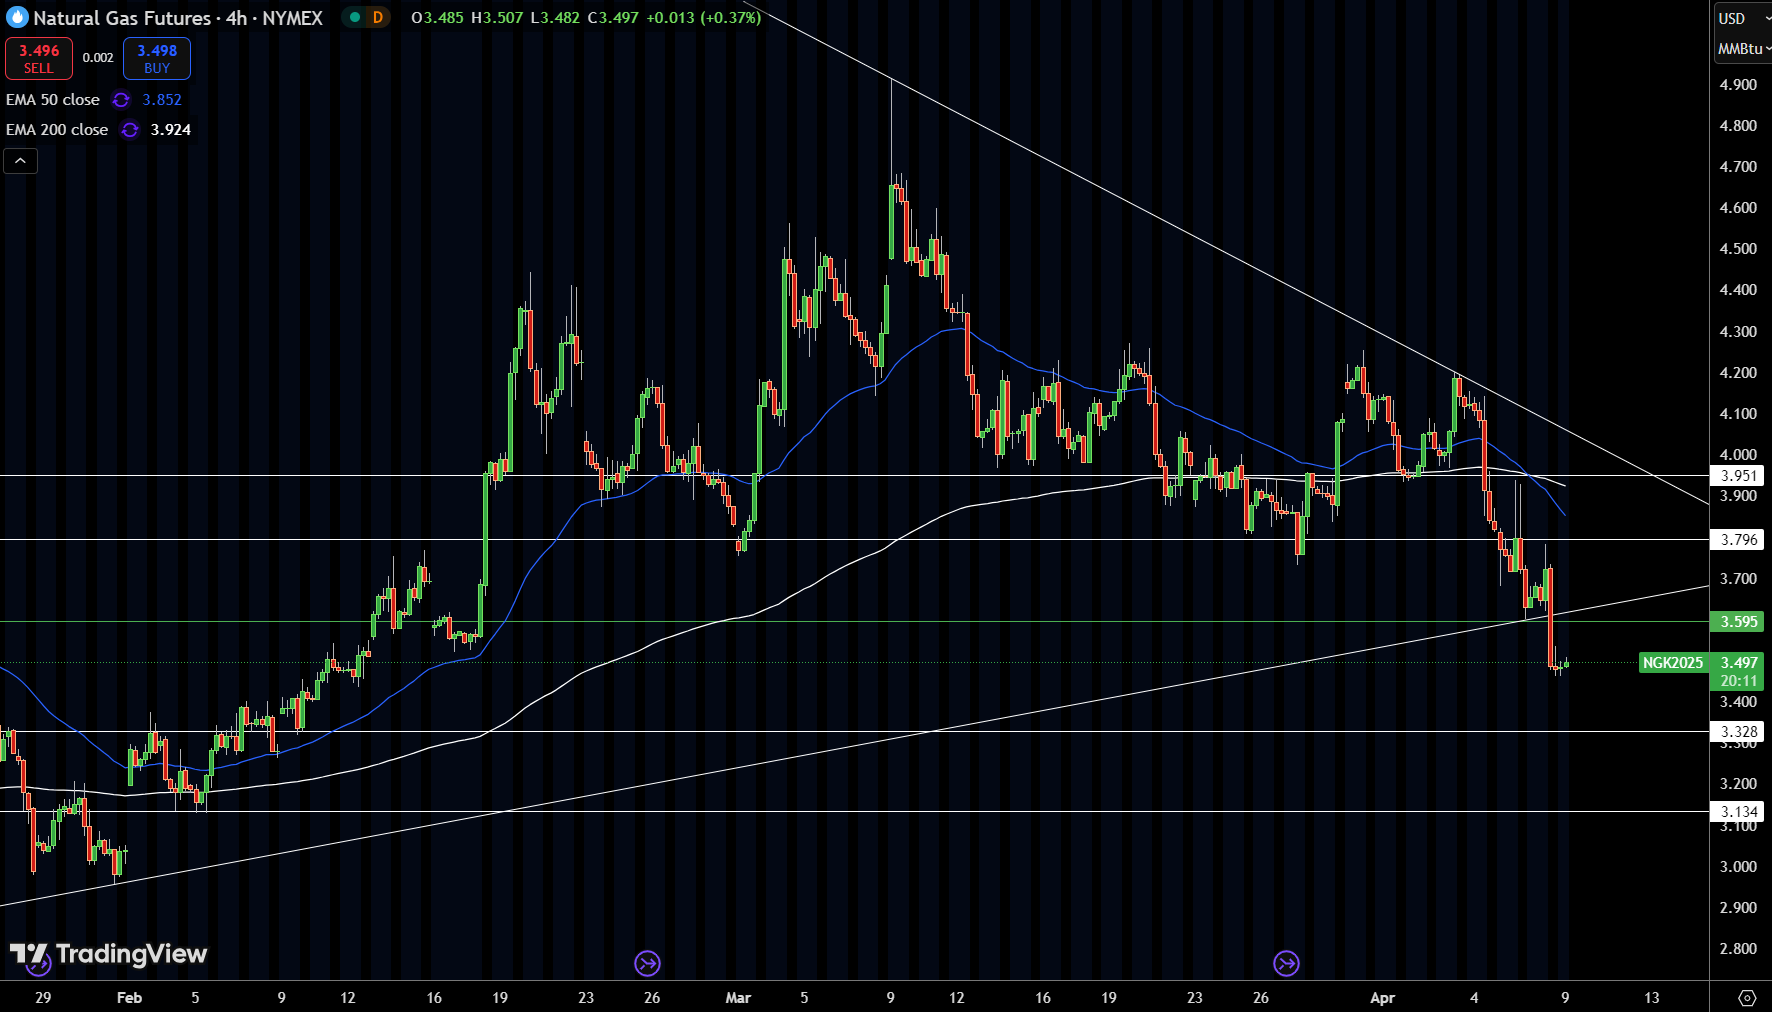
Natural gas is trading at $3.497 after briefly dipping to test the ascending trendline support near $3.40. Price action shows a sharp bounce off that level, with bulls now eyeing a retest of the $3.595 pivot point.
Immediate resistance stands at $3.796, followed by the downtrend line near $3.951. On the downside, $3.40 remains a critical support zone, with the next major floor sitting at $3.328.
The 50 EMA at $3.852 and 200 EMA at $3.924 hover well above the current price, reinforcing the bearish medium-term structure.
RSI is recovering from oversold levels, hinting at possible short-term relief. A close above $3.595 could shift momentum upward, but the broader downtrend is still intact.
Natural Gas Price Forecast
Every new Natural Gas analysis as it publishes, today's technical signal and key levels, live price — on one page.
See all Natural Gas forecastsWTI Oil Price Forecast
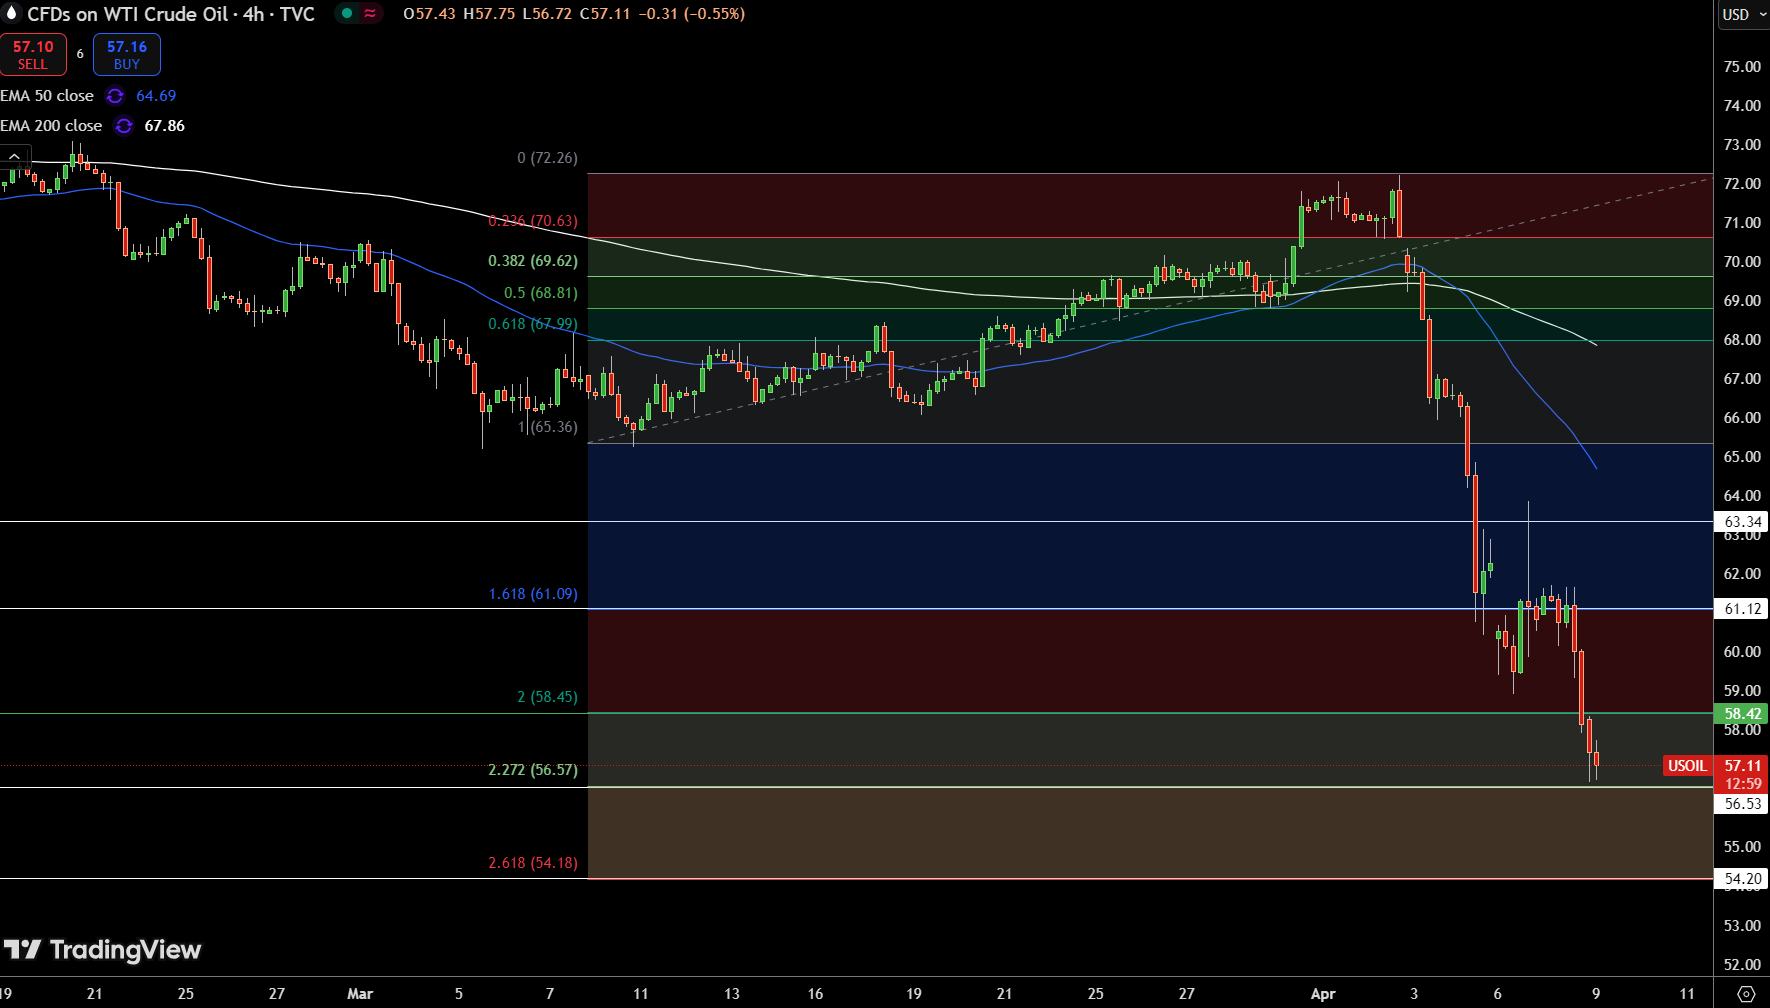
WTI crude is hanging around $57.11, deep in correction mode after breaking through major support levels. The pivot point sits at $58.45 (green line), which now acts as immediate resistance.
If buyers manage to reclaim that, the next upside levels to watch are $61.12 and $63.34. On the downside, immediate support rests at $56.57, with a potential slide toward $54.18 if pressure persists.
The 50 EMA is at $64.69, and the 200 EMA is up at $67.86—both well above current price, signaling that sellers still dominate the trend. With no clear reversal signal and the RSI hovering near oversold at 21, the market may be due a technical bounce, but downside risks remain firmly in play.
Brent Oil Price Forecast
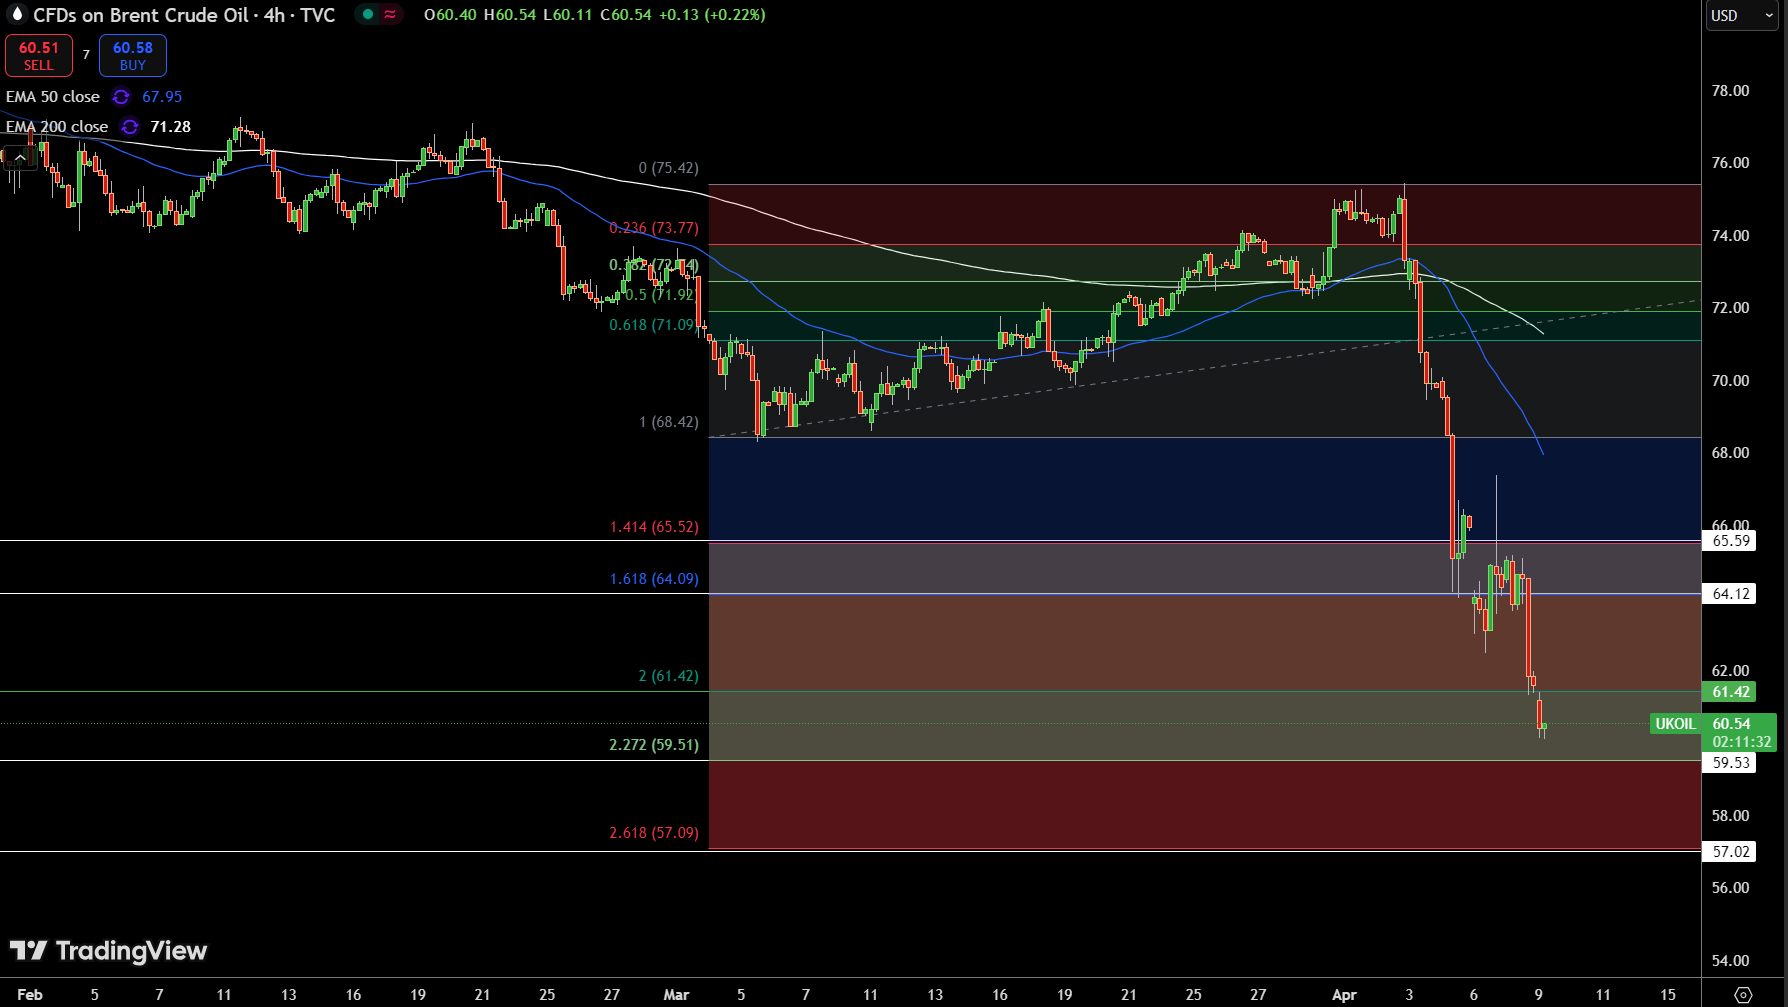
Brent crude is trading at $60.54 after slipping below its key pivot point at $61.42. The selloff intensified after failing to hold support at $64.12, exposing the next downside levels at $59.51 and potentially $57.09. Immediate resistance is now seen at $61.42, with stronger resistance at $64.12 and $65.59 above that.
Technically, the 50 EMA at $67.95 and the 200 EMA at $71.28 continue to loom overhead, reinforcing the broader bearish structure. Despite a small intraday bounce, momentum remains pressured as long as Brent stays beneath $61.42.
The RSI is deeply in bearish territory, indicating potential exhaustion, but there’s no confirmation of a reversal just yet. Expect volatility if prices test $59.50 again.