
Oil News: Iran Sanctions Tighten Supply as LNG Demand Faces a Price Test
The Strait of Hormuz and increased pressure by the U.S. on Iran are still dominate factors in oil markets as of August 24. Since the sanctions of the 1980s, the newest sanctions being pursued by Washington- and according to Scott Bessent, Treasury Secretary- will be the most aggressive yet, in a campaign to target countries and companies that purchase crude from Iran. Iran has already begun to limit the amount of crude offered to China, and inventories of crude oil and oil on water have also begun to drop as Middle East exports stay restricted.
Outside of the Persian Gulf, the supply net is tightening. The International Energy Affairs (IEA) predicts a drop of 4.3 million bpd in global supply by 2026, with Gulf exports still some 8.3 million bpd below levels that existed before the war in 2022. Stocks around the world declined by another 69 million barrels in July, bringing the total to some 410 million below levels that were present at the start of the war. While supplies may be tightening, so will demand with the IEA predicting a slowing of global oil demand by 1.6 million bpd.
LNG supplies tell a different story. By July, the U.S. had already exported some 73 million tons, a 23% increase over supplies in the previous year. As many buyers replenished supplies that had been emptied by the Qatar blockade, LNG prices on both sides of the Atlantic had begun to climb higher, to above $22 per MMBtu, sparking demand destruction.
Domestically, the U.S. gas supply is still strong. EIA data show working gas in storage at 3,169 Bcf, which is an increase from last weeks 3,153 Bcf, and continues to be above seasonal expectations.
For August 24, the energy backdrop is rather interesting. The sanctions and potential disruptions in the Strait of Hormuz have put pressure on global oil and LNG supply. There is also weak growth in oil demand which has resulted in higher prices of LNG and potential threats to its consumption.

Natural Gas Technical Analysis: NG Breaks Rising Trendline as $2.71 Support Comes Under Pressure
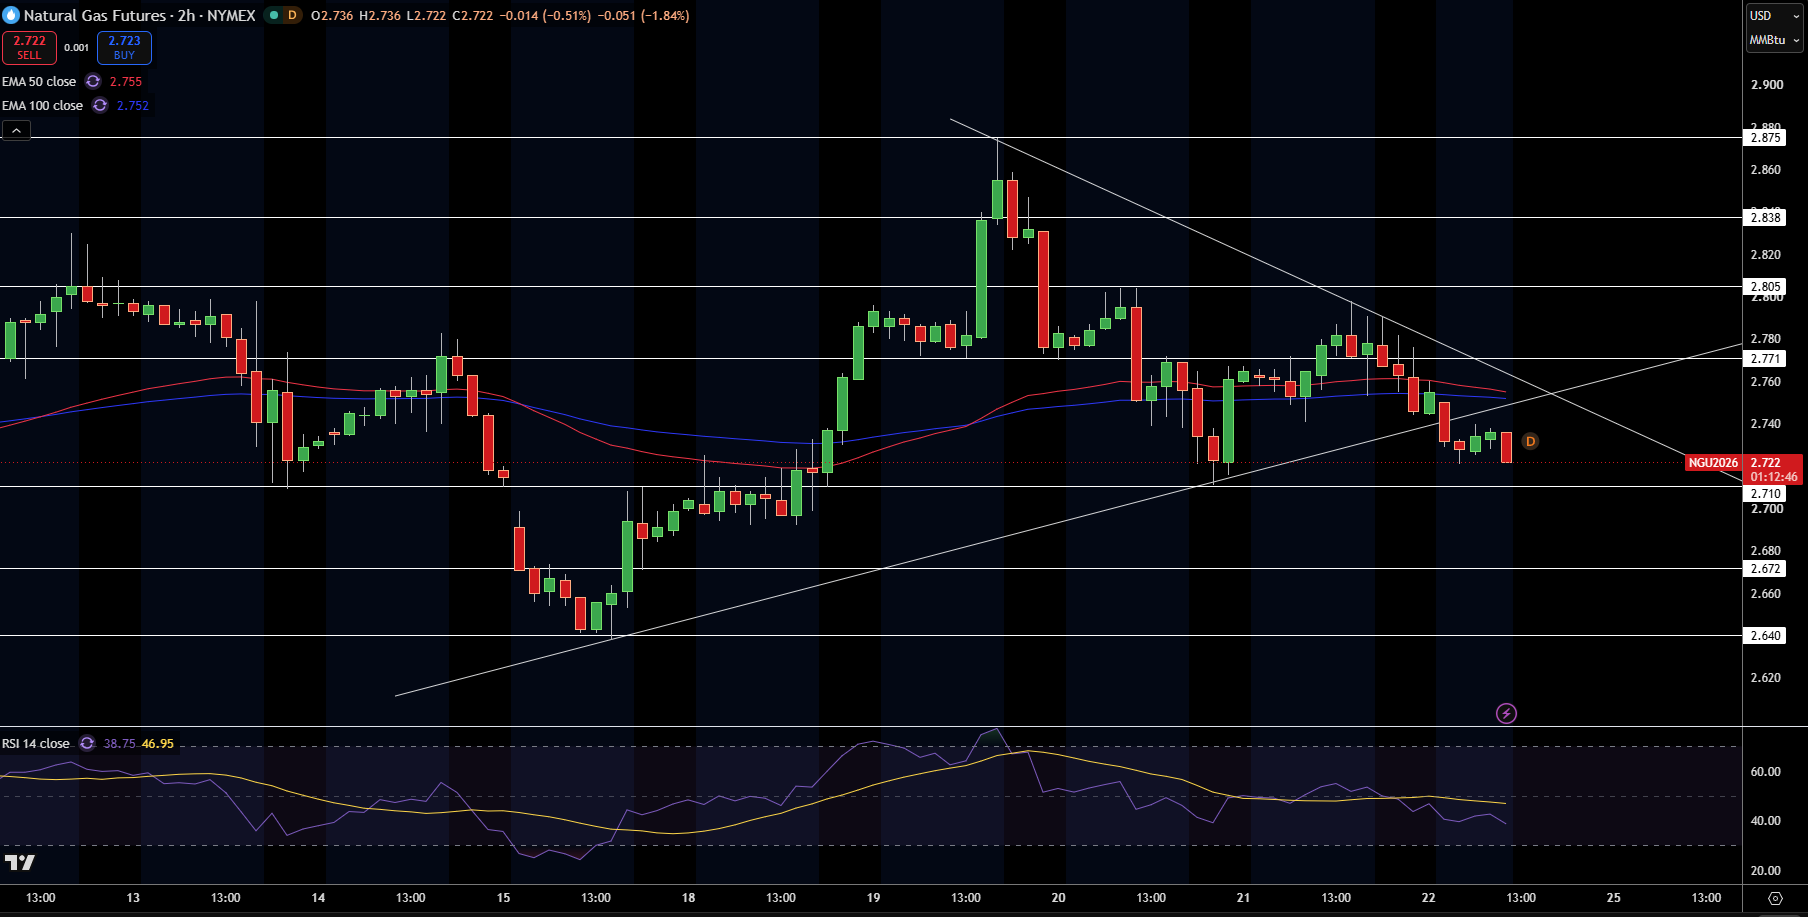
Natural gas is trading for $2.72 on the 2 hour chart, after trading beneath the rising trendline that supported the upside recovery. Price is also beneath the 50 EMA at $2.76 and the 100 EMA at $2.75 and puts continued pressure on the short term outlook. The market has formed lower highs beneath the downward trending line, with the most recent candlesticks testing the support zone $2.71.
RSI is at 39, confirming little upside momentum, but is not yet in over sold territory. Resistance is expected to be in the range 2.75-$2.77, with resistance expected to be in the range of $2.81, $2.84 and $2.88. Support is in the range of $2.71-$2.67, and extends to $2.64.
Based on my analysis of the market, natural gas will likely continue to move lower as long as it trades beneath $2.75-$2.77. A fall beneath $2.71 will likely cause further support to be provided at $2.67 and $2.64. To start to create a rally and help improve the outlook, the $2.77 price zone must be reclaimed by the bulls.
Natural Gas Price Forecast
Every new Natural Gas analysis as it publishes, today's technical signal and key levels, live price — on one page.
See all Natural Gas forecastsWTI Crude Oil Technical Analysis: WTI Rejected Near $87.42 as Double-Top Risk Builds
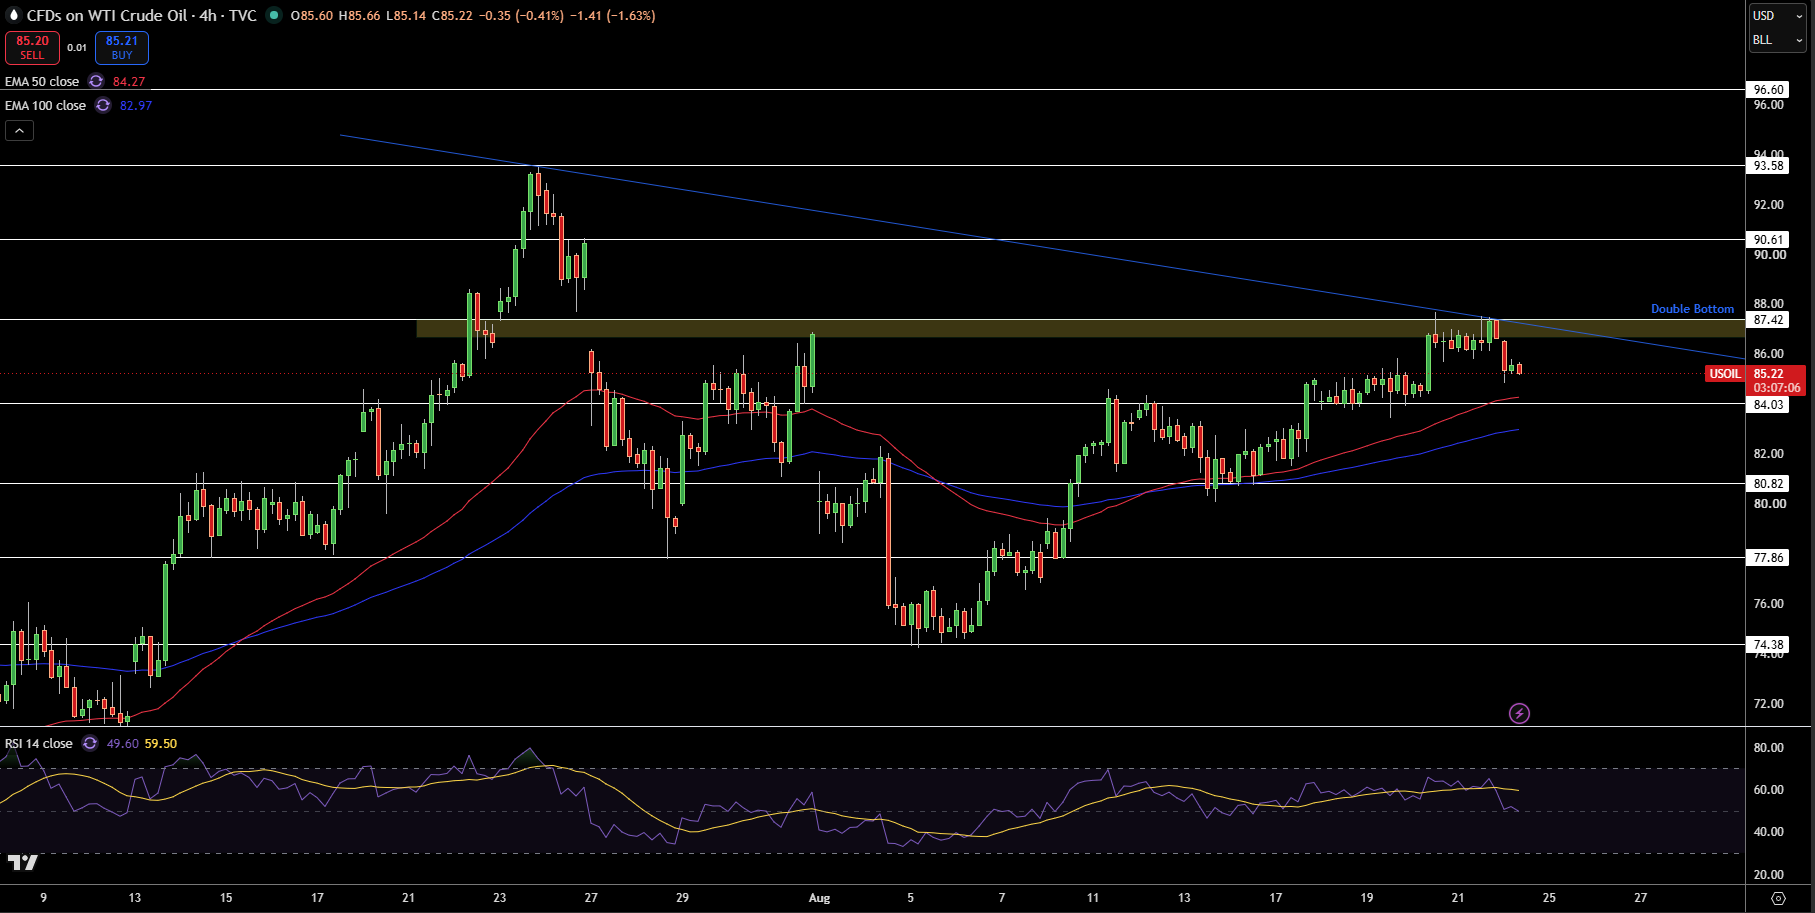
Currently trading at $85.22, WTI crude oil started forming a resistance level at $87.42, where it also intersects with a downward trending line. WTI crude oil was unable to break above this resistance level and has been rejected. For now, WTI crude oil remains above both the 50 Exponential Moving Average (EMA) at $84.27 and the 100 EMA at $82.97, so the overall upward trend still holds. However, the repeated failures near $87.42 increase the chances for a double top pattern.
The relative strength index (RSI) is at 50, signaling sideways movement of the crude oil price. Immediate support for WTI crude oil sits at $84.03. Below that, support is in the zone between $80.82 and $77.86. Above $87.42, resistance is located at $90.61 and $93.58.
WTI crude oil remains bullish as long as it hovers above $84.03, but a clear break of that support zone invalidates the bullish pattern and exposes the $80.82 support zone.
Brent Crude Oil Technical Analysis: Brent Tests Rising Support After Rejection From $94.78
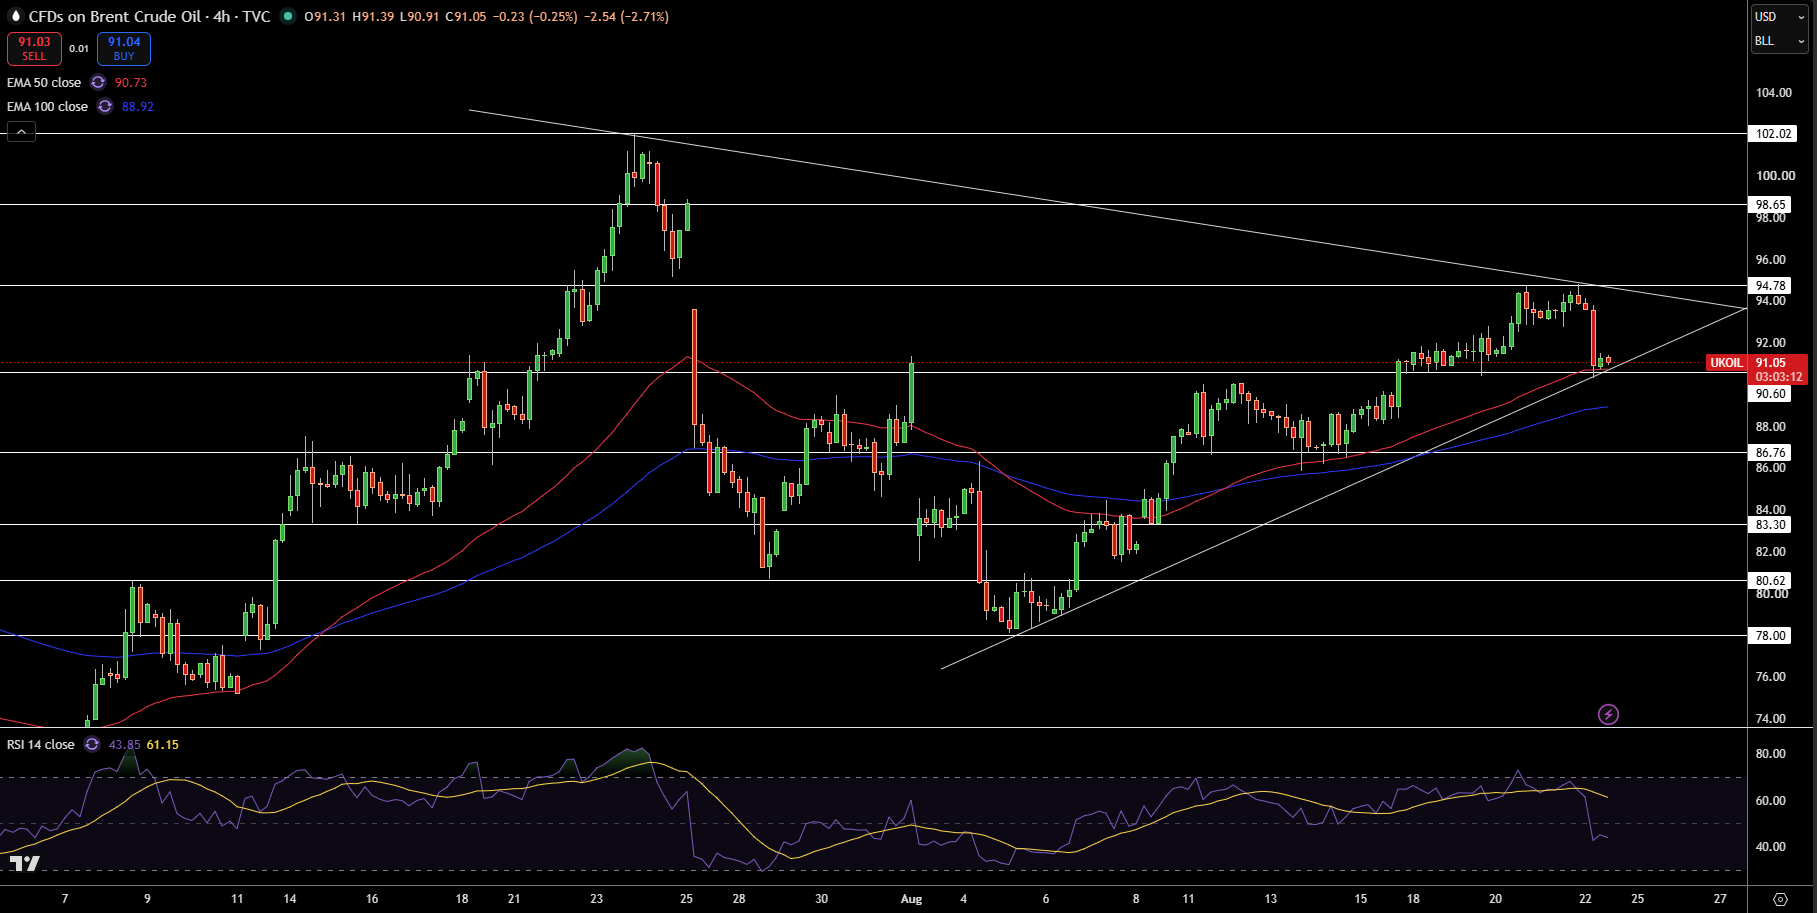
Currently trading at $91.05, Brent crude oil was rejected at the resistance level of $94.78 and is currently testing the rising support level of $90.60 to $91.00. Additionally, Brent crude oil is trading above both the 50 EMA at $90.73 and the 100 EMA at $88.92, so the upward trend does hold. The overall recovery will be invalid if the support levels turn to resistance.
Brent crude oil is trading in a sideways pattern, forming a support level at $90.60 to $91.00. Immediate support is located at $90.73 and $88.92, while resistance is at the level of $94.78 and $97.84.
RSI has dipped to 44, indicating bullish momentum has considerably weakened. Current resistance sits at $94.78, $98.65, and $102.02. On the other hand, $90.60, $86.76, $83.30, $80.62, would act as support.
In this view, Brent is cautiously bullish above the rising trendline, the support at $90.60, and the break of which would shift the short-term bias to bullish and potentially target $86.76.