



Oil News: Hormuz Shipping Slows as Demand Outlook Weakens
As oil fundamentals on Aug. 17 balance against worsening supply risks in the Middle East and a deteriorating outlook for worldwide demand, there has been little forward movement in U.S.-Iran talks and a sharp slowing of traffic through the Strait of Hormuz during the weekend. According to Reuters, Kpler data indicated just five vessels crossed the straight on Saturday and none the following day, as compared to 31 the weekend prior. Iran is still refusing to engage in talks with Washington and the UAE reported another attack against an ADNOC associated tanker. These events have elevated the disruption risk for both U.S. crude and Brent associated supplies.
For now demand fills the void. The IEA predicts a drop in global oil demand of 1.6 million barrels a day in 2026 and a 2.8 million barrel a day drop in 2026 in comparison to 2025. The IEA attributes the drop to high prices and disruptions related to the Hormuz supply chain. OPEC on a more optimistic note has adjusted its 2026 outlook for demand but for the fourth time in a row is projecting a 580,000 b/d growth in demand.
Natural gas fundamentals also look more comfortable in the U.S. In the latest storage report, there was a 36 Bcf injection (with expectations for and a surplus above the 5-year mean of 198 Bcf) even though the demand for electricity was high due to the summer.
Global LNG supply is even tighter than before. Petronet in India lost at least 56 cargo supply due to Qatar’s force majeure. September supply is already unclear. Before, the Strait of Hormuz only carried a fifth of total LNG trade. This made Asian buyers go after U.S., Omani, Nigerian, and Angolan supplies.
The situation is extremely clear in the energy market for August 17. Disruptions to Hormuz reduce available global oil and LNG. On the other hand, there is expected to be less demand and U.S. gas storage is comfortable so there is little room for prices to increase.

Natural Gas Technical Analysis: NG Breaks $2.68 Support as Selling Pressure Intensifies
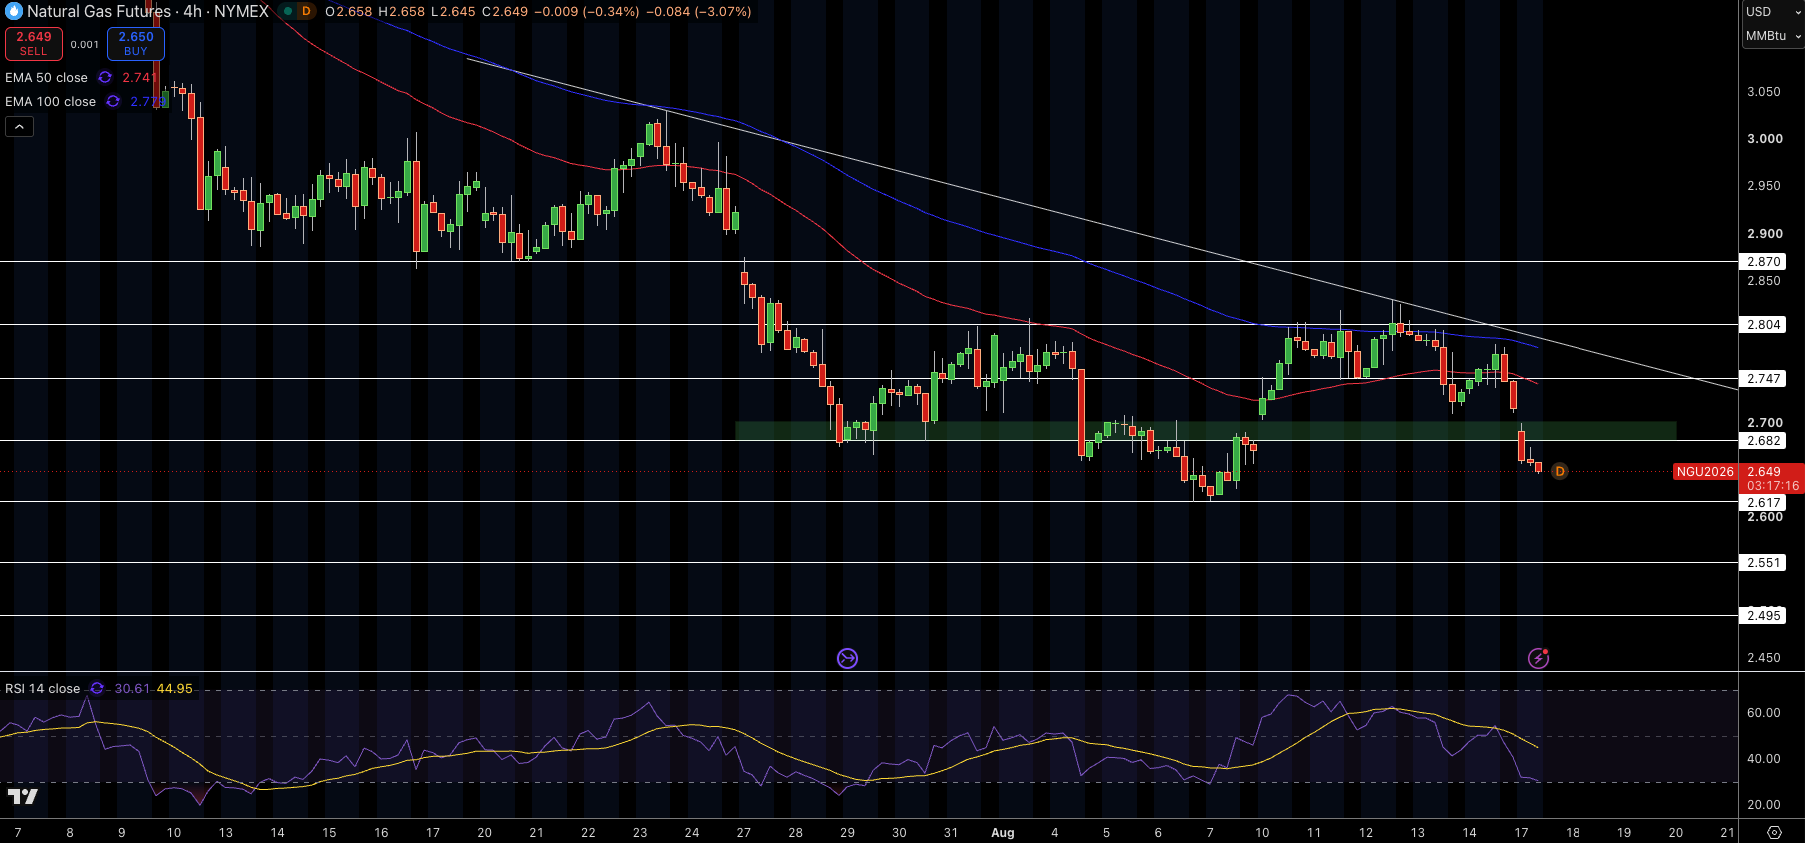
Natural gas is trading around $2.65 after a break below the significant support level at $2.68 on the 4 hour time frame. The 50 and 100 EMAs are at $2.74 and $2.78 respectively, while price is still trading below them. The bearish structure is reinforced by the downward sloping trendline. The latest bearish candlesticks show selling pressure has returned after the failed move above $2.80, and this has pushed price back towards the recent lows.
RSI is below the 50 neutral level at 31, which indicates that natural gas is currently in the oversold territory, and that price momentum in the short term to the downside is now stretching. Immediate support can be found at $2.62, $2.55, and $2.50. Resistance levels are located at $2.68, $2.75 and $2.80. Until price breaks above $2.68–$2.75, the structure remains bearish. A break below $2.62 can see price fall to $2.55, and a break above $2.75 would be needed to change the structure to bullish.
Natural Gas Price Forecast
Every new Natural Gas analysis as it publishes, today's technical signal and key levels, live price — on one page.
See all Natural Gas forecastsWTI Crude Oil Technical Analysis: WTI Holds EMA Cluster as $84.33 Resistance Caps Upside
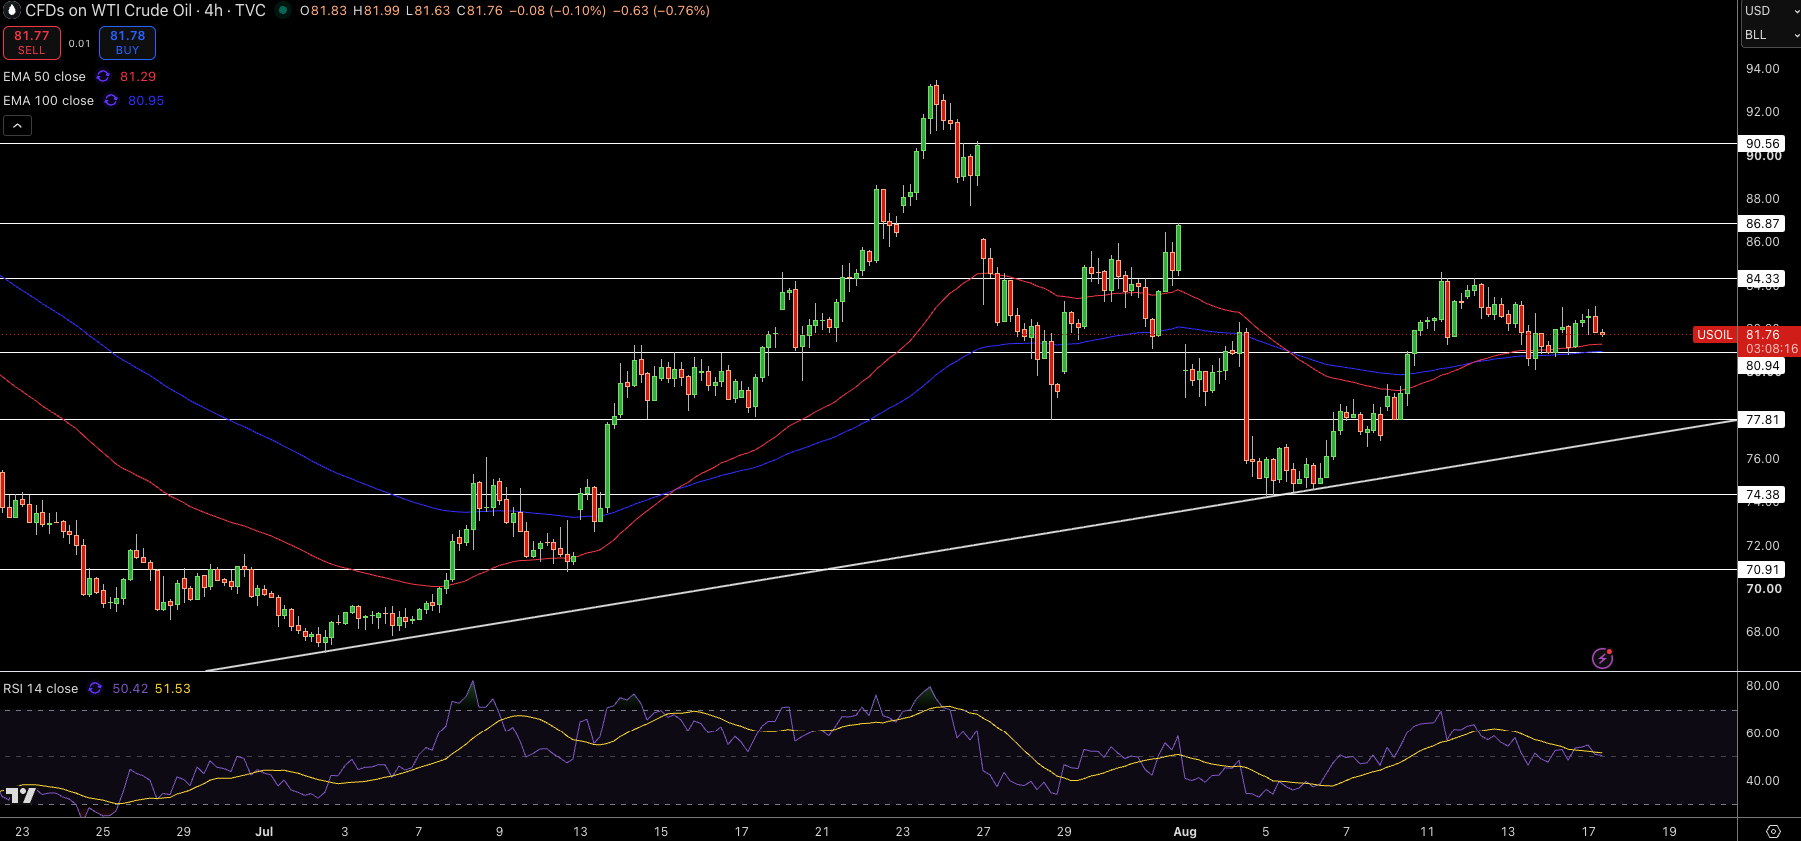
Currently trading around $81.76 in the 4 hour chart, WTI crude oil is consolidating around the 50-EMA at $81.29, and the 100-EMA at $80.95. Price has recovered from the lows of early August at $74.38, and has failed to break the resistance zone of $84.33 on numerous attempts, which has slowed the upward momentum. The recent formation of the candles indicate some sideways movement as opposed to a decisive reversal as the moving average cluster is holding the buying interest.
RSI is currently at 50, and is indicating neutral momentum. A decisive break out of the current range will likely indicate the next trend direction. Immediate resistance is expected at $84.33, $86.87 and $90.56. Support is expected at $80.94, $77.81 and $74.38. In my opinion, holding this zone above the EMA cluster maintains the bullish scenario. A break of $80.94 will cause the short term structure to weaken, leading to the target of $84.33 being active.
Brent Crude Oil Technical Analysis: Brent Consolidates Above $86.67 With $91.13 in Focus
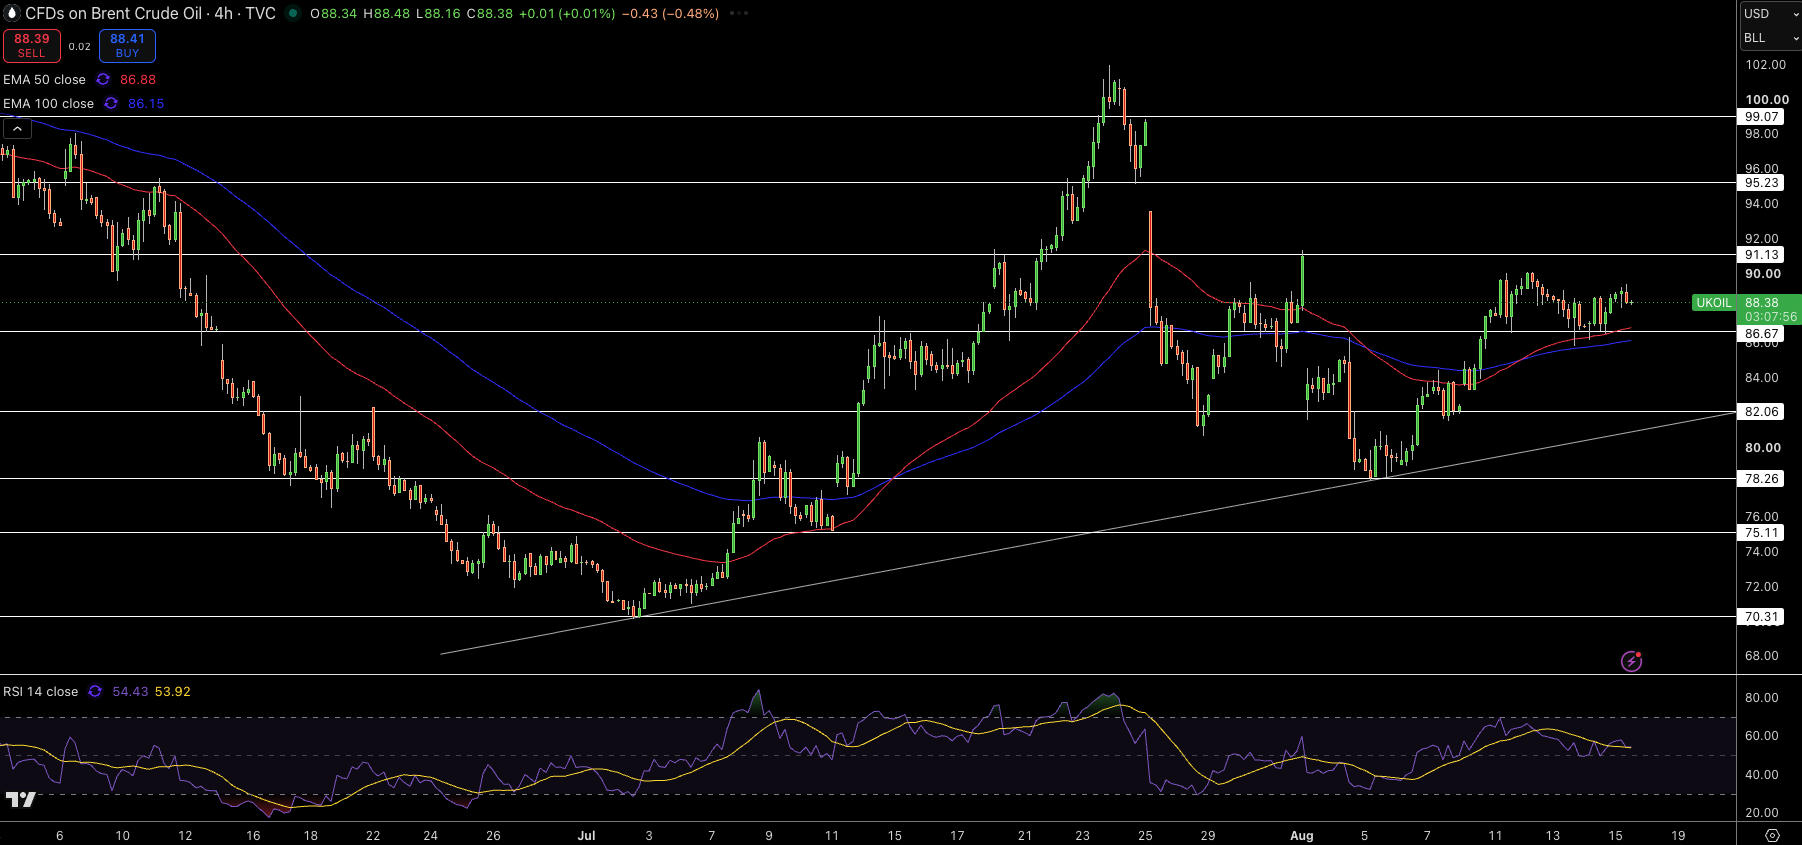
Brent crude is currently trading around $88.38 in the 4 hour chart, and is above both the 50-EMA at $86.88 and the 100-EMA at $86.15. The market has recovered sharply from the $78.26 area and is currently consolidating beneath the recent swing resistance at $91.13. Recent candles have been falling in a tight range suggesting buying interest has decreased, although the broader recovery is still intact.
RSI is currently at about 54. This is indicative of somewhat bullish sentiment, but not yet overly bullish. Estimated immediate resistance is around $91.13, $95.23, and $99.07. The first significant support lies around $86.67 (which is in close proximity to the moving average cluster) with more support around $82.06 and $78.26. Brent remains technically constructive, in my opinion, above $86.15 – $86.67. If $91.13 breaks in a sustained move, bullish sentiment should be expected. However, if the EMA cluster is broken, the chance of a deeper move is increased.


