Gold (XAU) price found some support during the Asian trading on Monday and rose to $4,395. The softer US retail sales and easing inflation reduced the hopes of another Federal Reserve rate hike. The retail sales declined by 0.6% in July, which is much lower than the projected 0.1% increase. The data weakened the U.S. dollar and the Treasury yields, which pushed the price of gold higher. The markets now expect only 33.1% chance of a September rate hike. Moreover, the safe haven demand is fueled by tensions between the United States and Iran.
A weaker dollar and lower interest rate expectations may also support silver (XAG). But the sharp drop in retail sales suggests less consumer activity. This may raise concerns about the industrial demand that plays a larger role in silver than in gold. Silver could move higher in the short term following gold but the concerns about a decline in economic activity may limit the rally.

Gold Price Forecast: Break Above $4,500 Targets $5,000
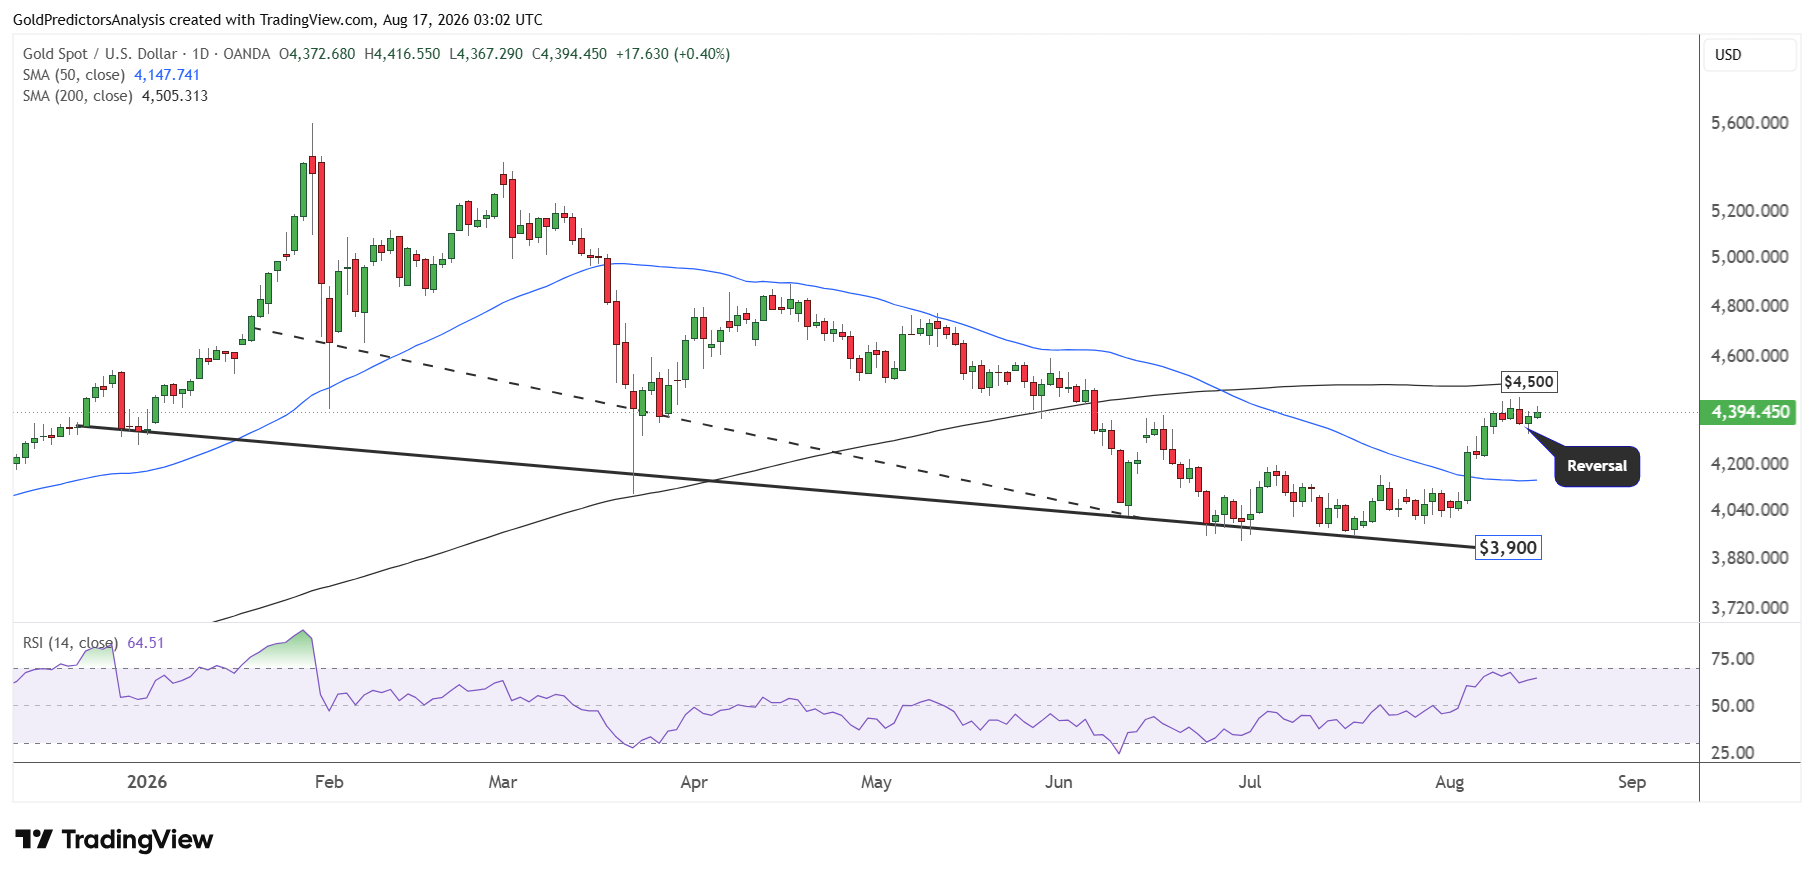
The daily chart for spot gold shows that the price has formed constructive price action above $3,900 and reached the resistance of the 200-day SMA in the $4,500 area. The key reversal candle on Friday indicates positive momentum in the short term. But a break below $4,300 will likely push the gold price further toward $4,200.
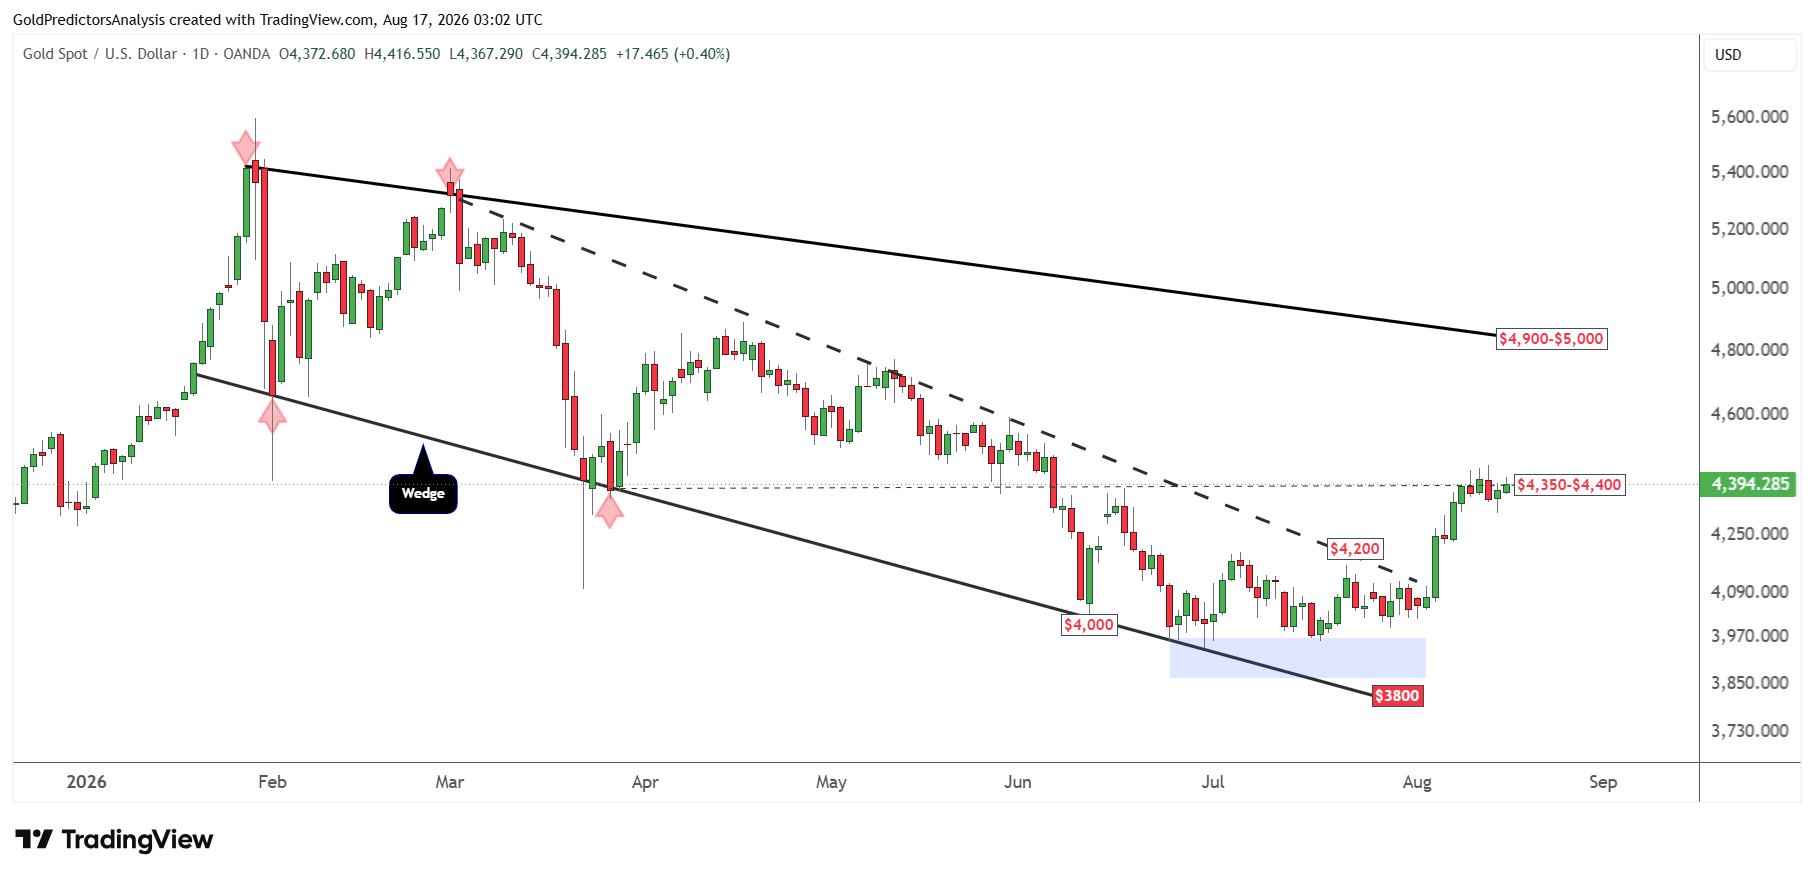
As long as the $4,000 support holds, the possibility of an upside breakout above $4,500 is high. A break above the $4,500 region will open the door for a strong rally toward the $5,000 area. This target is defined by the resistance line of the descending broadening wedge pattern. A break above $5,000 will confirm that the bottom is in and will keep the strong rally in the gold market intact.
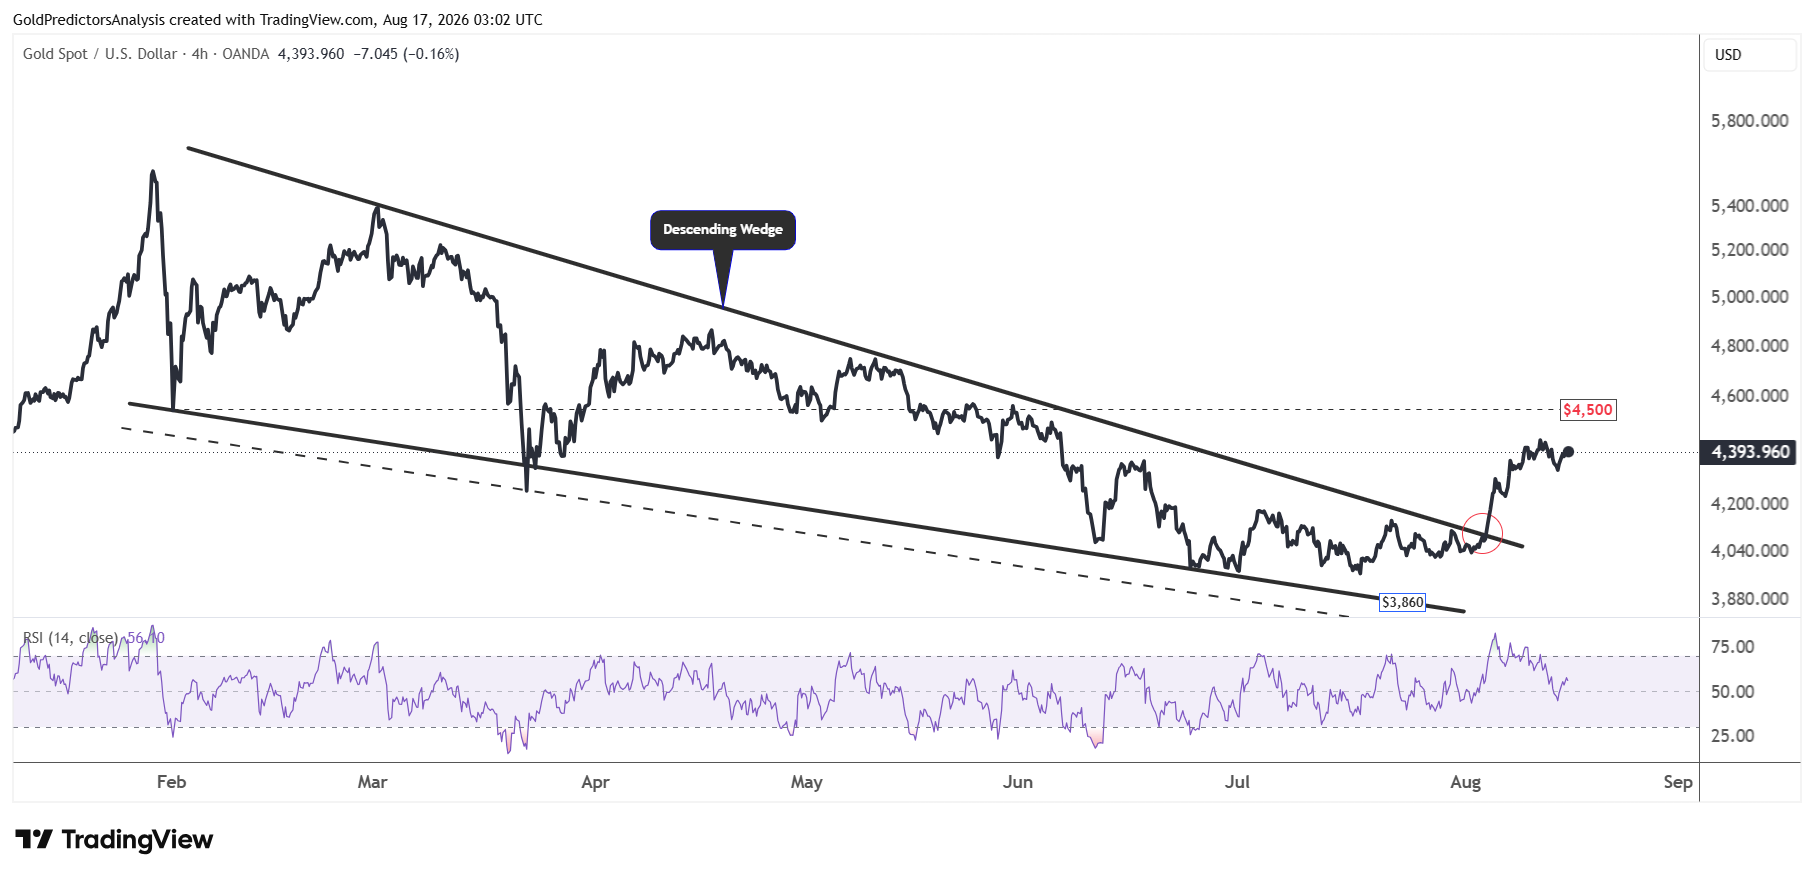
The 4-hour chart for spot gold also shows that the price has already broken out of the descending wedge pattern. The price is now moving toward $4,500, the key resistance level in the short term.
Gold Price Forecast
Every new Gold analysis as it publishes, today's technical signal and key levels, live price — on one page.
See all Gold forecastsSilver Price Forecast: Break Above $72 Targets $90
The daily chart for spot silver also shows constructive price action above the $64 support after the breakout. The price has now moved out of the primary support region and is looking for a rally toward $72 in the short term. But if the price fails to hold the $64 support, it may drop further toward $60.
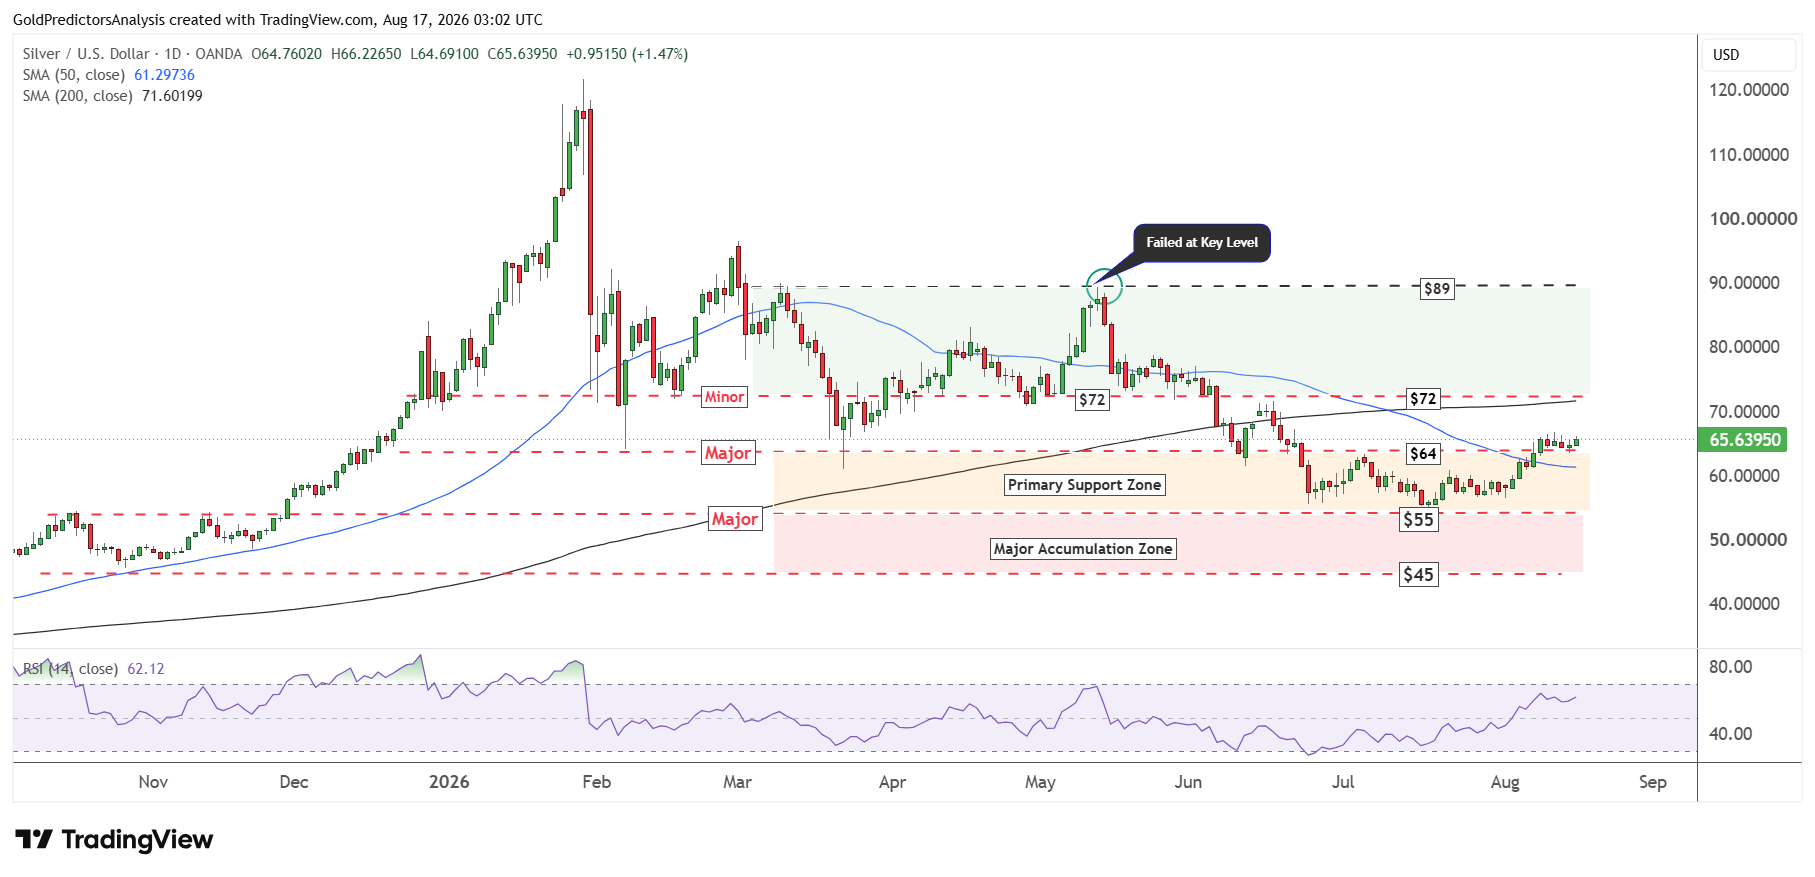
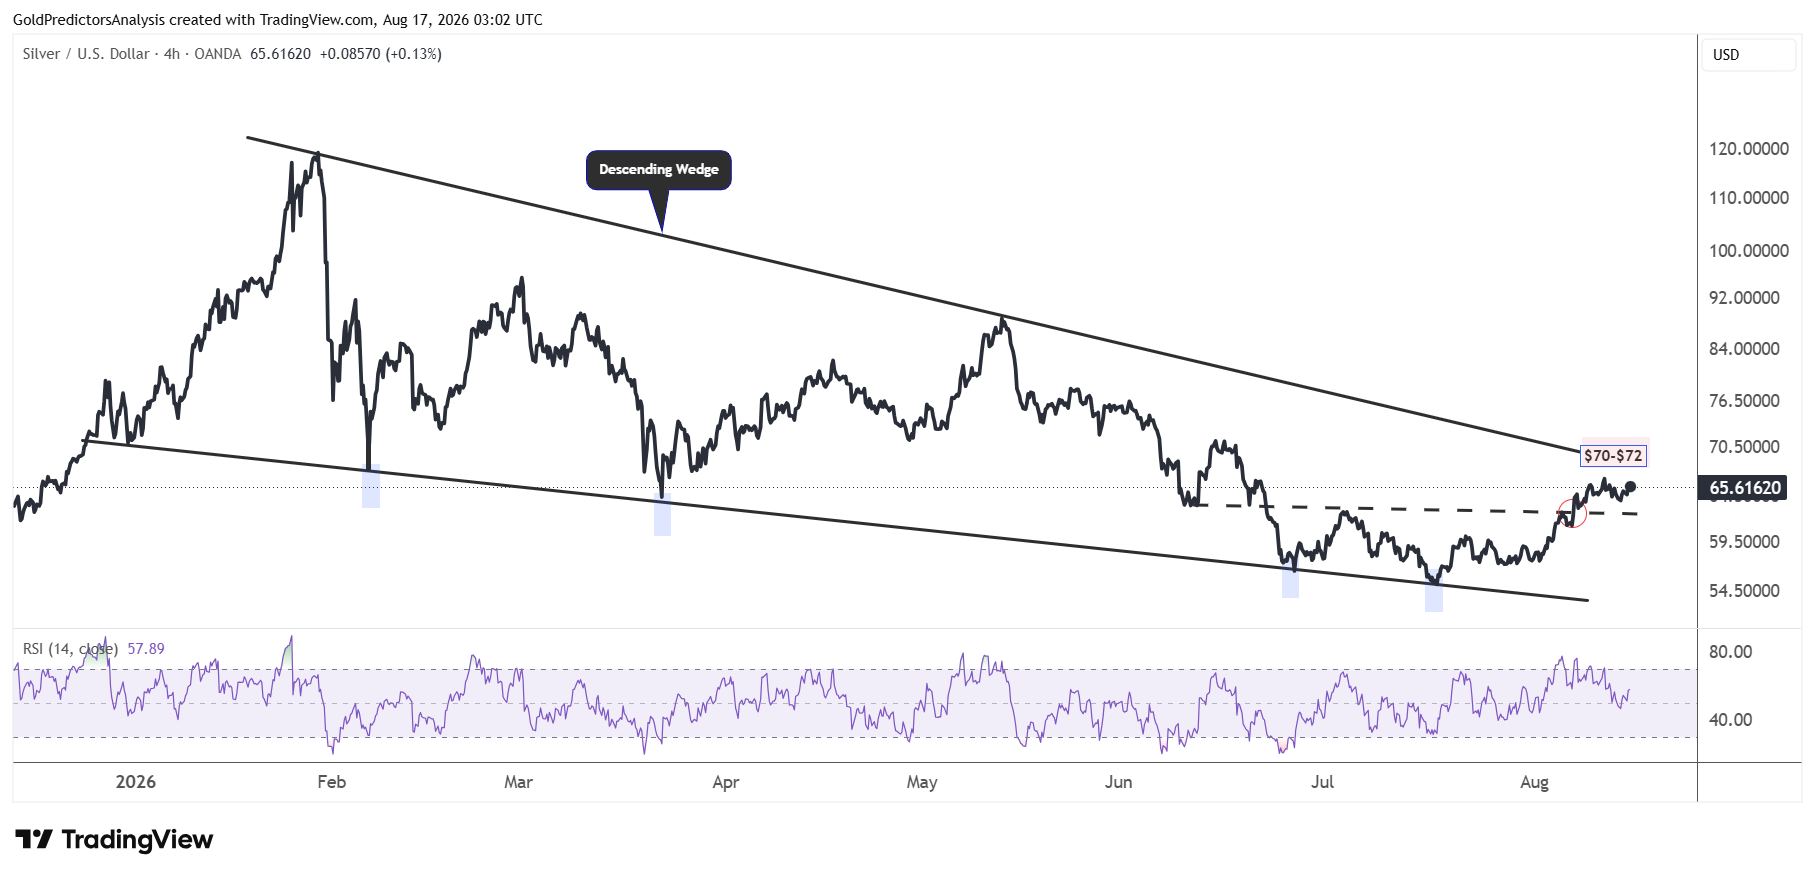
The key resistance for spot silver remains the $72 area which is also intersected by the 200-day SMA. A break above $72 will push the price toward the $89 area for spot silver. The 4-hour chart for spot silver also shows constructive price action within the descending wedge pattern. The immediate resistance remains in the $70-$72 area. A break above this level will likely push the silver price toward the $90 area.
Bottom Line
Gold and silver remain supported by a weaker U.S. dollar, lower Treasury yields and reduced expectations for Fed rate hike. Gold could extend the recovery if it breaks above $4,500 while a move below $4,300 may trigger another decline. Silver must hold above $64 and break the $70-$72 resistance zone to continue higher. However, weaker consumer activity could limit silver due to its strong link to industrial demand.
Read more: AI Boom Puts $100 Silver Back in Sight