Gold Closed Higher Because the Dollar Finally Broke
Spot gold finished Friday with a gain because the dollar gave way after the retail sales miss and the rate-relief trade from this week’s inflation data finally showed up in the currency market. The metal had sold off 1.3% Thursday on profit-taking after reaching its highest level since June 5.
Friday’s recovery tells you buyers are still underneath gold even after the reversal from the highs. Treasury yields climbed all session and could not stop the rally, which says something about how much weight the market is putting on the weaker dollar and the fading September hike case.
The weekly gain came in around 0.9% with the trend turning up on the swing chart and the 200-day moving average now in sight overhead.
Spot Gold (XAUUSD) settled at $4,376.82 at the close Friday, up $25.55 or 0.59%.

The Dollar Cracked and the Data Behind It Keeps Getting Softer
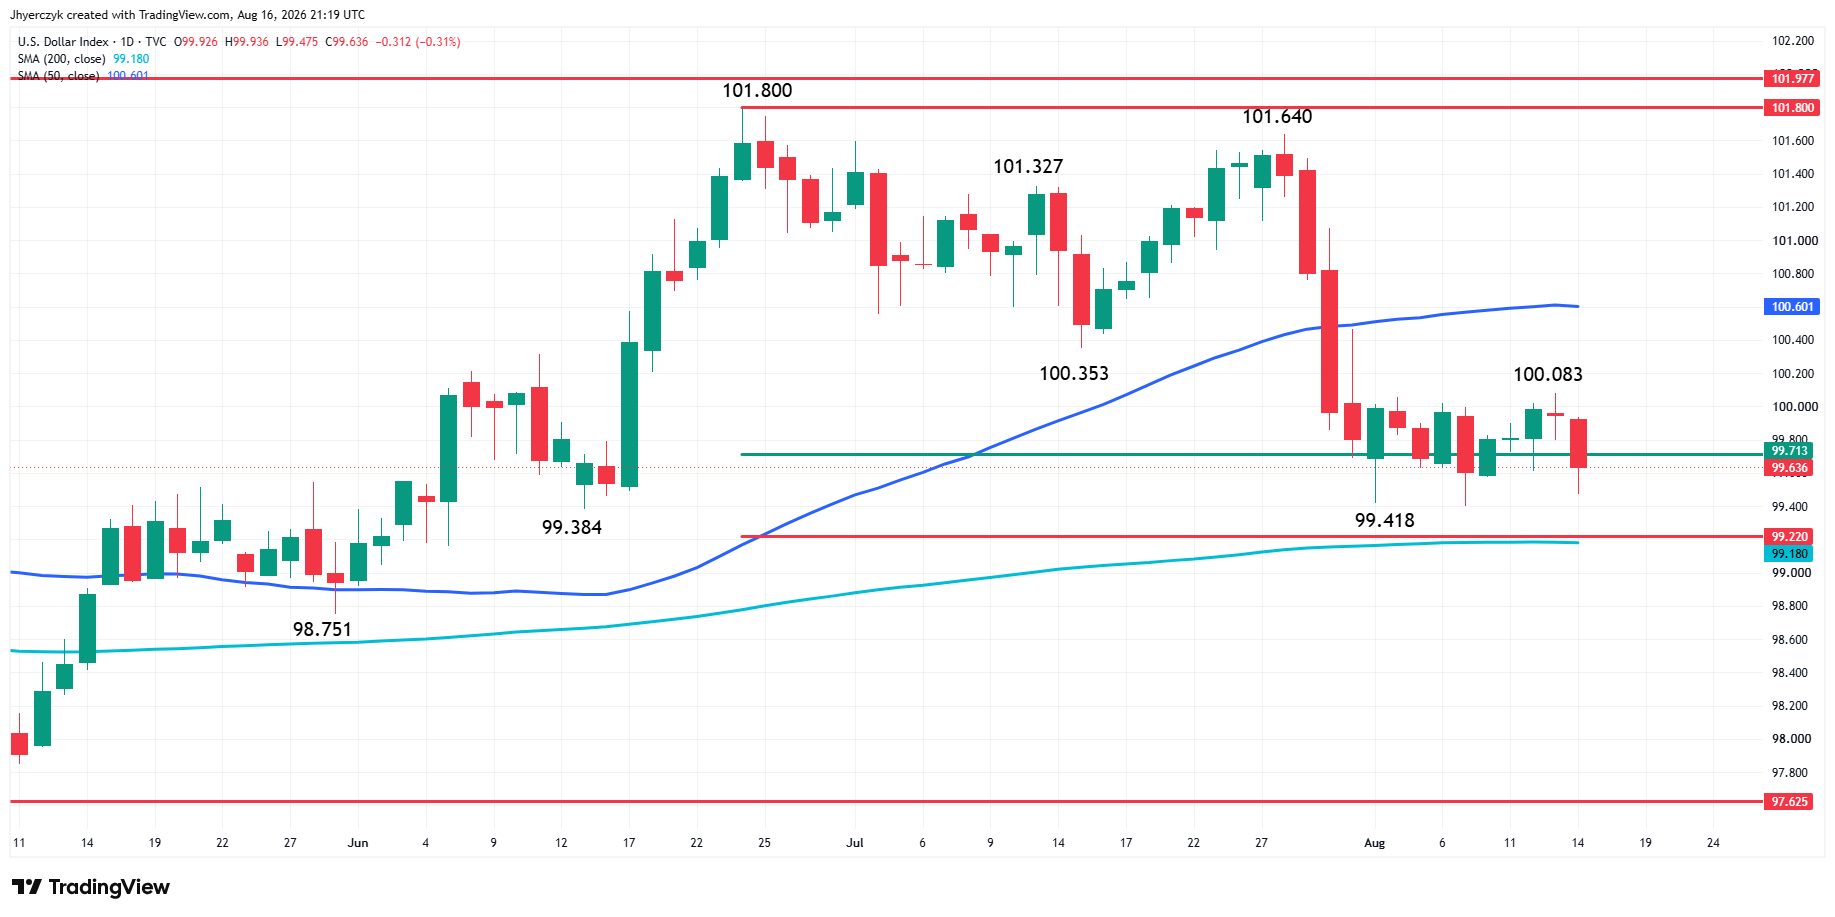
The U.S. Dollar Index fell 0.3% to 99.67 on Friday. That was the move gold needed all week. The bond market had been cooperating since Wednesday’s CPI. The currency market had not. Friday it did.
July retail sales fell 0.6% when economists expected a 0.1% increase. That landed on top of a payrolls report that showed unexpected job losses and two inflation reports that both came in below estimates. CPI rose 0.1% in July with the annual rate easing to 3.4% from 3.5%. PPI was flat against expectations for a 0.2% increase. By Friday traders were pricing only a 31% probability of a September rate hike, down from better than even odds a week ago.
Gold had been stuck between a friendly bond market and a firm dollar all week. The retail sales miss broke the stalemate. The dollar dropped, gold rallied and the market finally got both sides of the rate trade lined up on the same session.
Gold Price Forecast
Every new Gold analysis as it publishes, today's technical signal and key levels, live price — on one page.
See all Gold forecastsYields Climbed Friday and Gold Rallied Anyway
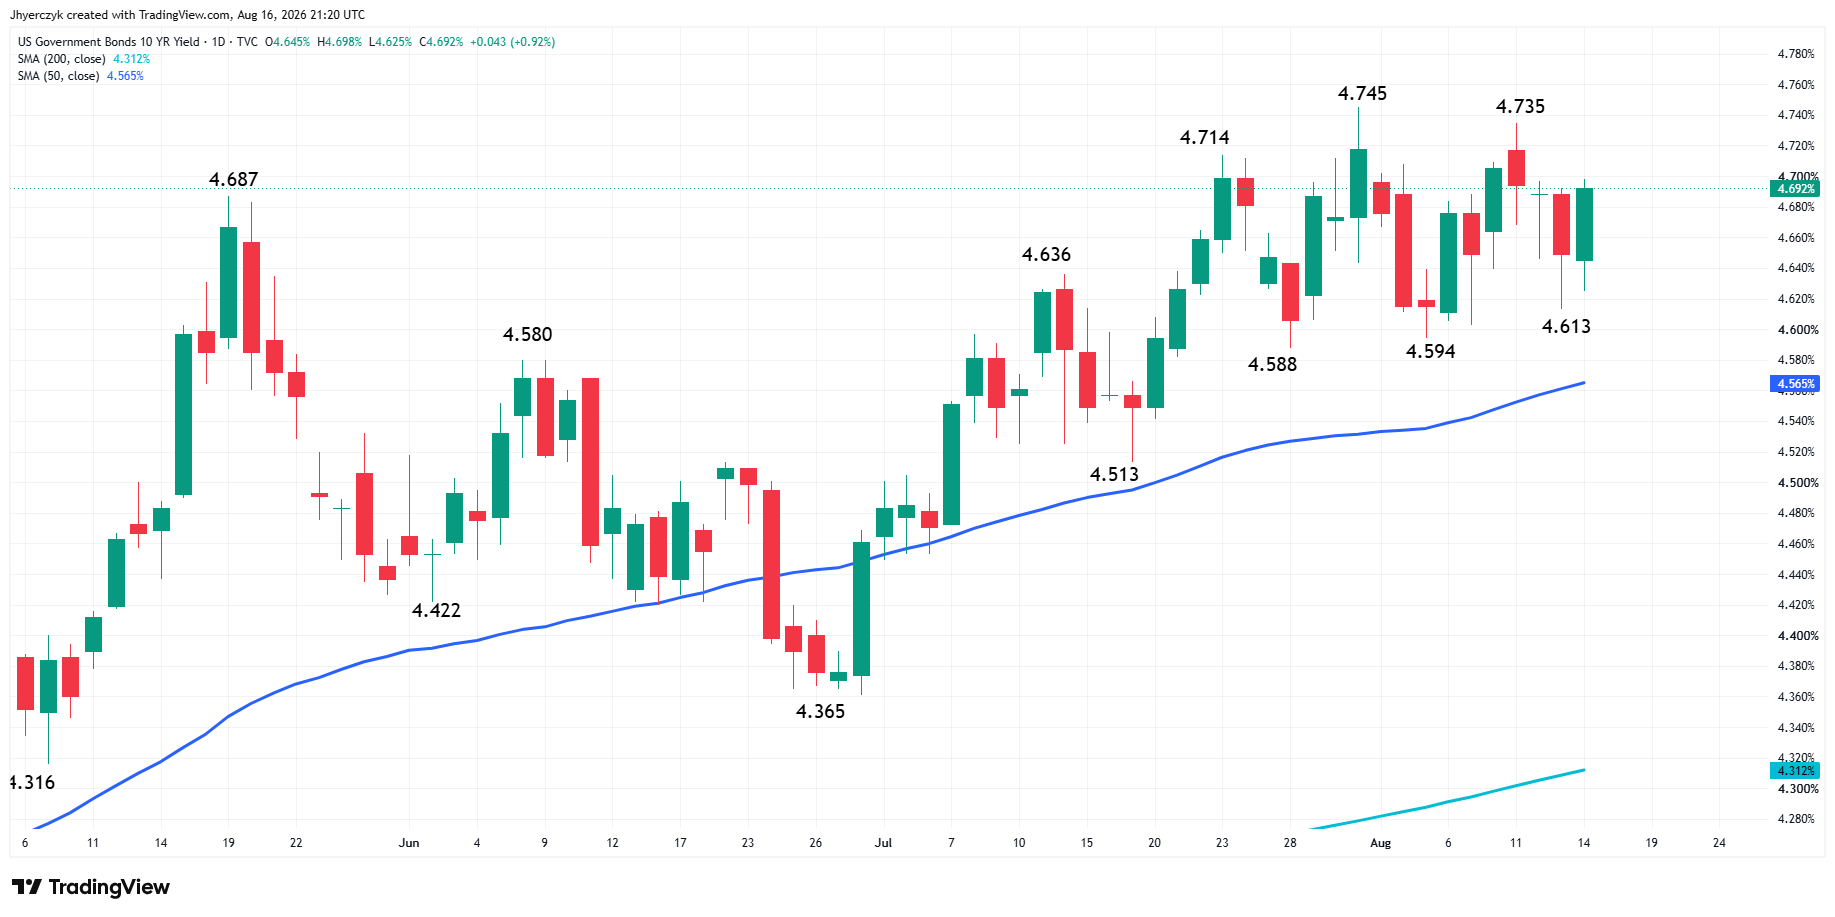
The 10-year Treasury yield rose more than 5 basis points to 4.696%. The two-year added 3 basis points to 4.171%. The 30-year climbed nearly 6 basis points to 5.267%. Those are not friendly numbers for a metal that pays no interest.
Gold gaining on a day when yields moved higher is the tell heading into next week. The dollar and the hike odds mattered more Friday than the yield move. That does not mean yields stop mattering. Real yields remain elevated and as long as Treasuries keep offering that kind of return, they compete with gold for capital.
The Strait of Hormuz is the reason yields may not be done climbing. Two more ships were attacked near the strait this week and the United States said it could maintain its naval blockade of Iran indefinitely. Higher crude from a longer disruption puts energy costs back into the inflation data and gives the Fed’s hawks a reason to keep September tightening on the table. Gold is getting a friendlier rate backdrop from the July data. The August data has not been collected yet and the oil risk makes it harder to assume the next round looks the same.
Spot Gold (XAUUSD) Technical Analysis
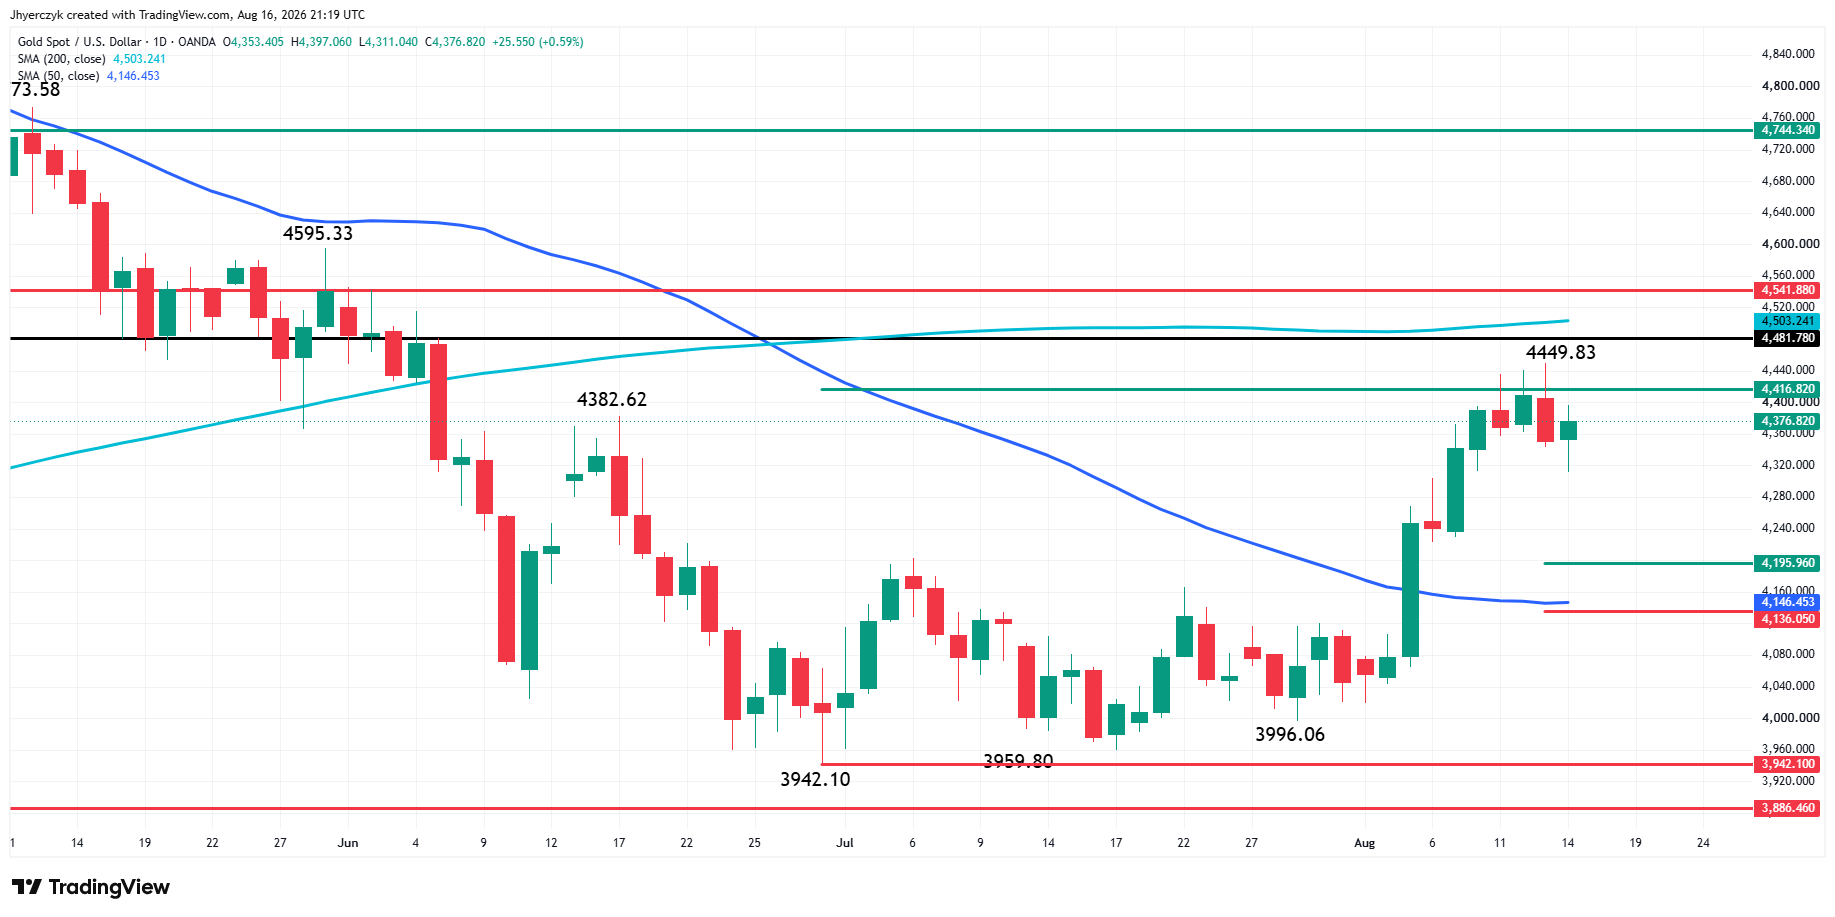
Spot Gold (XAUUSD) closed higher Friday and in a position to test an intermediate 50% level at $4,416.82 and challenge last week’s high at $4,449.83. The main trend is up and taking out that level will reaffirm the uptrend.
Over $4,449.83 is $4,481.78 and the 200-day moving average at $4,503.24. The first level, $4,481.78, represents a 20% decline from the all-time high and to some analysts, the start of the bear market. Overtaking will end the bear market but not necessarily begin a new bull market.
The 200-day moving average will also deliver new challenges for traders. Some will treat it as resistance. Others may see it as a potential trigger point for an acceleration to the upside.
Although Spot Gold closed higher on Friday, the early session weakness confirmed the previous session’s potentially bearish closing price reversal top. Taking out Friday’s low at $4,311.04 will reaffirm this chart pattern. If it creates strong downside momentum, we could see a 2 to 3 day break into a key 50% to 61.8% zone at $4,195.96 to $4,136.05. Inside this zone is the 50-day moving average at $4,146.45.
What to Watch
Gold closed the week with the rate-relief trade intact and the dollar finally confirming what the bond market had been saying since Wednesday. September hike odds at 31% are the lowest they have been since the payrolls report started the repricing. The August employment and inflation data arrive before the September meeting, and the Hormuz blockade threat means the energy risk sits behind every forward-looking number the Fed will see. Gold gained on a day when yields rose. That tells you the dollar and the hike odds are driving this market right now, not the yield curve.
The trend is up on the swing chart with last week’s high at $4,449.83 as the first test and the 200-day moving average at $4,503.24 above it. Friday’s early weakness confirmed Thursday’s closing price reversal top, which means a break below $4,311.04 early next week reopens the downside toward the 50-day moving average at $4,146.45. The close above Thursday’s low kept buyers in control heading into the weekend, but the reversal pattern is live until the market takes out the high.
If you’d like to know more about how to Spot Gold (XAUUSD), please visit our educational area.