
US Dollar News: Fed Hike Bets Fade as Euro and Pound Gain Support
The U.S. dollar begins the day on Wednesday, August 17, under pressure after a slow release of economic data reduced the likelihood of another rate hike from the Federal Reserve. U.S. retail sales slipped in July for the first time in nine months and cited worsening consumer sentiment in addition to last week’s trends in the CPI and PPI. The odds of a September rate hike have dropped to 30% from 50%. It is now expected that rates will hold at current levels, as the markets’ prediction is at a 70% chance of no change. There are now expectations that the Fed’s July meeting documents will be released to see if the economic slowdown is of concern.
The euro’s outlook is looking more favorable with the expectation that the European Central Bank will be the first to hike in September. A Reuters poll conducted August 10-13, showed 57 of 69 economists showed the expectation for a 25-basis point increase to 2.50%. The eurozone’s inflation data increased to 2.9% in July, citing persistent inflationary pressures due to the conflict in the Middle East. Economists also increased their outlook for growth from 2026 to 0.8%. The outlook for the flash PMIs and confidence indices for later this week will determine if growth has improved.
Sterling still has a relatively strong domestic base following the quickening of UK second-quarter GDP growth by 0.4% and by 0.3% in June. For the first half of the year, Reuters noted UK growth was the fastest among G7 economies. Even with the data, markets envisage about one bank rate increase for the UK this year making data releases for inflation and the labour market due this week very important.
From a currency point of view, the focus for August 17 is shrinking policy divergence. Slower U.S. data means the Fed is less likely to hike while the ECB and BoE both have tightening possibilities This means the EUR/USD, USD/JPY, and GBP/USD pairs shall be in focus for currency traders.

U.S. Dollar Index Technical Analysis: DXY Breaks Rising Trendline as $99.42 Support Comes Under Pressure
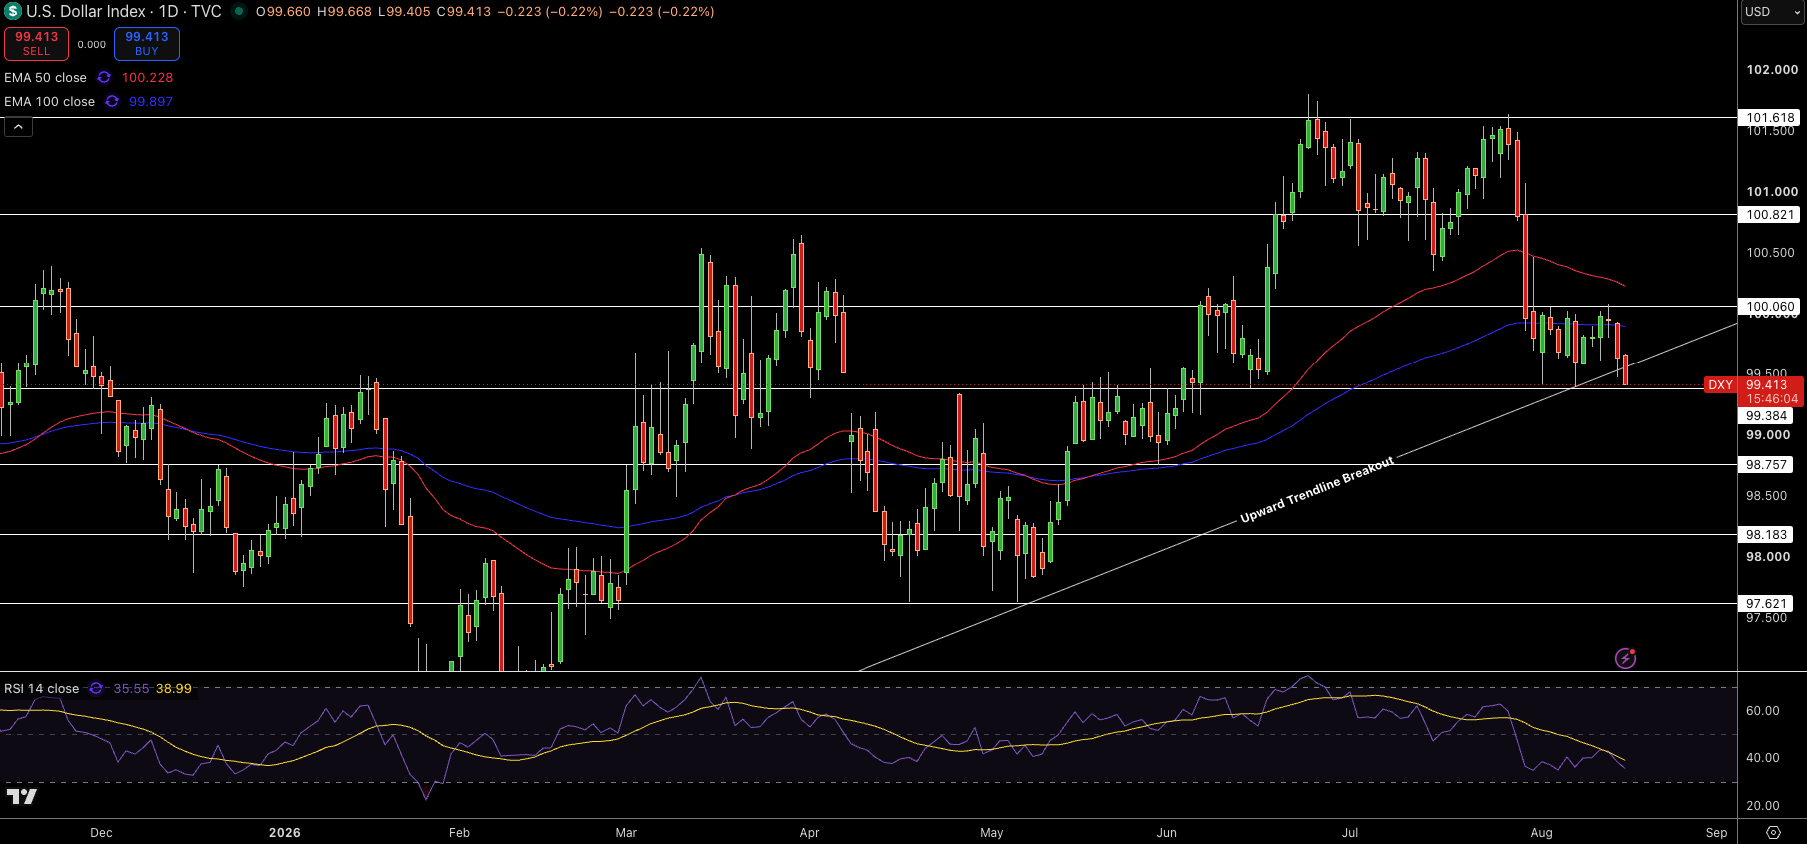
The U.S. Dollar Index is currently testing $99.41 on the daily chart after dropping to below the rising trendline showing the broad recovery after the spring lows. Price is also under the $100.23 50-day EMA and the $99.90 100-day EMA, and continues to put pressure on the structure. The latest bearish candle has pushed $DXY into the $99.38-$99.42 support zone, making this region critical for the next move.
RSI is at 36, showing weak momentum and is approaching oversold territory. Immediate resistance is at $100.06, then $100.82 and $101.62. Breaking below $99.38 would take out $98.76 and $98.18.
I still believe the dollar is vulnerable until the broken trendline is cleared along with the EMA cluster. A move back above $100.06 would improve the outlook, and a break below $99.38 would negatively impact the dollar.
EUR/USD Price Forecast
Every new EUR/USD analysis as it publishes, today's technical signal and key levels, live price — on one page.
See all EUR/USD forecastsGBP/USD Technical Analysis: Pound Extends Bullish Run Toward $1.3587
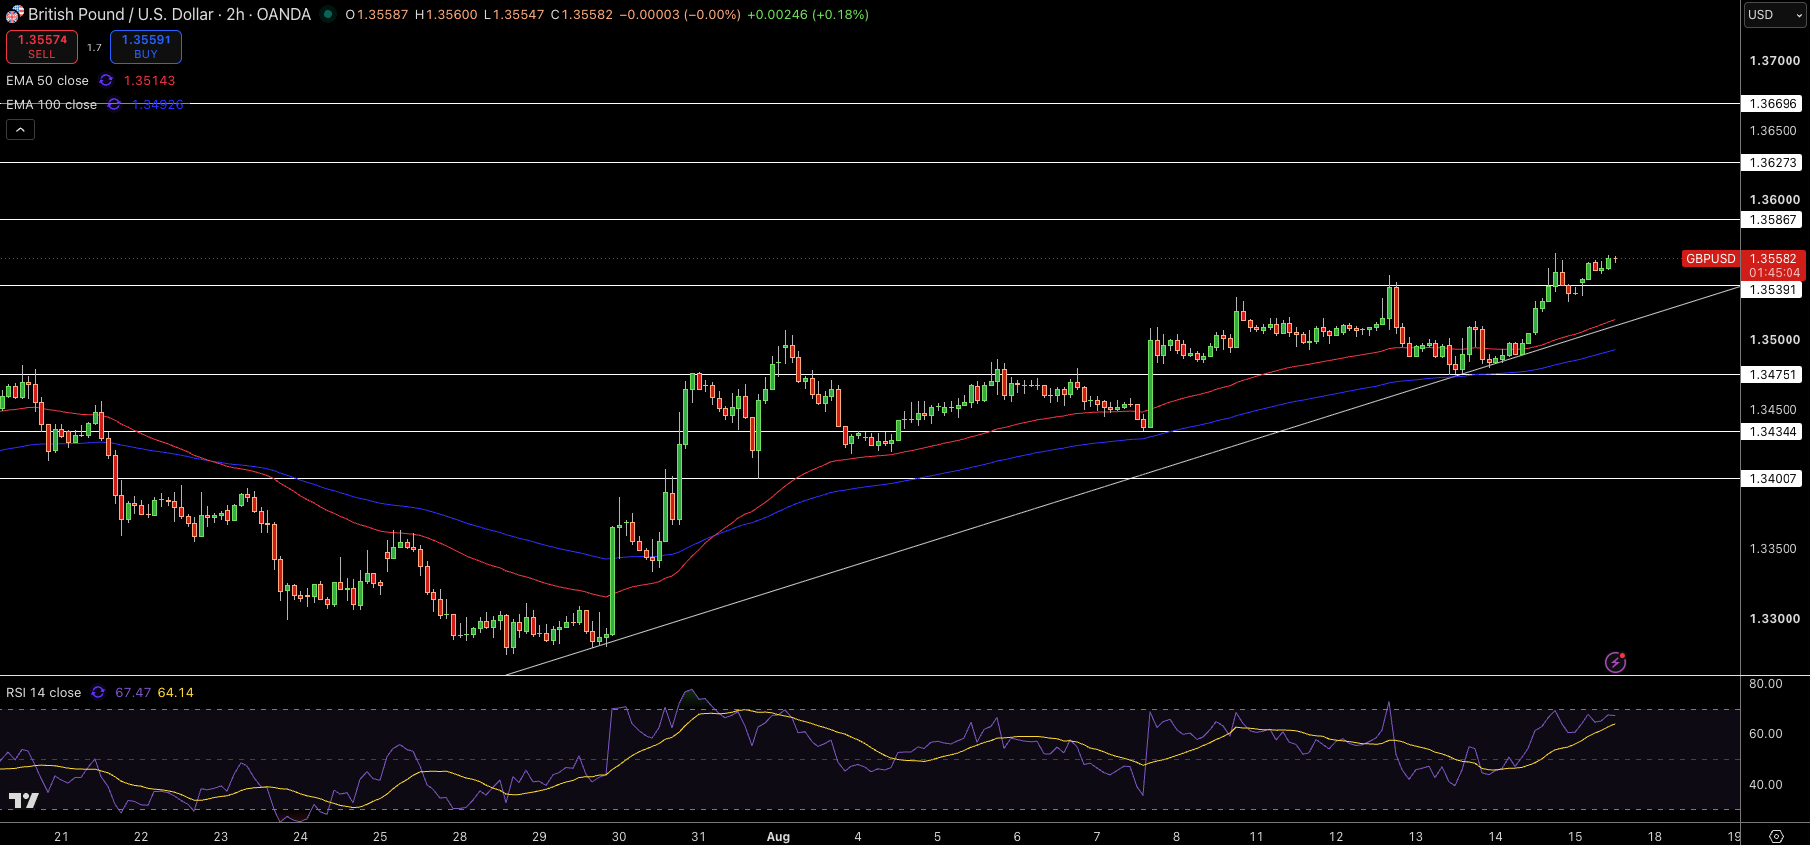
GBP/USD is trading around $1.3558 on the 2-hour chart and is moving higher in a clear trend of higher highs and higher lows. Price is above the 50-EMA at $1.3514 and the 100-EMA at $1.3493, and rising trendline to further support the overall positive trend. Recent bullish candlesticks show steady buying, but are not impulsive, as price is moving much closer to important resistance.
RSI is at 67 which is an strong increase and shows the pair moving in the bearish direction towards overbought territory. At the moment the resistance is projected at $1.3587, then $1.3627 and then at $1.3670. For the GBP/USD, from a bullish perspective, you are likely to find support at $1.3539, then $1.3475 and $1.3434.
Where I stand, GBP/USD is especially bullish as long as it holds above $1.3510 and $1.3539. A break above $1.3587 would likely ignite a run toward $1.3627. If the bulls lose the trendline, it could weaken the bullish structure.
EUR/USD Technical Analysis: Euro Breaks Higher as Momentum Reaches Overbought Territory
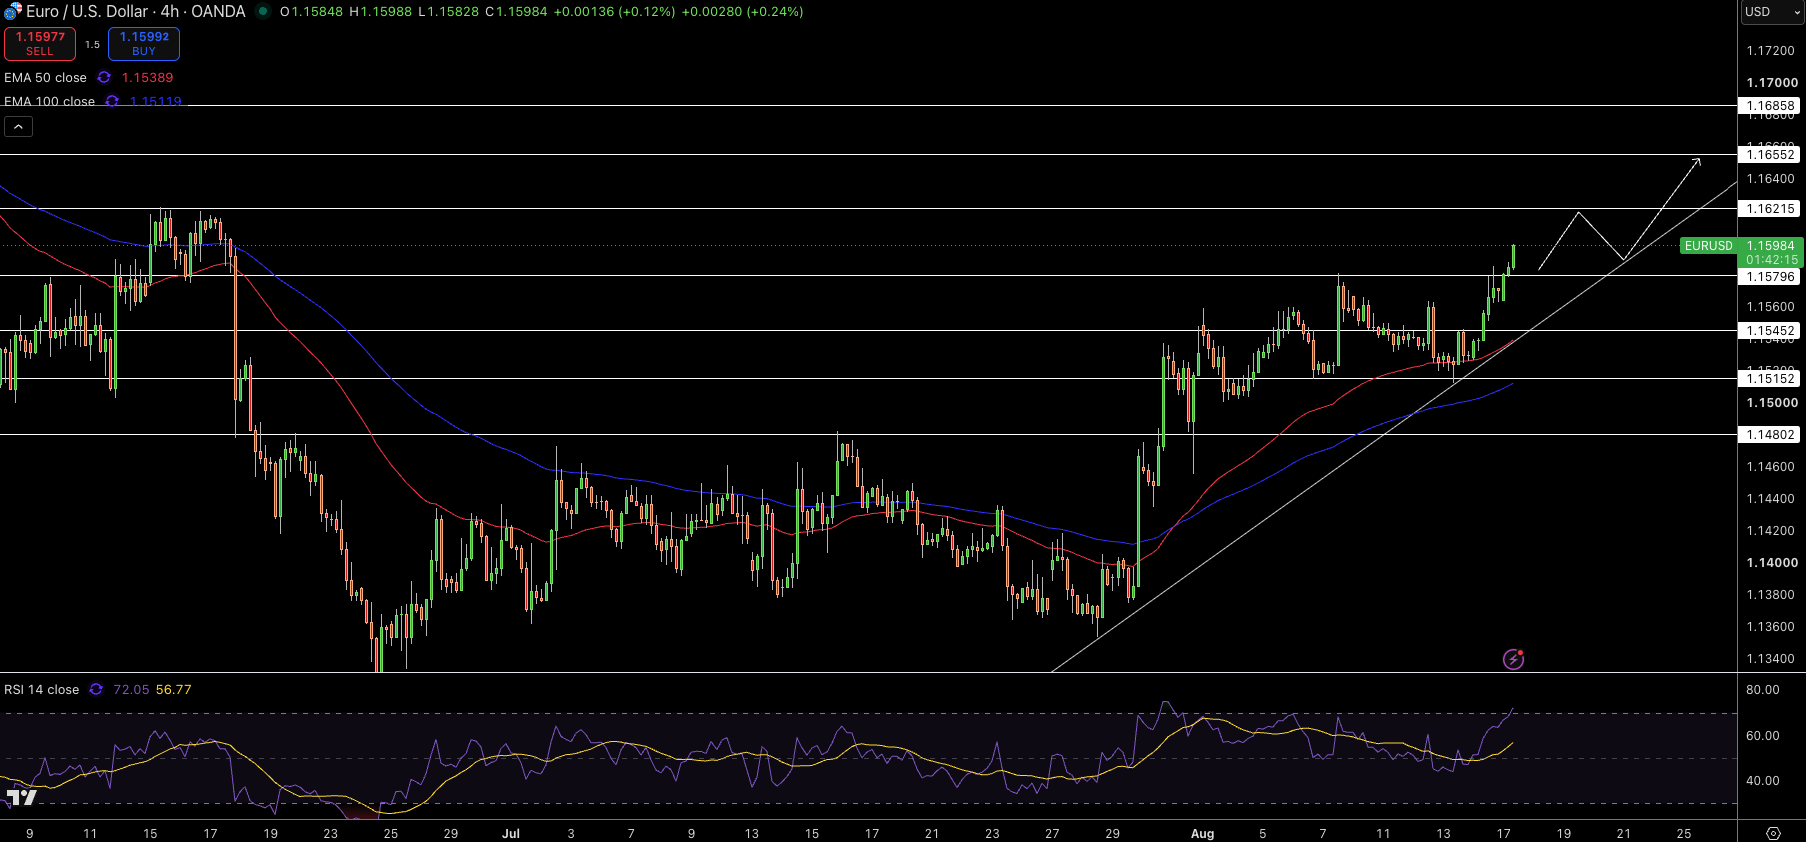
EUR/USD is currently at $1.1598 on the 4-hour chart. It has broken above the recent consolidation zone and $1.1580. Price is above the 50-EMA at $1.1539 and the 100-EMA at $1.1512 and therefore, is showing that short-term momentum is in the hands of buyers. EUR/USD is also above the trend line that has been supporting the recovery from the recent lows, which were made in July.
RSI is at the overbought region at 72, and therefore, could potentially mean a pullback or consolidation will happen in the short-term. Resistance is located at $1.1622, $1.1655, and $1.1686. Support is at $1.1580, $1.1545, and $1.1515.
In my opinion, the structure is bullish as long as EUR/USD stays above the $1.1580 level. If there is a clean break of the $1.1622 level, the move could end at $1.1655. If there is a break of the $1.1545 level, the latest breakout will not be valid.