Volatility Tightens at Inflection Point
Volatility in natural gas continued to decline on Tuesday, as trading remained inside a developing small symmetrical triangle consolidation pattern. Although symmetrical triangle patterns can break either way, this one has formed below resistance from an uptrend line and the 50-day moving average, reflecting a bearish trend and continued downward pressure. Nonetheless, the breakout direction will point to what comes next, either a continuation lower or a bullish reversal. Until that occurs, the narrowing consolidation leaves the market at a technical inflection point.

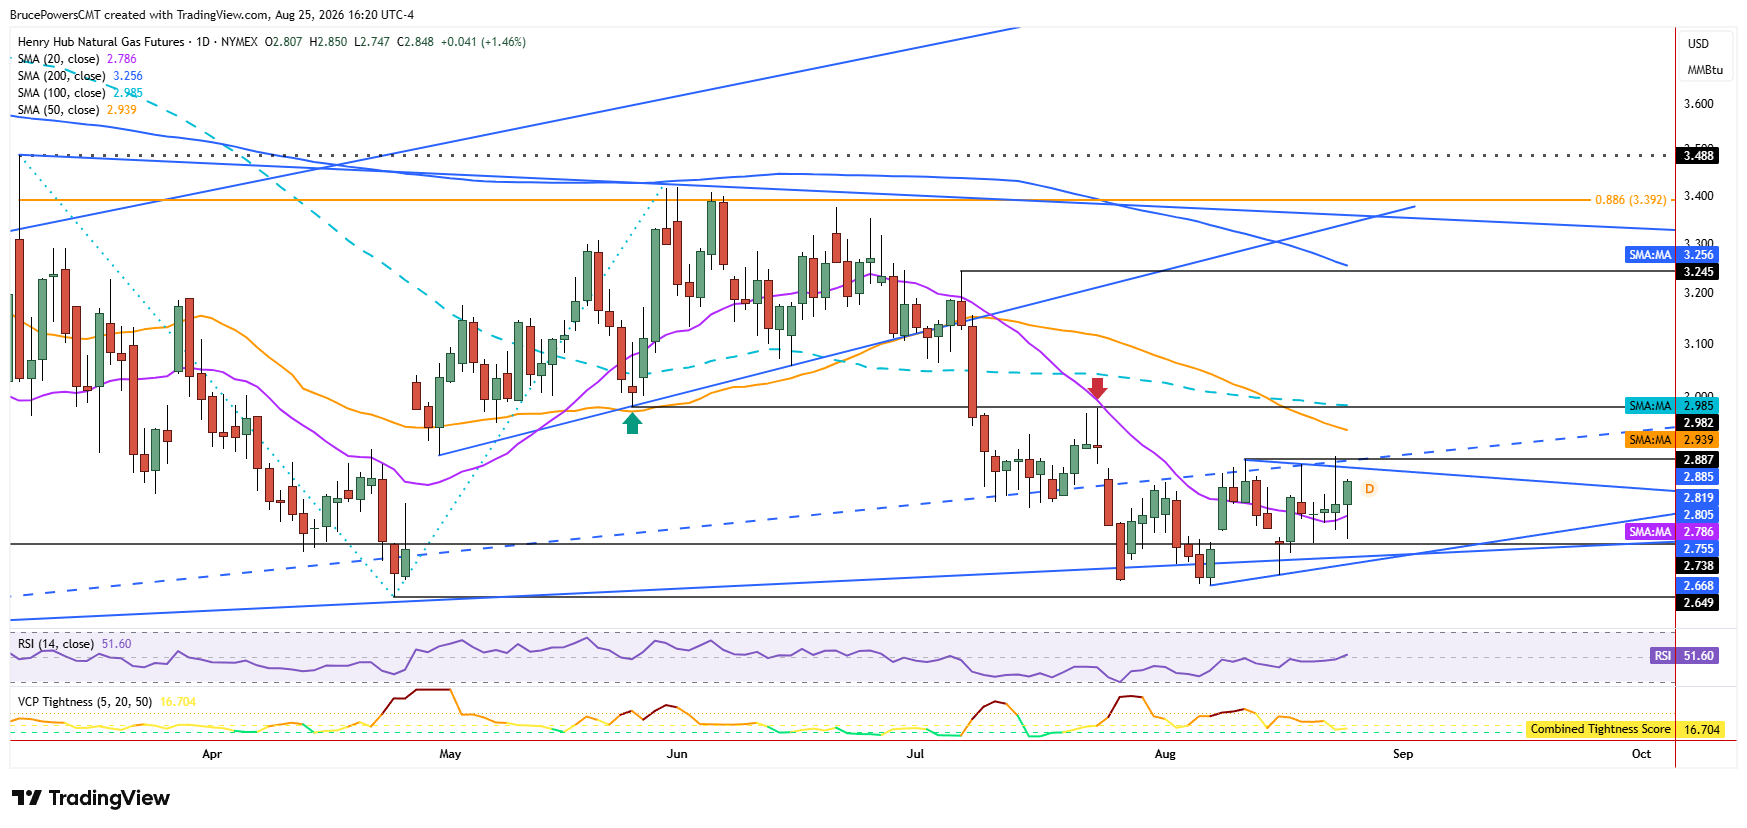
Support Offers an Alternative Path
The other way to consider recent lows is that strong support has been reached near the lower boundary of a larger price range that encompasses the past four months or so. In that scenario, a bullish reversal from the lower range support zone could lead to an advance to the top of the range. The upper range boundary is represented by a falling trendline that connects to the recent swing high in June. Also, the 200-day moving average near $3.26 is falling and presents another potentially significant resistance zone and therefore an upper target if a bullish reversal triggers.
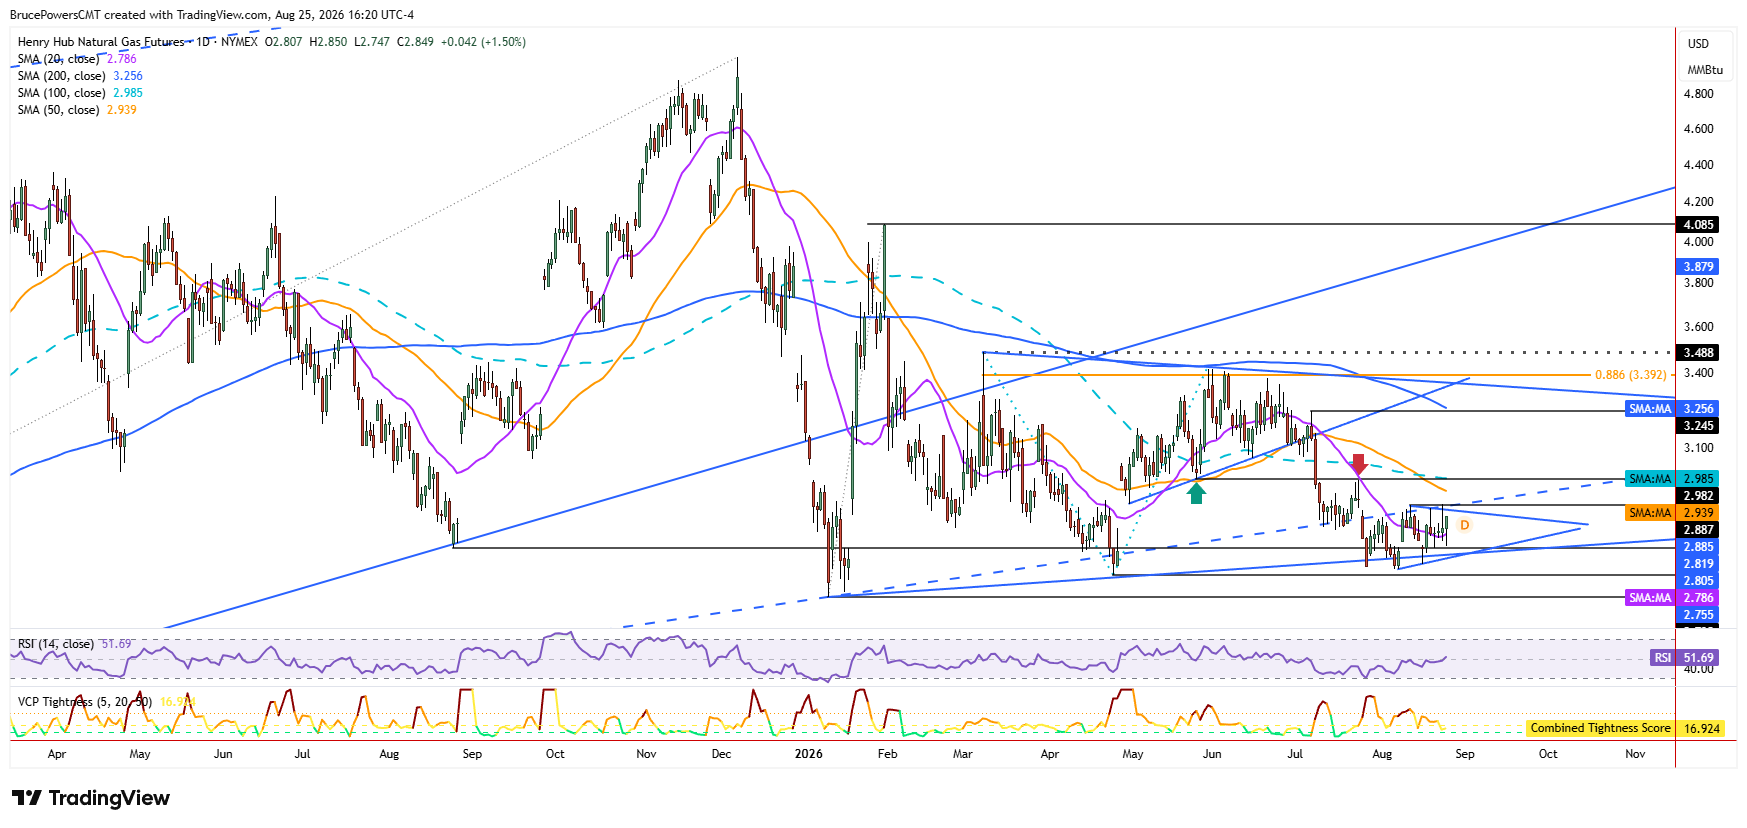
$2.89 Sets the Bullish Trigger
A bullish reversal from the current consolidation would trigger on a decisive rally above $2.89. Resistance would then be tested near the falling 50-day moving average near $2.94. However, the 50-day moving average would likely be closer to aligning with the $2.89 high before it is challenged for an upside breakout. That would increase the potential significance of a breakout since both the high and moving average could be recovered in the same move, reinforcing the importance of the breakout and therefore the potential for an advance to continue higher toward key potential resistance zones.
Recovery Targets Come Into View
Following the reclaim of the 50-day moving average, the next upside target is near the recent lower swing high of $2.98, followed by the 200-day moving average. There is also a lower swing high at $3.25 that preceded the breakdown from the rising trend in early July that could act as an upside target. Therefore, the $2.89 breakout level remains the first key signal to watch. A decisive move above it would strengthen the case that support seen at the lower end of the broader range is holding and that natural gas may be preparing for a larger recovery.
If you’d like to know more about how to trade natural gas, please visit our educational area.