Bear Flag Breakdown Reasserts Seller Control
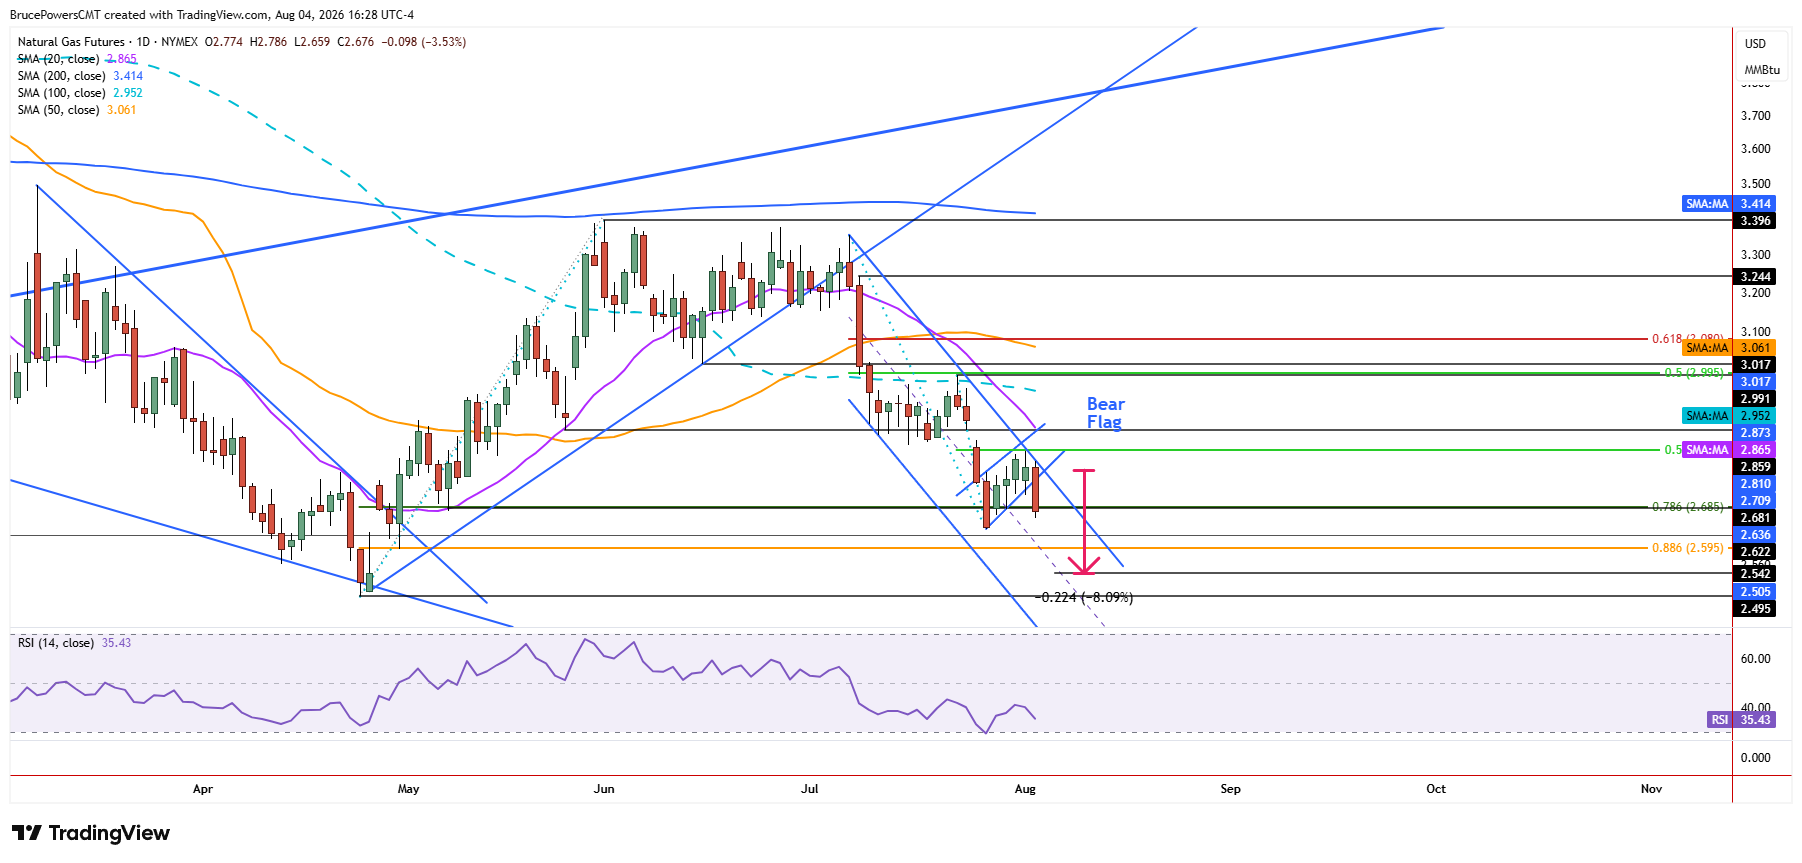
Sellers took back control of natural gas on Tuesday, as it broke down from a bearish flag continuation pattern and reached a five-day low of $2.66. Trading continues near the lows of the day at the time of writing, and the closing price is set to be at its second-lowest level for the current bearish correction. Previously, the lowest daily close for the decline was $2.64 from five days ago and it looks likely to be broken to the downside given the bearish signal. A break below that close would further confirm that sellers are regaining control and that the broader bearish trend remains intact.

Breakdown Puts Key Fibonacci Levels in Focus
The bearish flag formed near the support of the 78.6% Fibonacci retracement at $2.69, and it triggered following the 50% retracement of the prior decline. A decisive decline was represented by a relatively wide-range, full bodied bearish candle, suggesting that the recent low of $2.64 is at risk of breaking as the larger dominant bearish trend reasserts itself on the shorter timeframe. The breakdown also adds weight to the view that the recent consolidation was a pause within the larger decline rather than the beginning of a lasting reversal.
How Low Could Natural Gas Go?
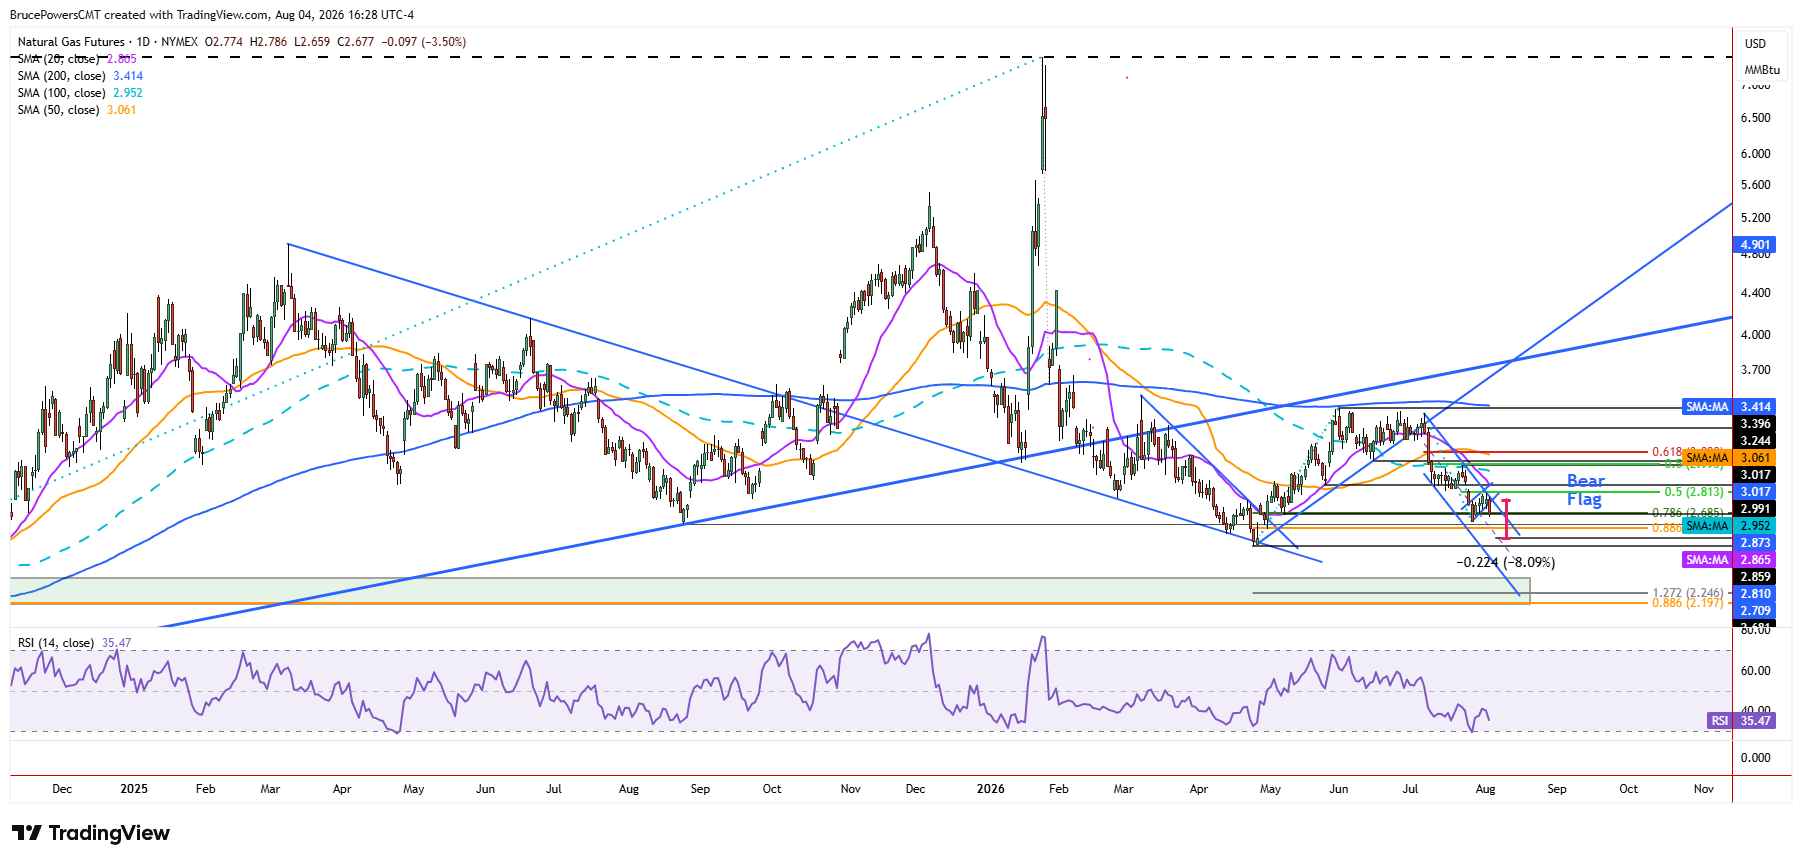
Further weakness first targets the 88.6% Fibonacci retracement of the prior advance near $2.60. However, given the bear flag trigger, the April trend low near $2.50 has a good chance of being challenged as support and possibly broken. A simple measuring objective from the flag pattern suggests a slightly higher initial downside target near $2.54. Given the relatively clear initial downside targets, short-term pullbacks to test resistance will likely lead to further downside while the breakdown remains intact. That is unless Tuesday’s high of $2.79 can be recovered. A move back above $2.79 would therefore weaken the bearish setup and signal that the breakdown may have failed.
A Larger Bearish Structure Remains Intact
The recent lower swing high of $3.40 added to the developing bearish trend structure of a series of lower swing highs and lower swing lows that followed the January peak at $7.44. In February a long-term uptrend line broke as support, and it was confirmed as an area of resistance during the generation of the recent lower swing high. Once prior trend support switches to an area of resistance, the bearish trend is ready to proceed, and it began with the breakdown from an area of dynamic trend support and consolidation. Tuesday’s bearish flag breakdown now provides another confirmation of that larger bearish structure, bringing the focus back to the downside levels identified above.
If you’d like to know more about how to trade natural gas, please visit our educational area.