Friday’s Pause Fails to Change the Trend
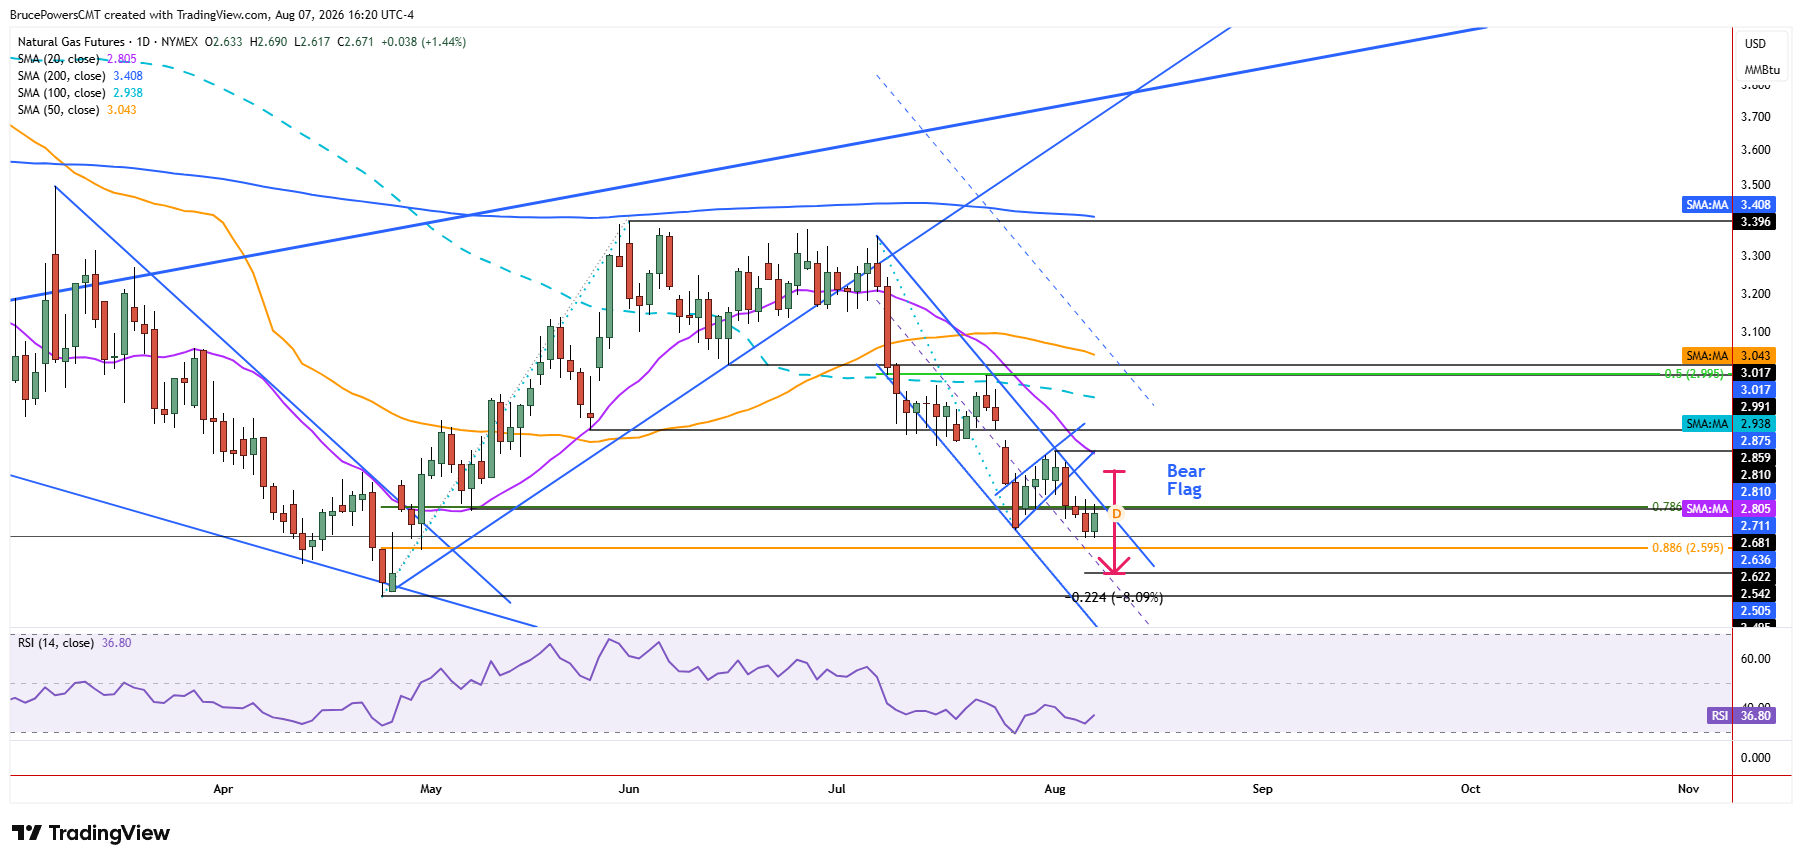
Natural gas took a rest on Friday, trading inside Thursday’s range but set to close in the upper third of the session’s range. A lower daily high on Friday at $2.69 was a successful test of resistance near the 78.6% Fibonacci retracement of the most recent advance, near $2.69. This switch from the Fibonacci level representing an area of support to an area of resistance is another sign of bearish behavior. The day’s low near $2.62 was the second day to test that price area. Not surprisingly, it matches the August 2025 low, which was significant, given that it led to the continuation of the bull trend.
Bearish Momentum Meets Channel Resistance
However, the immediate bearish trend showed further signs of continuation on Tuesday with a breakdown from a bearish flag pattern. That led to additional signs of weakness, with a drop below the prior trend low of $2.64 confirmed by a daily close below that level. The current falling channel shows Friday’s high also testing resistance near the downtrend line at the upper channel boundary. A bearish response from the upper boundary suggests bearish momentum may follow, especially given the steepness of the declining trend.
$2.54 Becomes the Key Downside Level
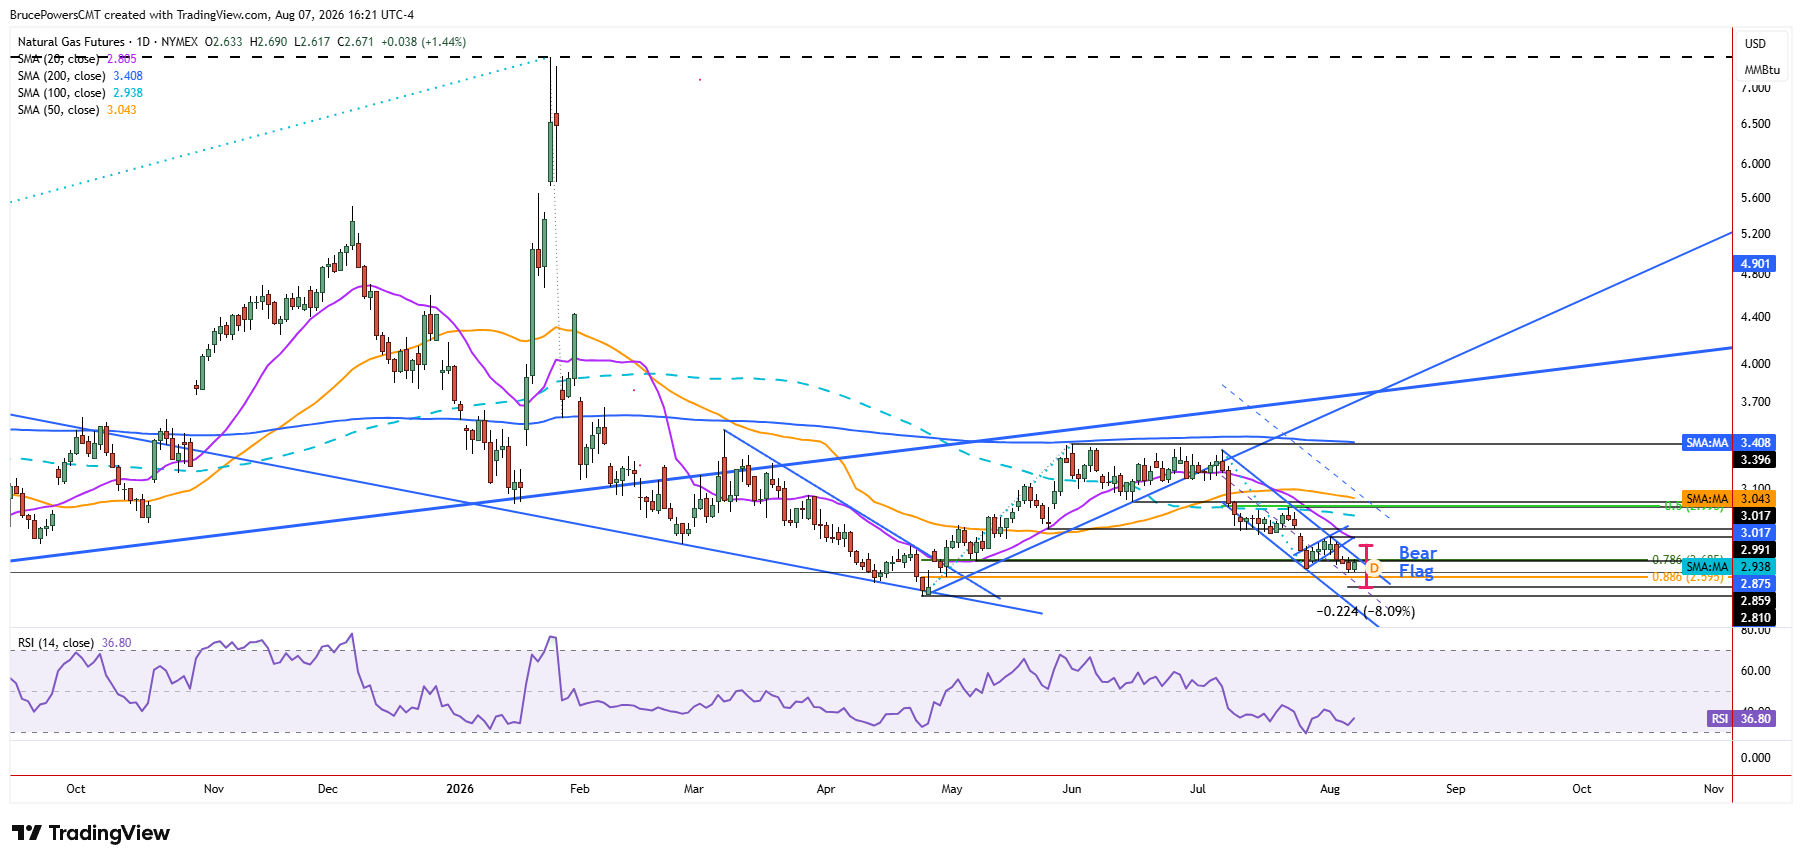
An estimated target derived from measuring the flag pattern points to a potential minimum downside target near $2.54. There is also the midline of the falling channel near that price level currently, providing an alignment of the two technical levels.
Potential Exhaustion Comes Into View
That would present a potentially more significant support zone and could therefore become an important downside target. If reached, the bearish trend would be in an area of potential exhaustion that could lead to support and improving demand.
The 88.6% Fibonacci retracement of the more recent advance is near $2.60, and it further supports the possibility that the decline could be approaching exhaustion in that area. Therefore, while Friday’s pause does not yet signal a reversal, the combination of the falling channel, the $2.54 target, and nearby Fibonacci support suggests that the selling pressure may subside near that price level.
Natural Gas Price Forecast
Every new Natural Gas analysis as it publishes, today's technical signal and key levels, live price — on one page.
See all Natural Gas forecastsIf you’d like to know more about how to trade natural gas, please visit our educational area.