A Bullish Reversal Meets Resistance
Natural gas reached a nine-day high of $2.97 during Thursday’s session before sellers took back control and drove prices sharply lower intraday. At the time of writing, the session low stood at $2.91, with trading still underway. This keeps natural gas in the process of expanding its range and forming a small developing broadening pattern. The day’s high found resistance at the top boundary of the consolidation pattern. In addition, the high was very close to an initial upside target zone defined by a higher swing low from the prior uptrend at $2.98.
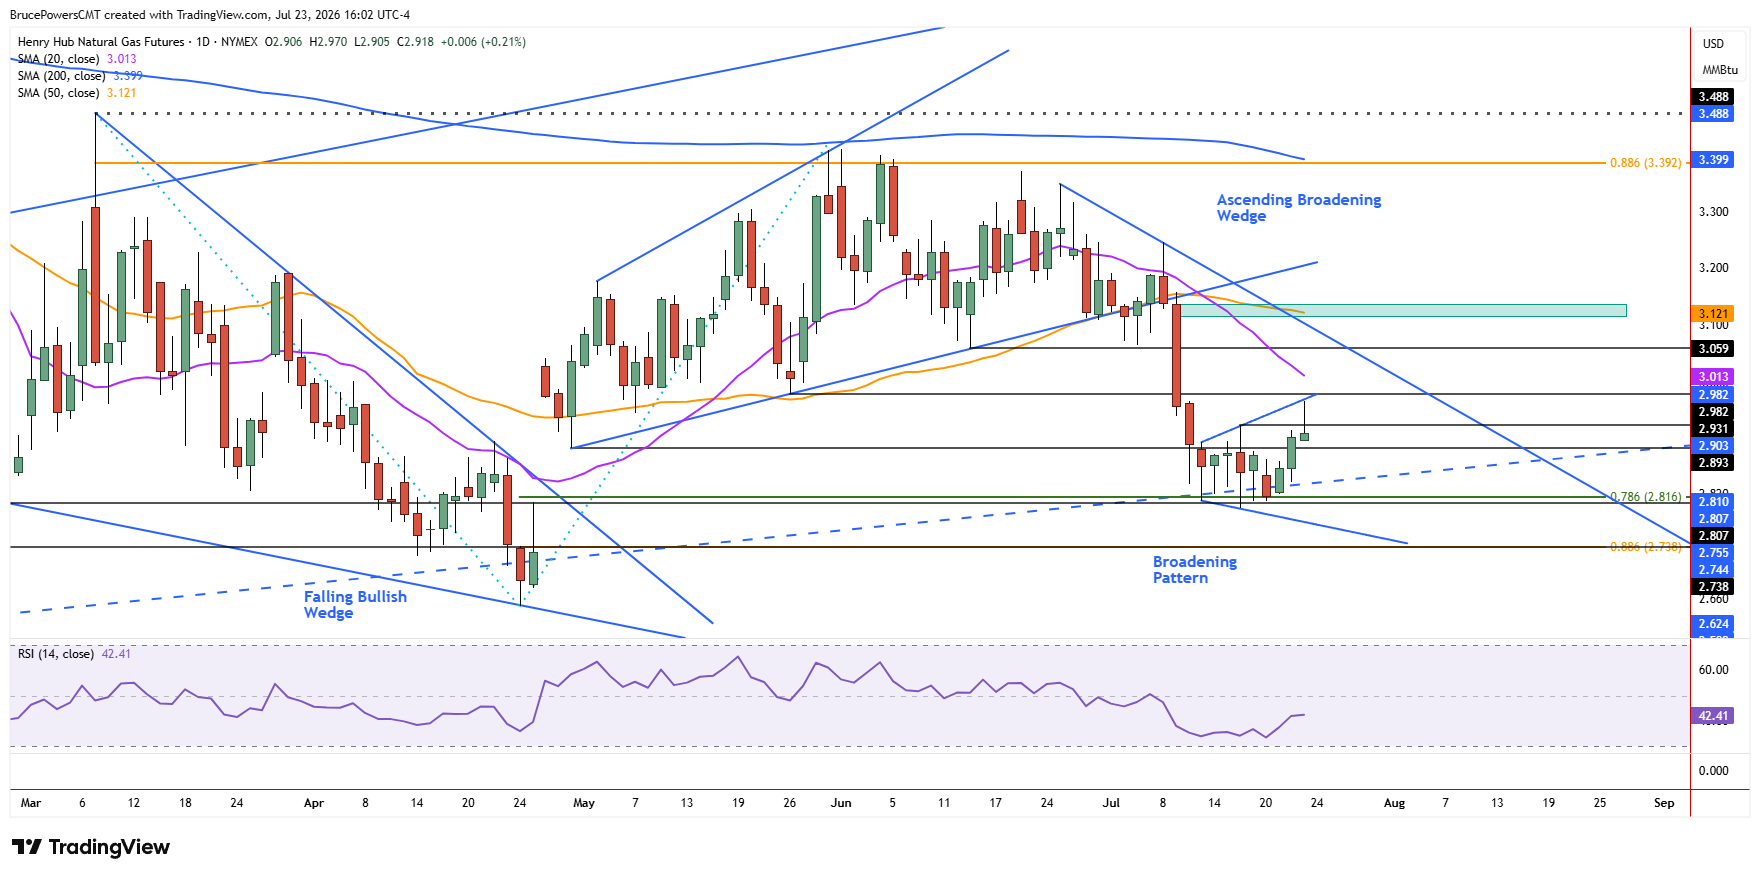
The advance triggered a bullish reversal signal for the prior decline on a move above $2.93. However, the upside breakout needs a daily close above that swing high to confirm. Since resistance has been recognized at the upper boundary of the broadening pattern, downward pressure may resume toward the lower boundary of the pattern and recent trend lows. Unless the upper boundary is recovered quickly, a decisive bearish response from the upper consolidation boundary suggests the likelihood of further consolidation within the pattern’s boundaries.
The Bigger Picture Still Leans Higher
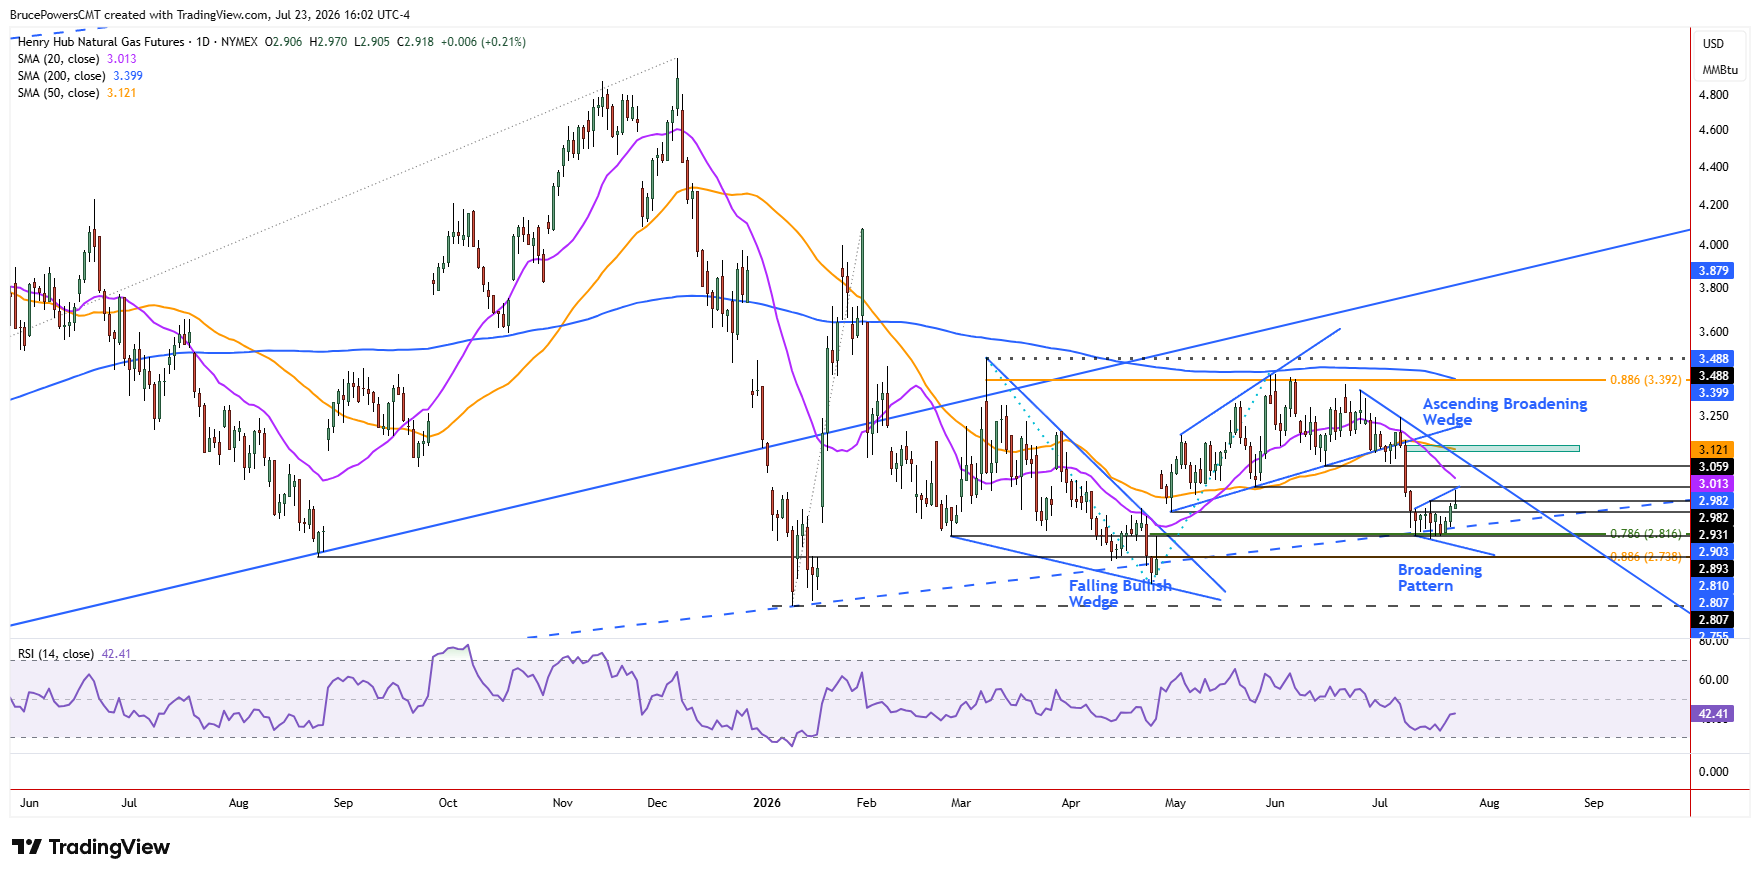
Thursday’s advance also triggered a bullish reversal signal on the larger timeframe, as natural gas rallied above last week’s high of $2.93. This pattern suggests that further upside is likely to eventually follow before this week’s higher low of $2.81 fails as support. The weekly chart shows an initial upside target near the higher swing low at $3.06. Therefore, while near-term resistance remains a concern, the larger timeframe structure continues to leave room for an eventual move higher.
Support Defines the Risk
Short-term support is Thursday’s higher daily low, followed by Wednesday’s low of $2.84. The lower level aligns closely with an uptrend line and the 78.6% Fibonacci retracement at $2.82, while the lower boundary of the broadening pattern is represented by the falling trendline. A break below this support area would increase the risk of a deeper decline and brings the lower boundary of the pattern into play.
The $3.00 Barrier Comes into Focus
Key dynamic resistance is represented by the falling 20-day moving average, now near $3.01. It is also converging with the $2.97 to $2.98 resistance zone, adding to the significance of that zone and potentially reducing the likelihood of a continuation higher. Nonetheless, if support can hold and the 20-day moving average is reclaimed, the 50-day moving average near $3.12 marks an upside target zone, along with the daily high from July 9 at $3.16.
That high is a proxy for the breakdown level from an ascending broadening wedge pattern that triggered to the downside two weeks ago. Therefore, a sustained move above the $2.97 to $3.01 resistance zone would strengthen the bullish reversal setup and open the way toward $3.12 and potentially $3.16, while failure at the zone would leave natural gas vulnerable to a retest of lower support.
Natural Gas Price Forecast
Every new Natural Gas analysis as it publishes, today's technical signal and key levels, live price — on one page.
See all Natural Gas forecastsIf you’d like to know more about how to trade natural gas, please visit our educational area.