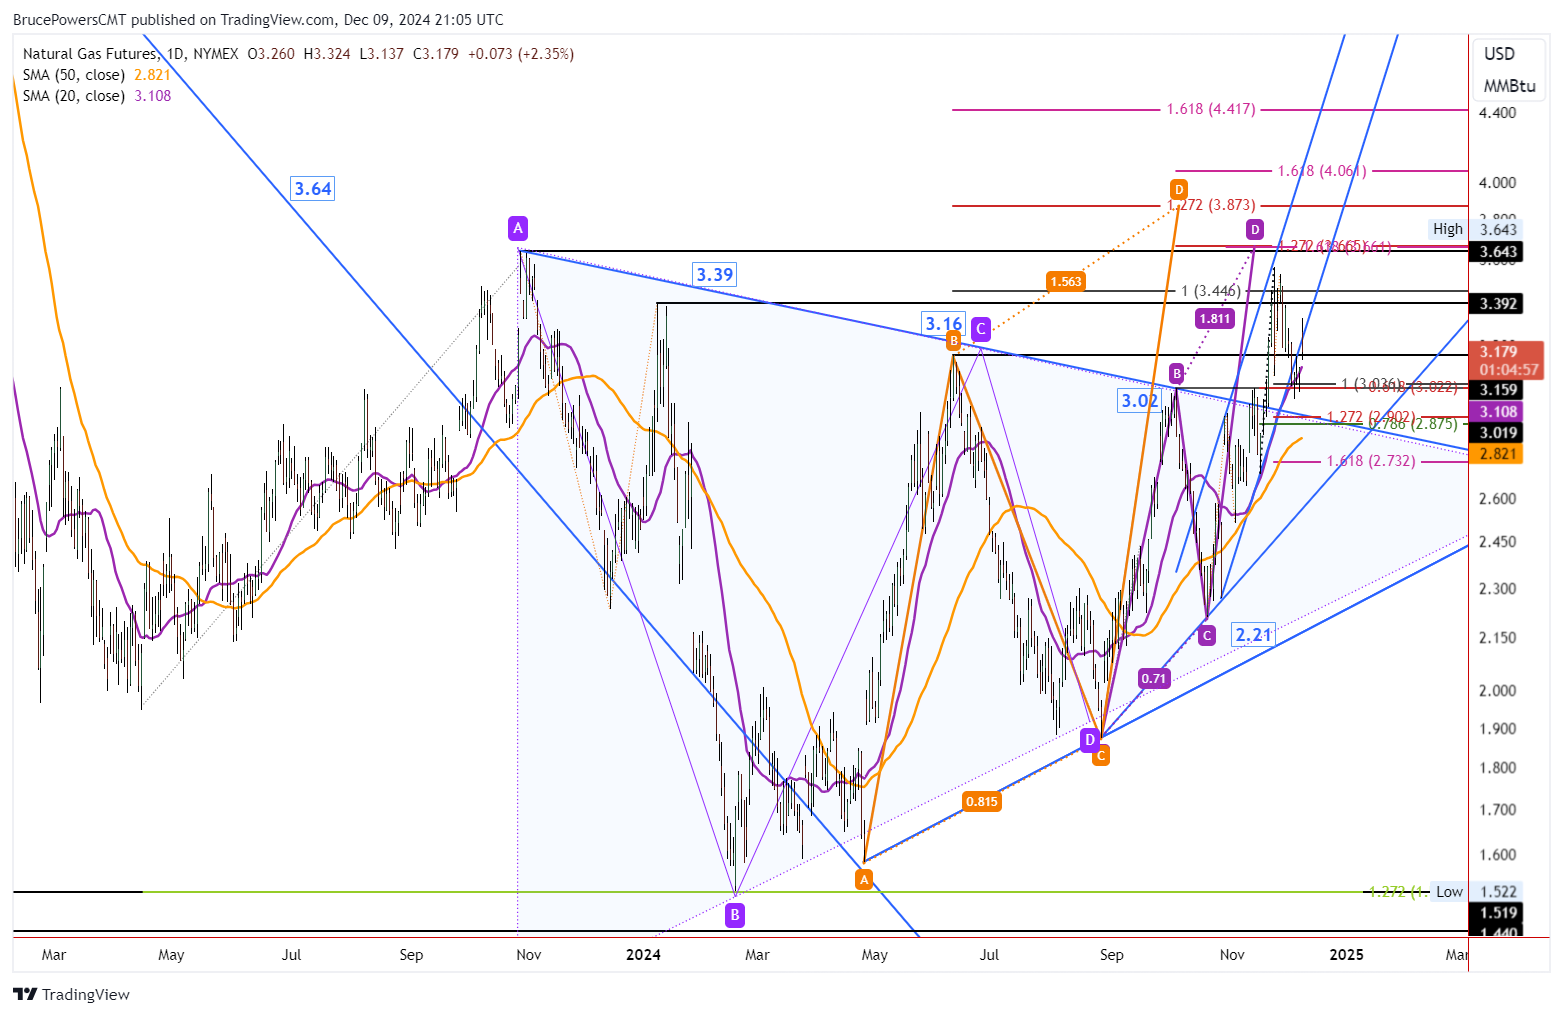
Natural gas triggered a bullish reversal on Monday on a rally above the three-day high of 3.16, before reaching a high for the day at 3.32. An intraday pullback subsequently took the price of natural gas down below the halfway point of the day’s trading range, which is where it remains at the time of this writing.
The advance reclaimed the internal uptrend line, but it doesn’t look like natural gas will finish the day above the line. So, there are bullish signs, but further confirmation of strength is needed to indicate that the retracement is over to the point where the recent highs could be challenged.

Watching for Further Bullish Signs
Further bullish signs may include a daily close above the three-day high, or a daily close above the five-day high of 3.22, and then a daily close above the nearby uptrend line. The uptrend line must be watched visually. Natural gas is rallying following a successful test of support around the breakout area for a symmetrical triangle pattern, which includes a 61.8% Fibonacci retracement.
In other words, it is rising off a logical support zone that could complete the bearish retracement. Also, notice that over the past few days as natural gas was trying to find a bottom it was able to close above the 20-Day MA trend indicator each day.
Trend Support Indicated by 20-Day MA at 3.11
The 20-Day MA is now at 3.11. Along with the internal uptrend line, the 20-Day line provides a dynamic support line for the trend. If support continues to be found at or above the 20-Day MA, the rising trend remains in place. Since a bullish breakout of a symmetrical triangle formation occurred recently, there is the potential for a new upswing for the developing bull trend. Following the initial breakout, above 3.02, natural gas was able to sustain strength and reclaim prior swing highs at 3.16 and 3.39. This is bullish behavior that should return to the market for natural gas once the correction is complete.
Weekly Bullish Reversal Also Triggered
There was also a bullish reversal that triggered today on the weekly chart as last week’s high of 3.28 was exceeded to the upside. Therefore, the high provide another key near-term pivot to keep an eye on. A daily close above that level would provide another sign of strengthening.
Natural Gas Price Forecast
Every new Natural Gas analysis as it publishes, today's technical signal and key levels, live price — on one page.
See all Natural Gas forecastsFor a look at all of today’s economic events, check out our economic calendar.