Natural Gas Breaks Higher as Support Holds
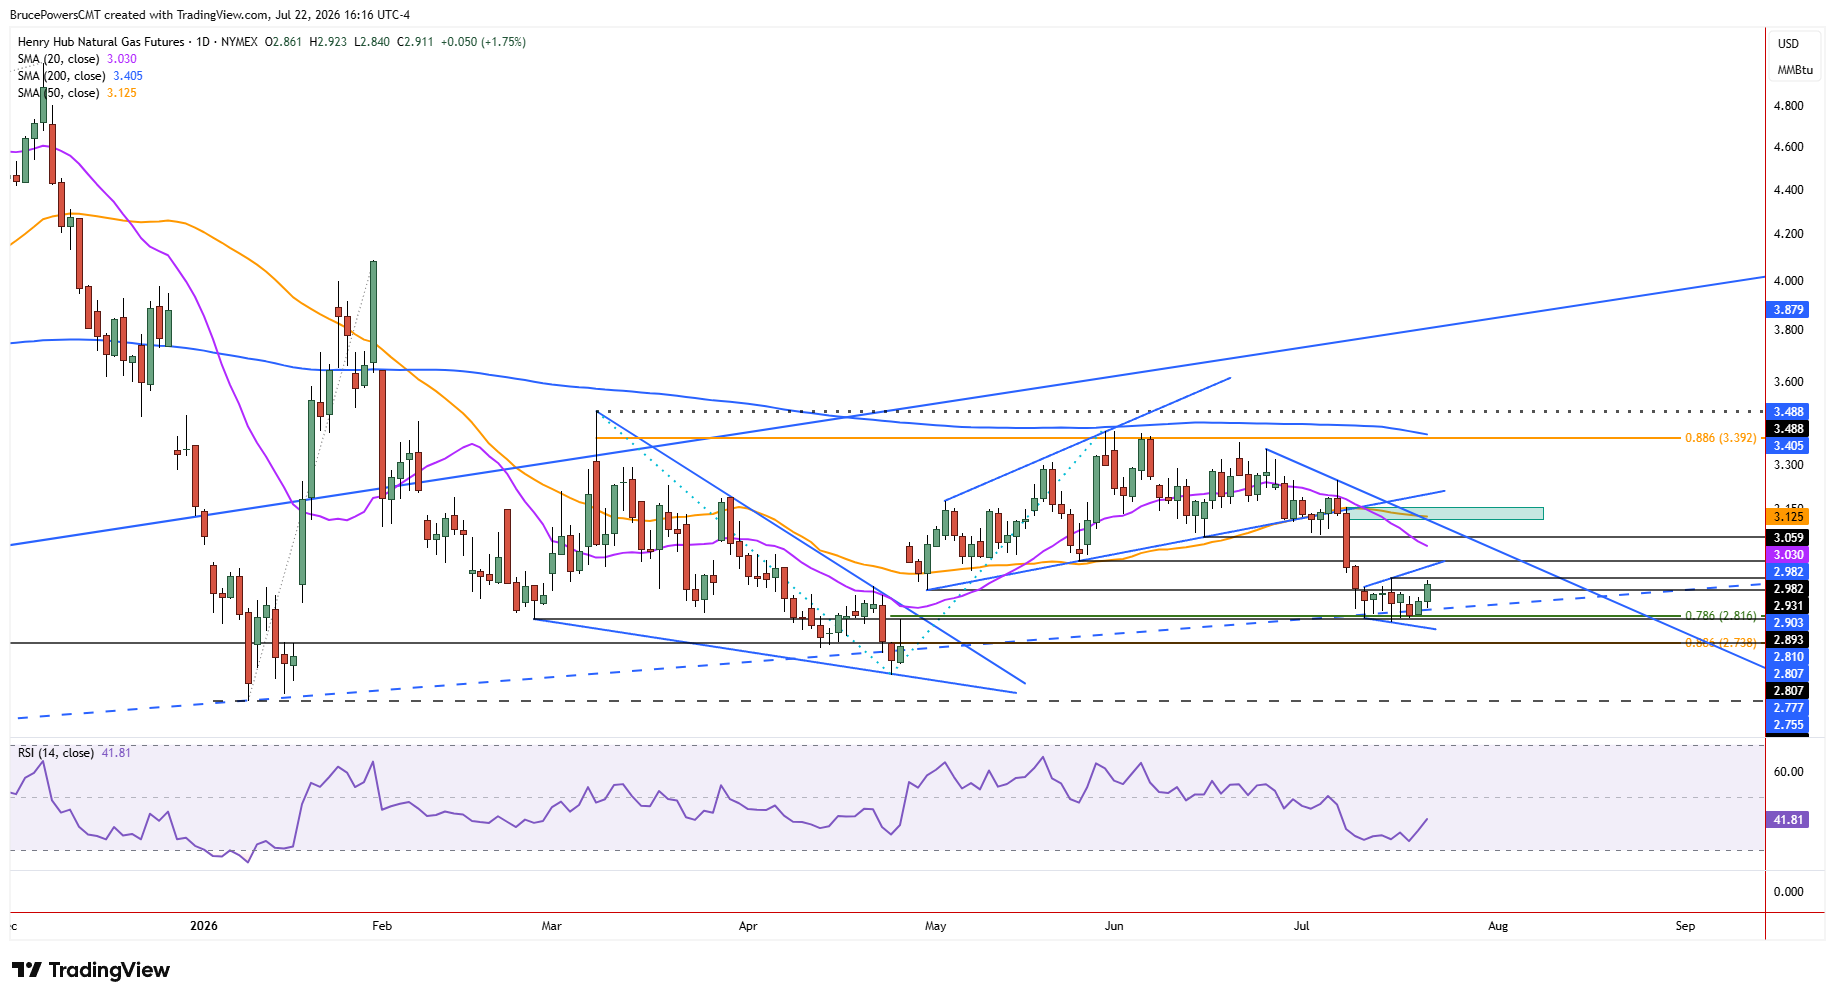
Natural gas advanced to a four-day high of $2.92 during Wednesday’s session. This was the second highest traded price in eight days. The three-day range breakout followed several days of relatively consistent testing of the current support zone, as downward pressure remained during the formation of a small broadening pattern, with the upper and lower boundary lines moving away from each other. The pattern reflects consolidation with the price range expanding rather than compressing, which is less a common form of consolidation that can produce more volatile price action.

A Broadening Pattern Raises the Stakes
Nonetheless, the broadening pattern is newly formed, and it may or may not continue to influence price action. If it does, then an upside or downside breakout could fail to follow through and quickly swing back in the other direction. That possibility makes confirmation of any breakout particularly important.
Early Signs Buyers Are Regaining Control
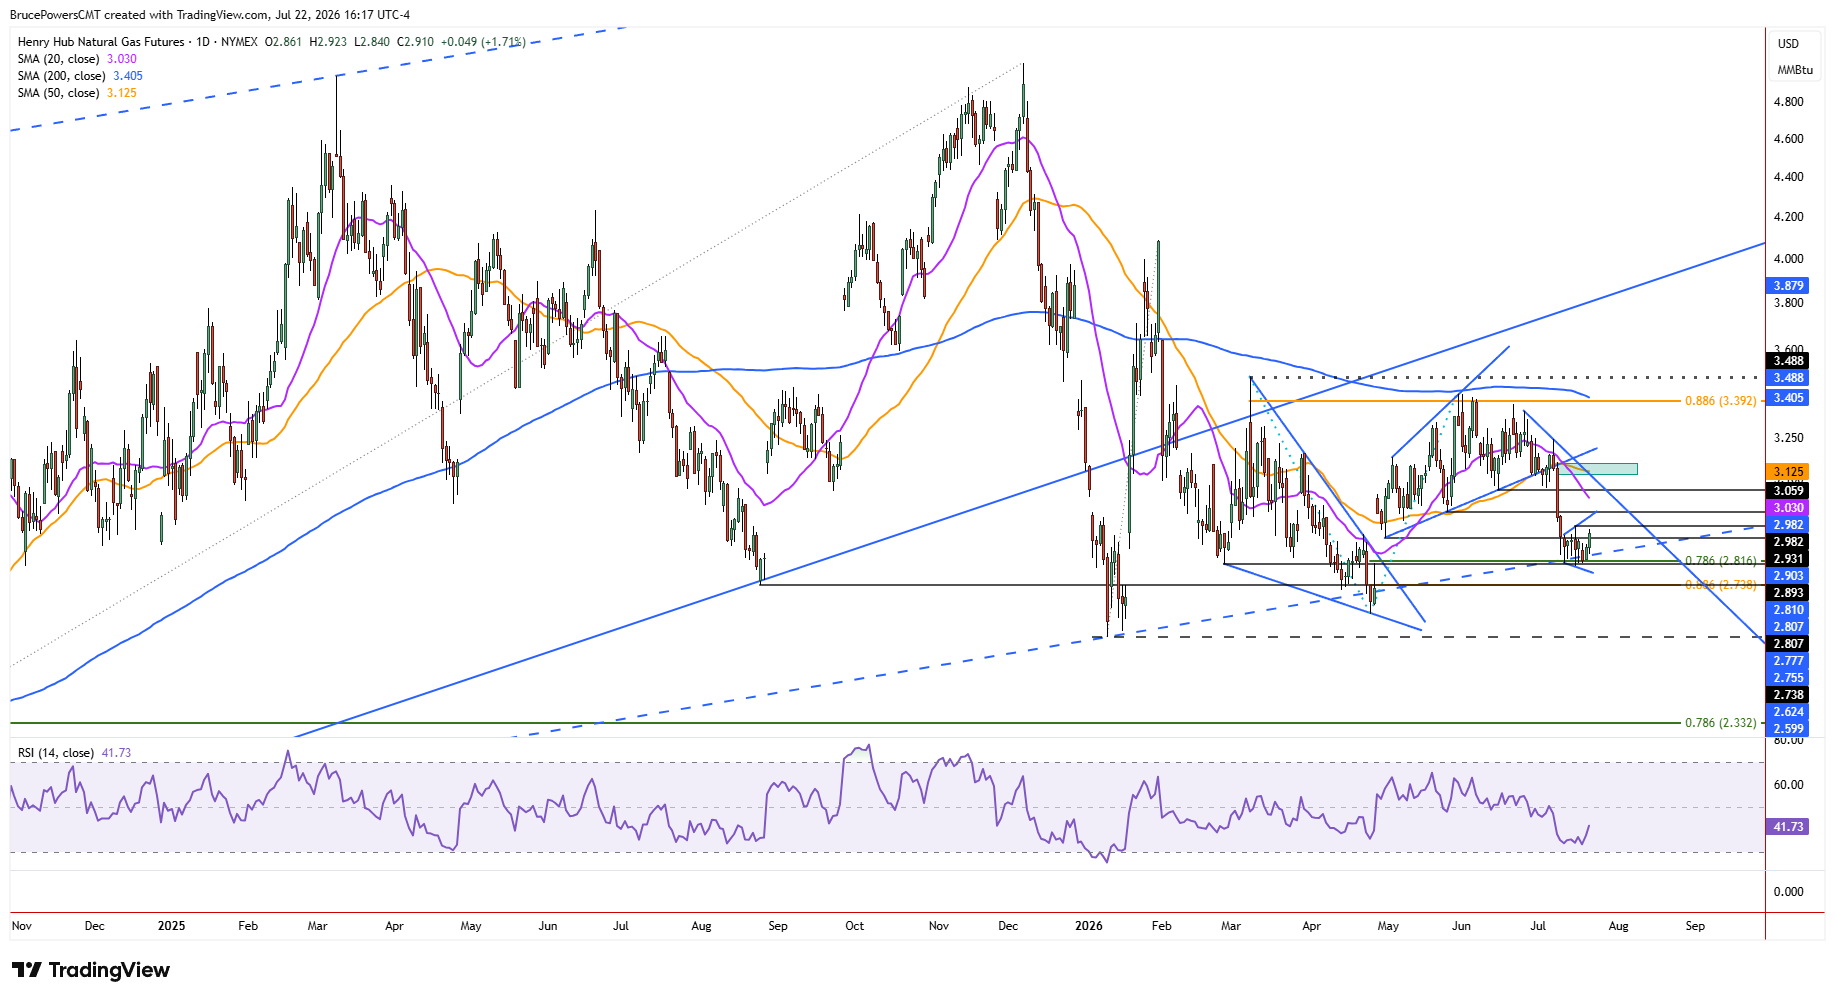
When considering the broader trend structure, Wednesday’s bullish price action shows strengthening short-term momentum after the failure to break below support at the confluence of several indicators. This may be an initial sign that buyers are starting to take back control and could be the early stage of strength needed to test key upside targets. The move also gives the recent support test greater significance, as a sustained rebound would help confirm that sellers failed to gain downside momentum.
The $2.93 Breakout to Watch
A decisive advance above Wednesday’s high will signal a continuation of momentum toward the first upside target at the recent lower swing high of $2.93. If natural gas can break above that level, a bullish reversal signal from the prior decline will trigger. That lower swing high is also last week’s high, and a breakout above it will signal a weekly reversal of the recent decline. Given the greater significance of the higher time frame price pattern, a confirmed breakout could increase the likelihood that upside targets would be reached.
Higher Targets Come Into Focus
The next upside target near the lower swing high of $2.98 would then look like the minimum objective at that point. Since the 20-day moving average is falling, it may be at or near that level by the time price reaches it. That would add to the significance of the resulting resistance zone and cold make the $2.98 area more challenging to overcome.
Natural Gas Price Forecast
Every new Natural Gas analysis as it publishes, today's technical signal and key levels, live price — on one page.
See all Natural Gas forecastsThe 20-Day Moving Average Holds the Key
However, the 50-day moving average was key trend support during the prior advance, and a full pullback to test it as a resistance area would complete the cycle. That average is currently near $3.13. Therefore, the ability to reclaim and hold above the falling 20-day moving average will be an important test of whether the recent support defense can develop into a more meaningful bullish reversal. Conversely, a failure to reclaim the 20-day moving average would confirm underlying selling pressure and increase the risk that the recent support test was only temporary.
If you’d like to know more about how to trade natural gas, please visit our educational area.