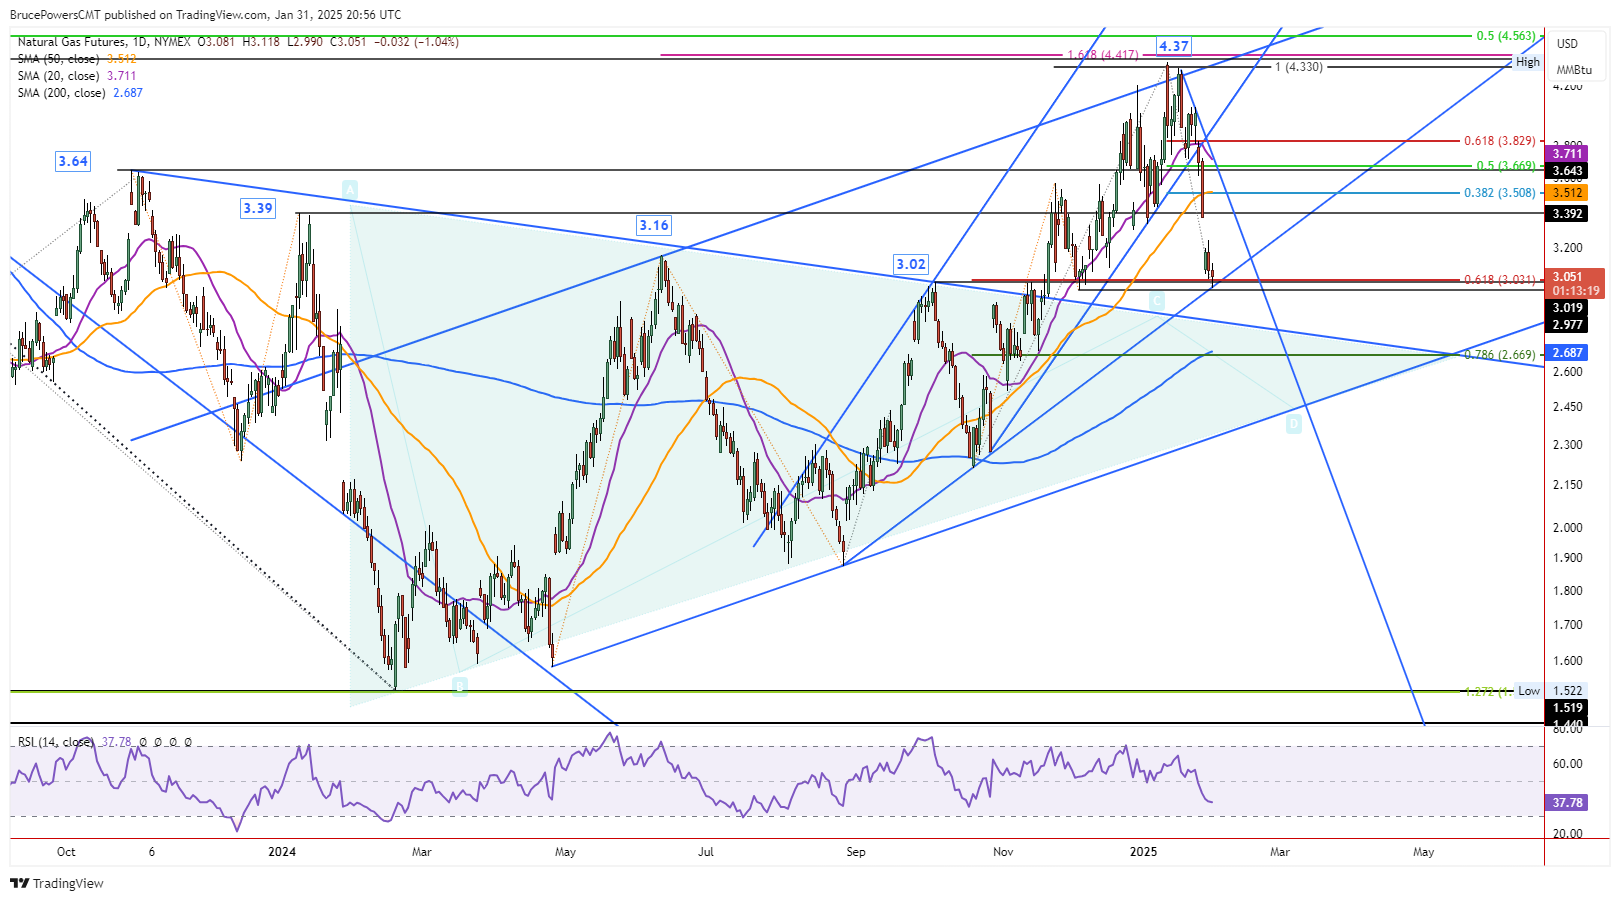
Natural gas further tested a potential support zone on Friday with a drop to a new retracement low price of 2.99. Support for the day was seen at a rising trendline and within the area of the 61.8% Fibonacci retracement. The support zone also includes a prior swing high at 3.02.
A breakout above that swing high in November triggered a breakout of a large symmetrical triangle consolidation pattern. Given the subsequent bullish reaction, the market seemed to recognize that breakout. Friday’s high was 3.12 and natural gas continues to trade in the top half of the day’s price range and above the prior retracement low at 3.035, at the time of this writing.

Breakout Above Friday’s High is a Sign of Strength
Depending on where it closes the day, today’s price action might result in a bullish hammer candlestick pattern. If it does, a breakout above Friday’s high of 3.12 will show strength and a one-day bullish reversal from a key long-term support zone. Whether strength continues from there remains to be seen.
Further testing of the support zone may also occur before bullish follow through. Upside price targets for a bullish reversal, if it is sustained, start with the completion of a gap at a daily low of 3.36 and a prior swing high at 3.39. Notice that there are two metrics pointing to a similar price area thereby increasing the potential significance of that price zone.
Key Upside Target Around 50-Day MA
Since the 50-Day MA was busted on the way down earlier this week, it seems likely to be tested as resistance on the way back up. And the 50-Day line is joined by the 38.2% Fibonacci retracement. Together, they identify a potential resistance zone around 3.51. Next up, there is a potentially more significance resistance zone from 3.64 to 3.71.
The range begins with a prior swing high and top of the symmetrical triangle bottom at 3.64. Included within the range is the 50% retracement at 3.67. Finally, it ends with the 20-Day MA, which is currently at 3.71. Note that the 20-Day line is falling and getting closer to the 50% retracement. A declining trendline showing dynamic resistance of the current bearish correction has been added to the chart as a guide.
Natural Gas Price Forecast
Every new Natural Gas analysis as it publishes, today's technical signal and key levels, live price — on one page.
See all Natural Gas forecastsFor a look at all of today’s economic events, check out our economic calendar.