Resistance Halts Triangle Breakout
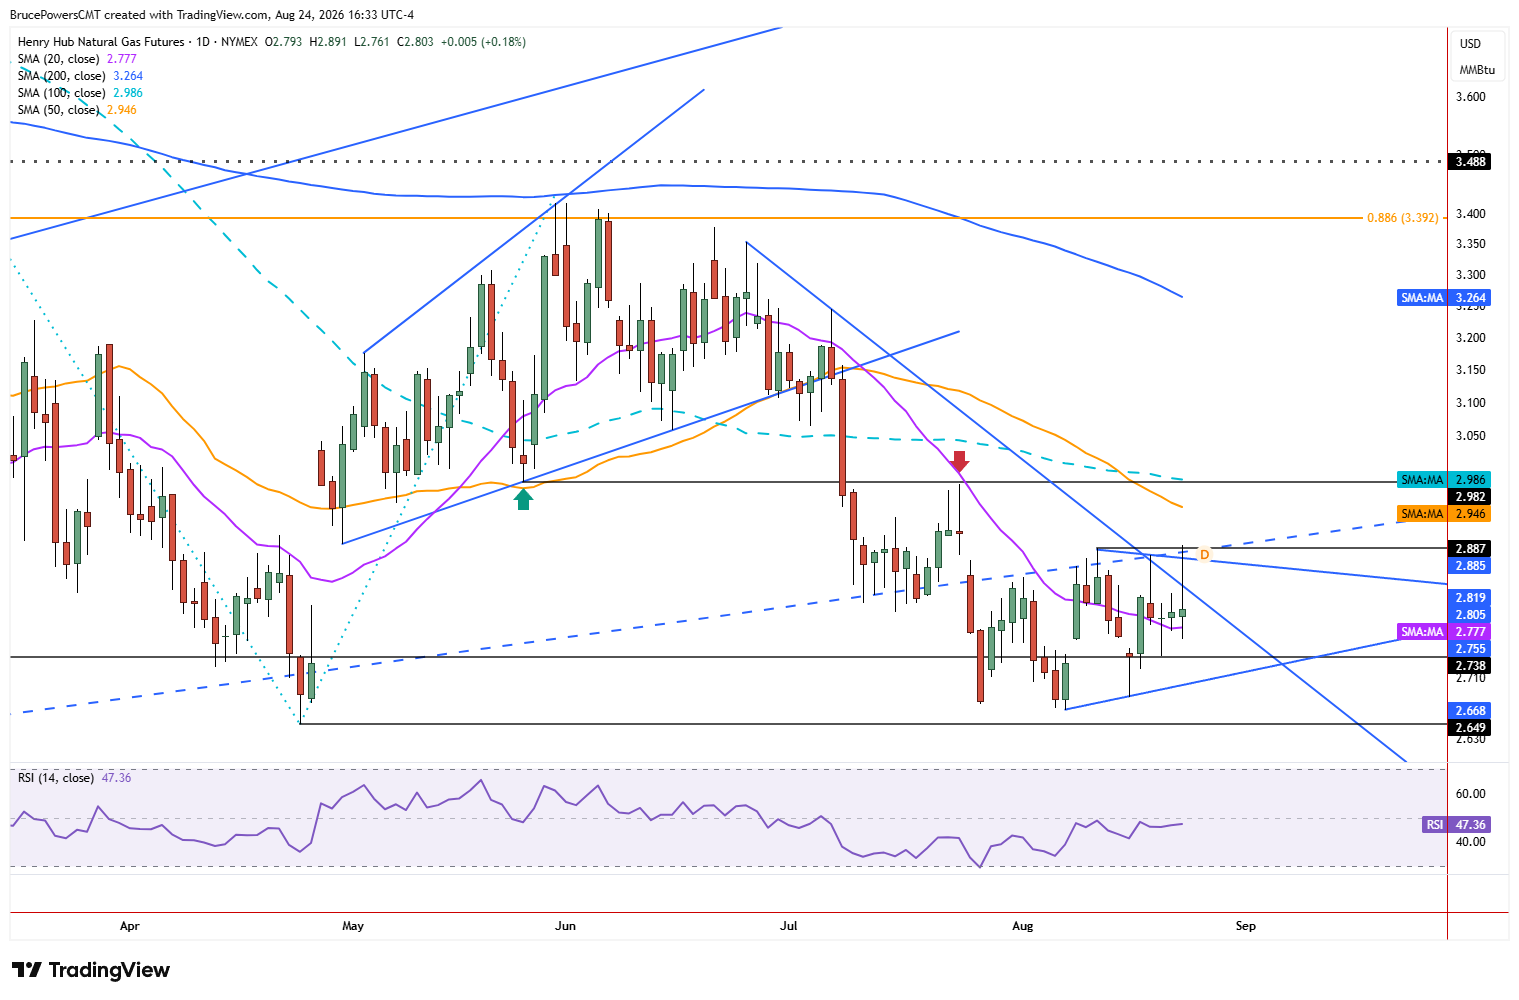
Natural gas tested the upper boundary of a consolidation range on Monday, which is now entering its third week. Short-term bullish signals included an initial breakout signal for a symmetrical triangle pattern and the recovery of the downtrend line. The five-week high of $2.89 was tested and resistance held. Following the day’s high sellers quickly took control and drove price down to the lower half of the day’s range, at the time of writing. Notably, resistance for the day was seen at the convergence of the downtrend line and uptrend line (dashed).

Falling 50-Day Average Adds Pressure
The uptrend line was recognized as support for several weeks in July before a sustained decline below it occurred. Today’s price action confirmed resistance near levels that suggest downward pressure remains dominant. As the falling 50-day moving average at $2.95 approaches, additional selling pressure gets closer to current levels. This could lead to the catalyst that initiates a breakout of consolidation.
What Would Change Bearish Outlook?
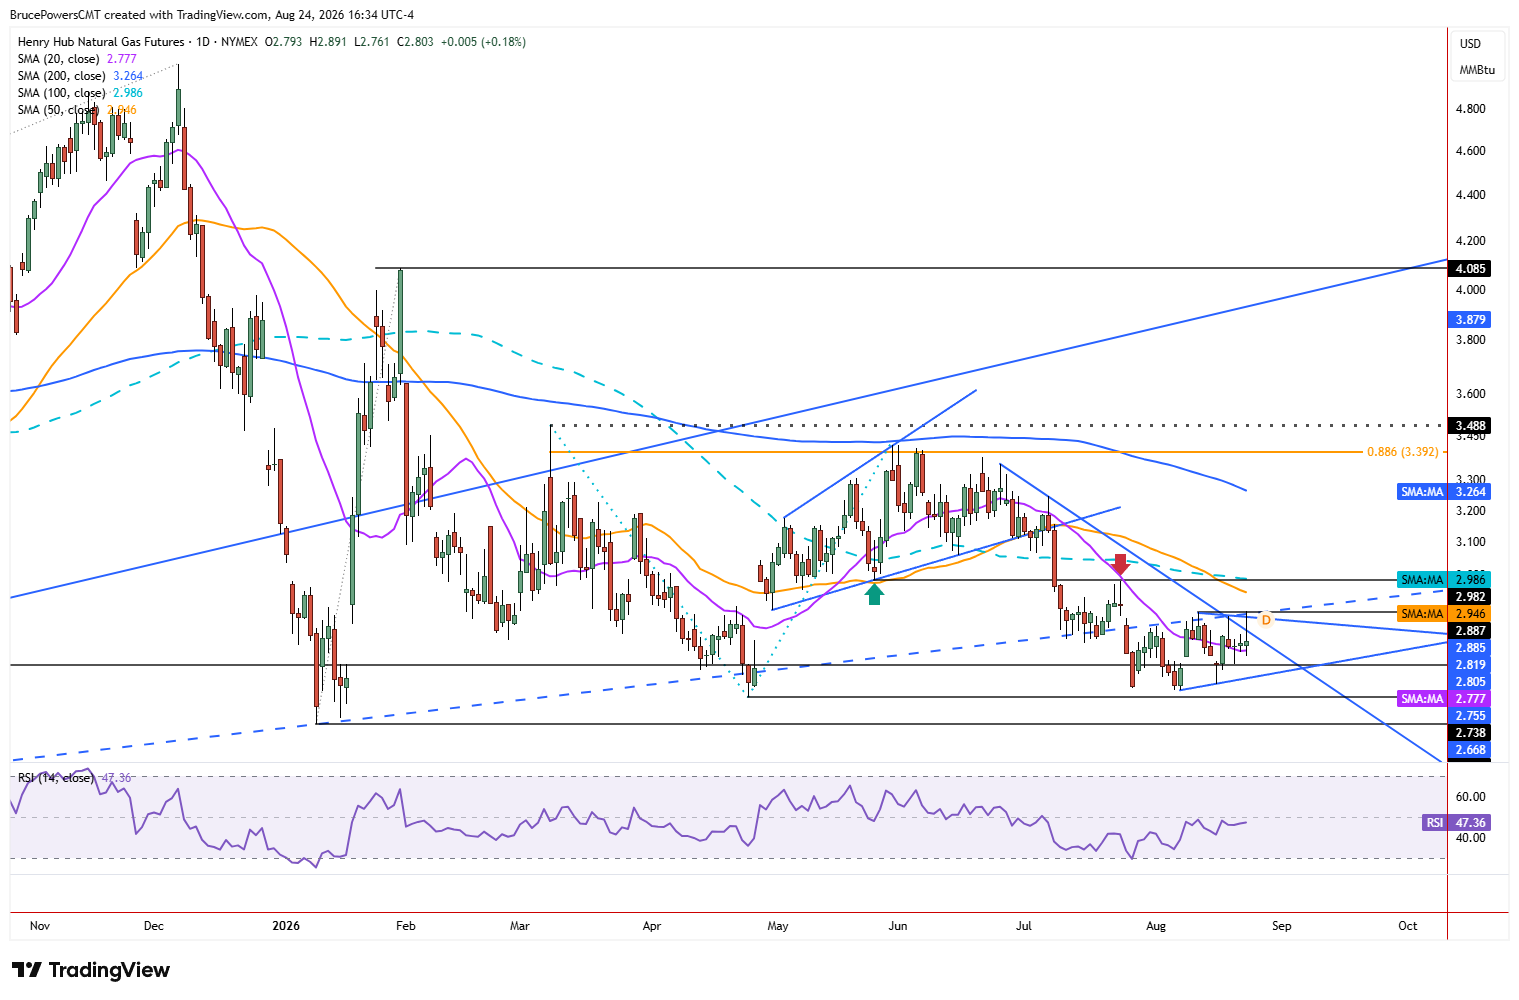
Price behavior suggests a continuation of the bearish trend until there is evidence to the contrary. That wouldn’t occur unless there was a sustained reclaim of the 50-day moving average. Since that average may be at or near Monday’s high before an upside breakout is attempted, it may have greater significance. The breakout of consolidation, along with the reclaim of a key moving average, would suggest that an advance from there may have greater success than if that 50-day moving average was approached.
Above the 50-day moving average is a lower swing high of $2.98, a key resistance area from structure. It is supported as resistance by a higher swing low from May. That wouldn’t change the overall bearish technical outlook represented in the larger bearish structure. In that case, the current developing symmetrical triangle pattern could be interpreted as a bearish pennant, could add to momentum if a breakdown below last week’s low of $2.69 occurs.
If you’d like to know more about how to trade natural gas, please visit our educational area.