Multi-Year Breakout Gets Confirmation
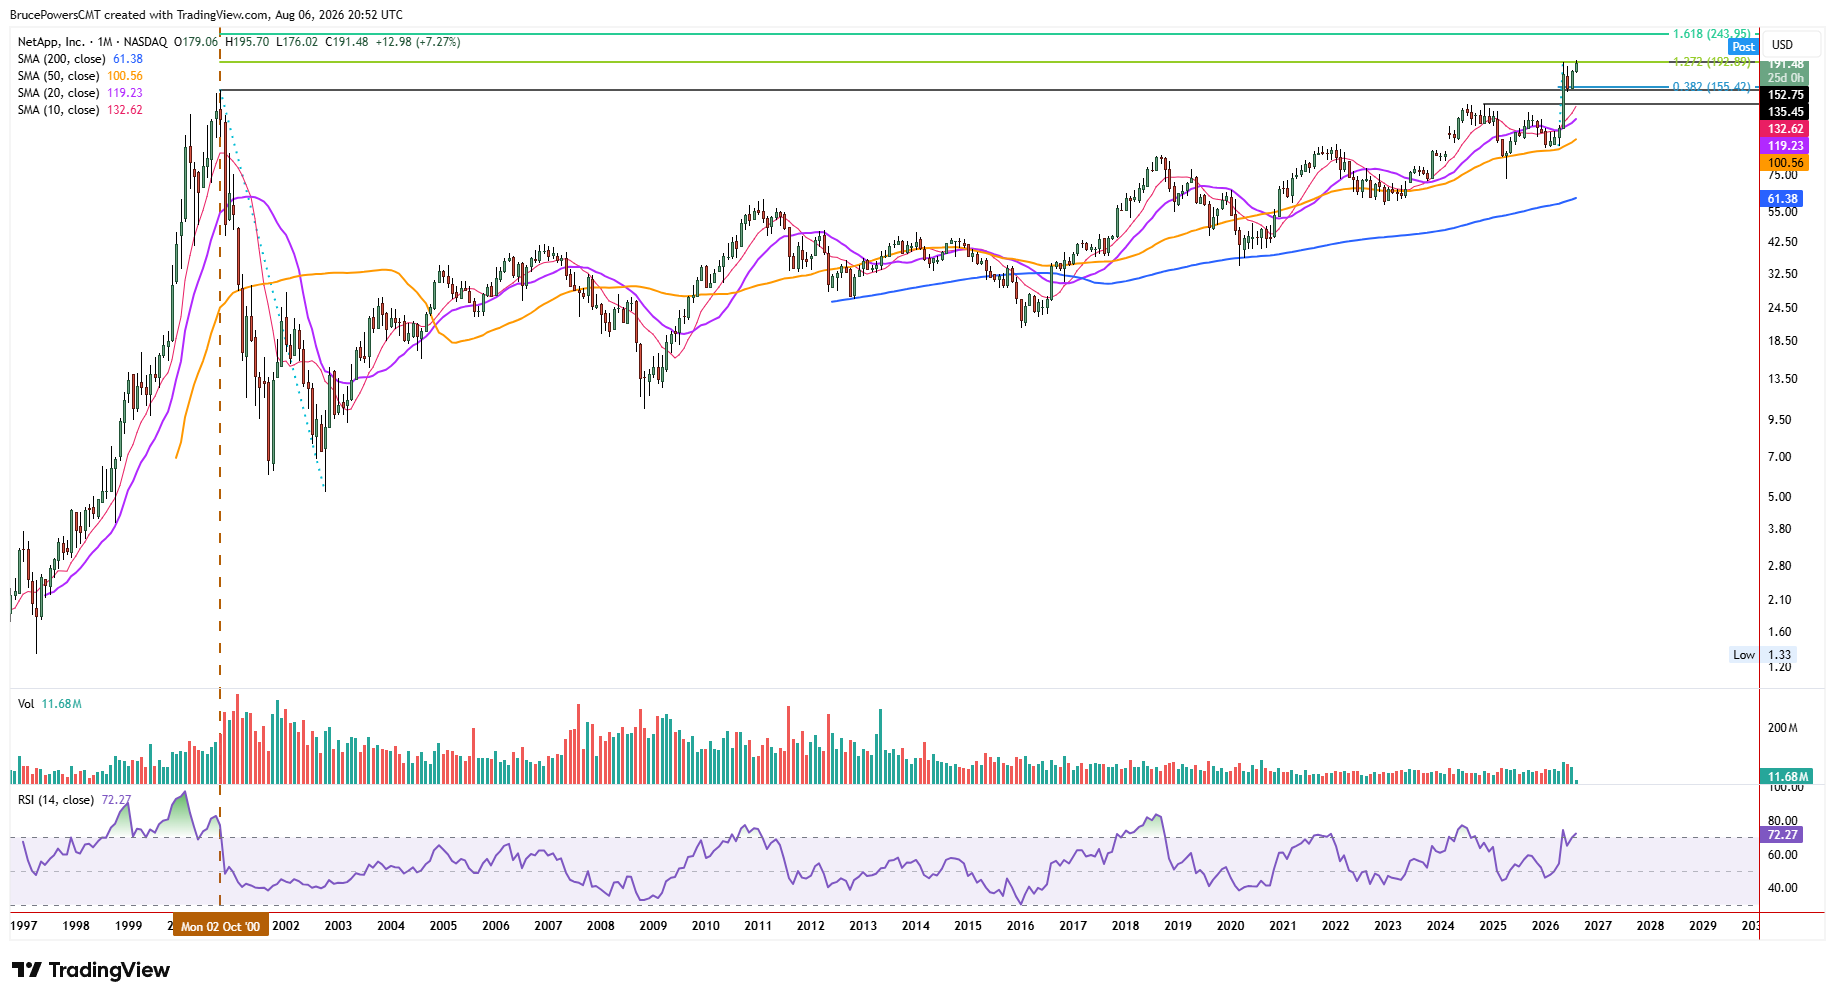
NetApp, Inc. (NTAP) stock broke out of a multi-year basing pattern above the 2000 peak of $152.75 in May, with a sharp advance that reached a high of $192.83 before a pullback unfolded. The strong bullish signal followed the data infrastructure company’s Q4 fiscal 2026 financial results. That first pullback after a significant breakout completed a 38.2% Fibonacci retracement of the prior upswing before establishing a higher swing low at $149.27. It was also a successful test of support near the prior high and former resistance at $152.75. Subsequently, a new trend high breakout triggered on Tuesday, with NTAP reaching $195.70.

Demand Builds Beneath the New High
Since NTAP has broken out of a long-term basing pattern, it is showing signs of entering a new leg higher within its long-term rising trend. The relatively shallow pullback after the initial new high and support near a previously significant resistance zone show strengthening underlying demand and the potential for a new leg up in NTAP. Although NTAP is short-term extended, the long-term bullish technical signs suggest that it deserves to be watched as new setups may develop. Investors should also be aware that the company is scheduled to report first-quarter fiscal 2027 earnings on September 2.
Fibonacci Opens a Higher Target
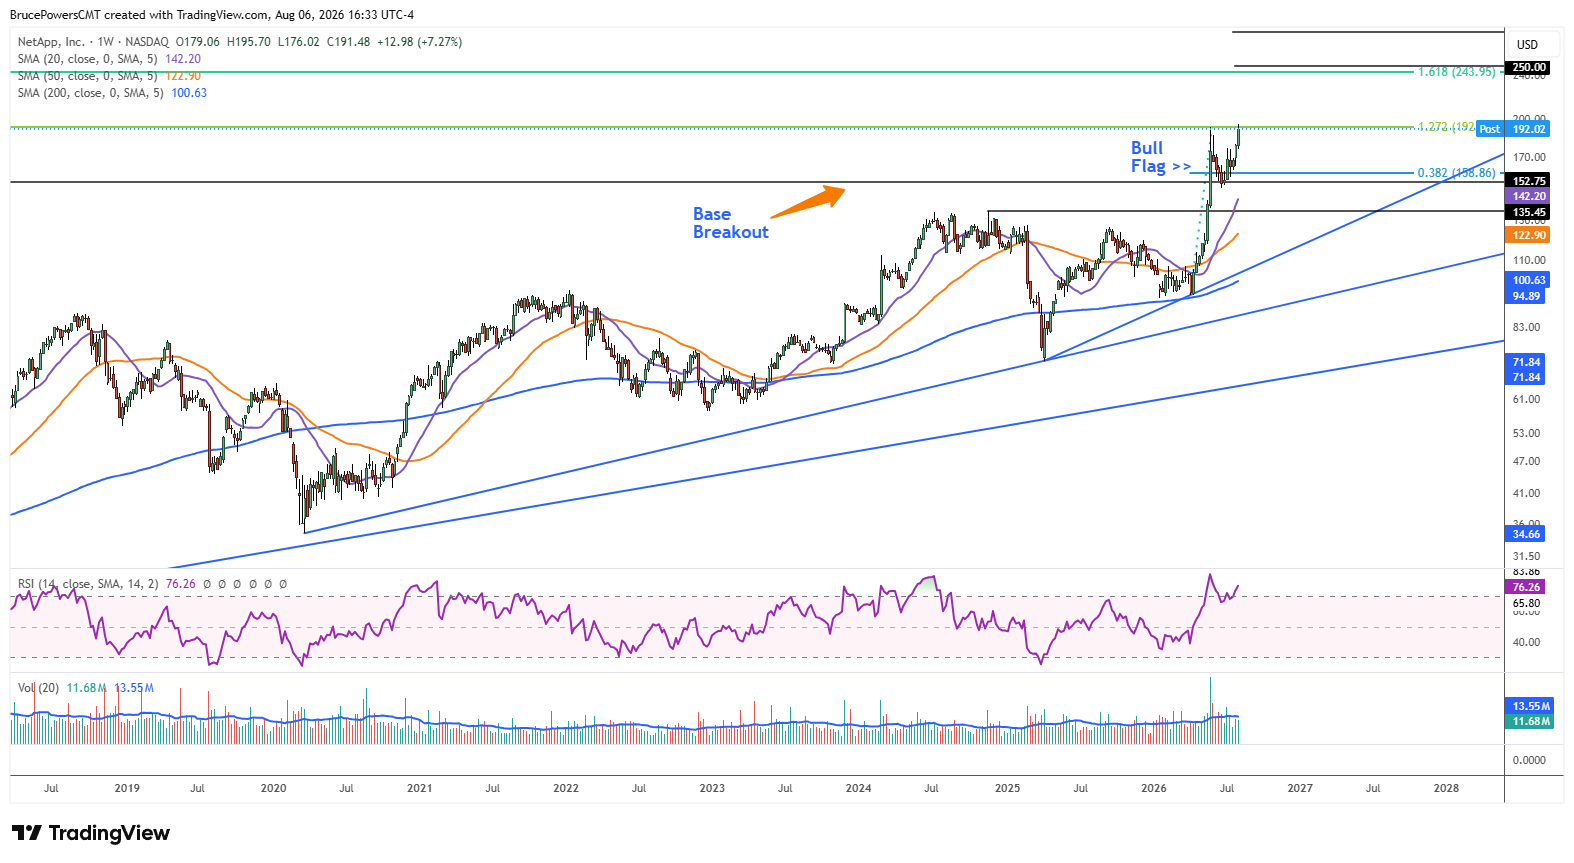
The May high in NTAP completed a 127.2% Fibonacci extension of the long-term bearish correction that followed the 2000 peak. With that Fibonacci level having been reached, the 161.8% Fibonacci extension of that same correction becomes an upside target at $243.95. These levels represent potential targets derived from the basing pattern.
Bull Flag Adds Fuel to the Upside Case
There is also a daily bull flag that triggered to the upside four weeks ago. It was preceded by a sharp 79.5% advance, which established the pole portion of the flag pattern. Adding that distance to the flag signal produces an estimated target near $288.00. However, when using the actual price distance rather than the percentage change, the measured target drops to $250.00.
Since that level is near the 161.8% Fibonacci target, the $243.95 to $250.00 price range takes on greater significance, increasing the potential for that zone to eventually be reached. Together, the basing pattern and bull flag point toward a potentially significant upside extension following NTAP’s long-term breakout.