Nvidia Technical Analysis
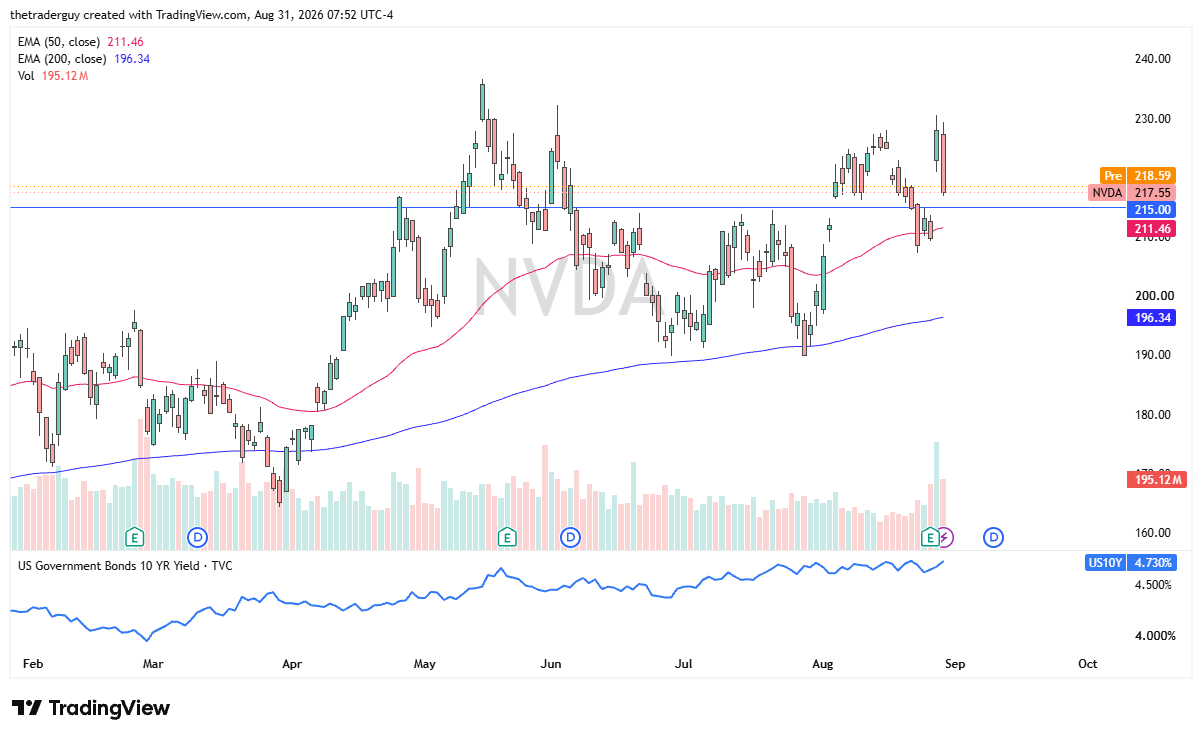
Nvidia looks like it’s going to start to try to recover as we are up a little bit in pre-market trading on Monday after that horrific candlestick that was printed on Friday, as Kevin Warsh suggested that interest rate cuts are not happening, and in fact, interest rate hikes could still be on the table.
That being said, this is a market that is still pretty hot, and therefore it looks as if there are some value hunters out there early in pre-market trading willing to take advantage of this.
Whether or not that works out remains to be seen, it’s worth noting that the gap has been about half filled from a couple of days ago from the earnings call.
So, we’ll see. It’s a market that, if overall risk appetite comes back, a lot of times people like Nvidia for that reason alone.

Apple Technical Analysis
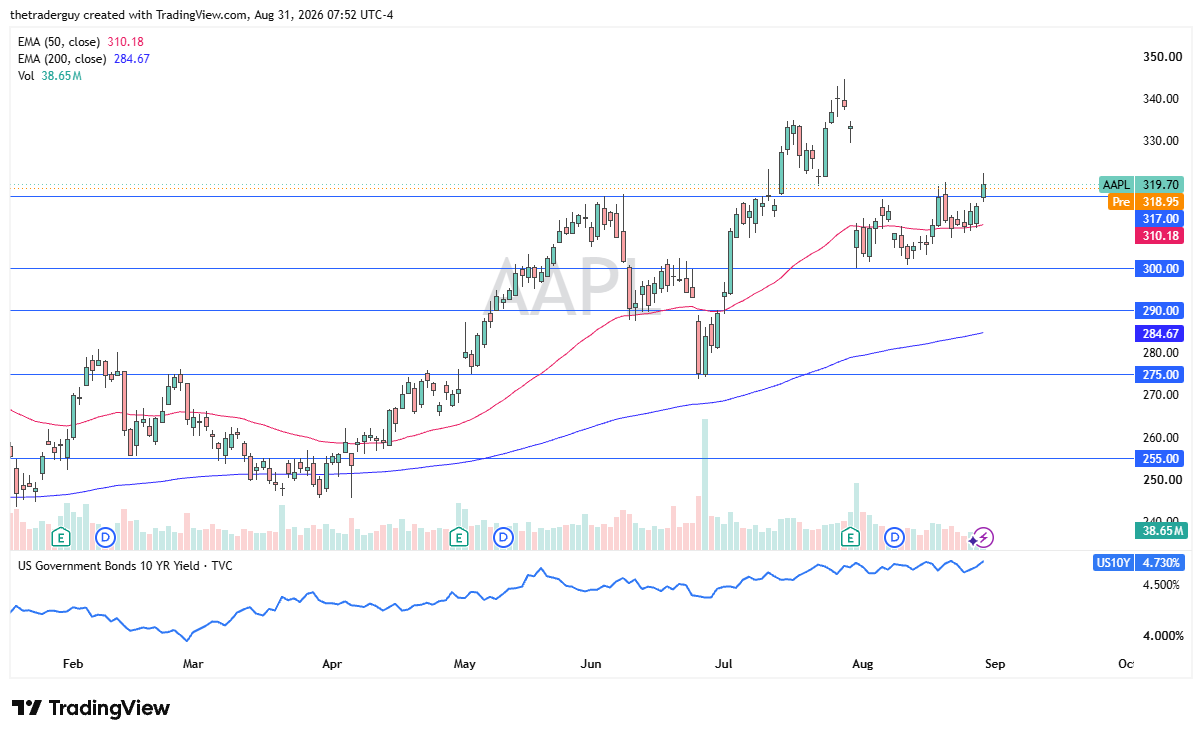
Apple looks like it’s going to be ever so slightly down, but unlike Nvidia, it held up pretty well on Friday. That being said, it sold off viciously during its earnings call, but since then has been grinding higher.
I still like this stock; I just think it’s got some work to do in the AI sphere of influence. When AI is bad, it typically seems to do better almost in an ironic sense because Apple tends to be behind when it comes to artificial intelligence.
So, we’ll see. Interest rates are still elevated, but Apple looks like it’s going to grind itself higher over the longer term based on the technical setup that we see, and buyers certainly seem to be willing to step in and buy dips.
Super Micro Computer Technical Analysis
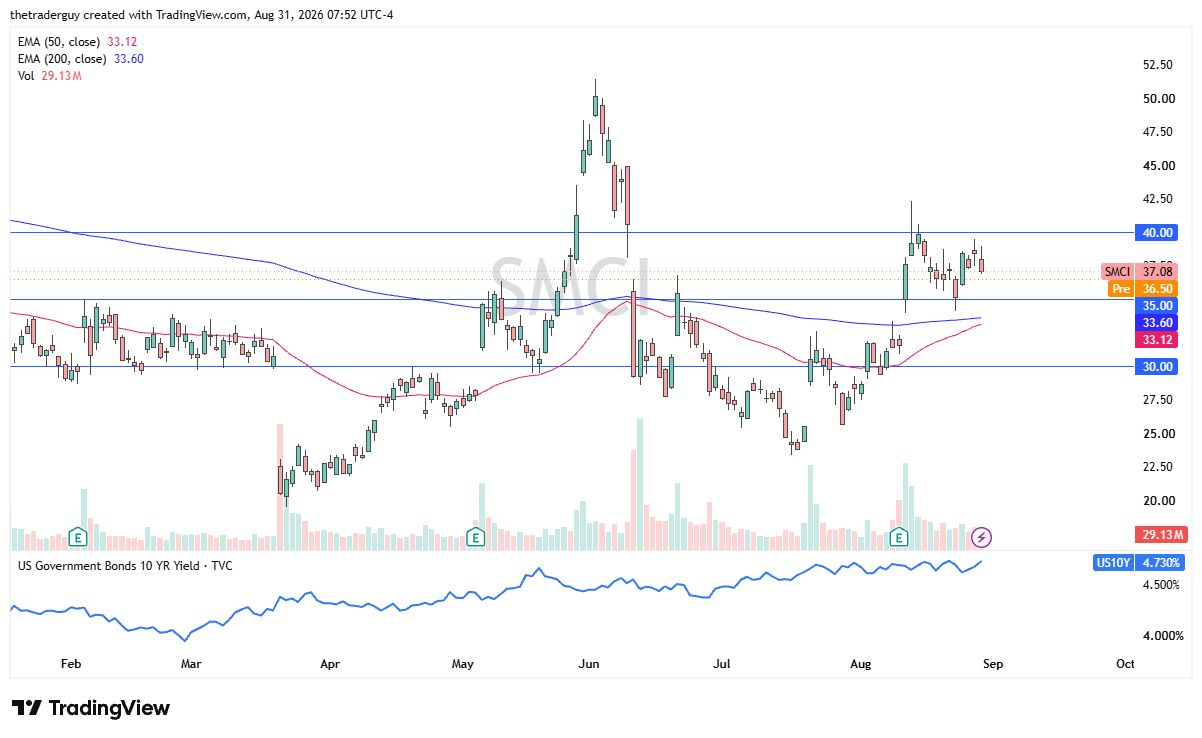
The market for Super Micro Computer is a little bit negative in pre-market trading. The $35 level below is an area that’s been supported previously.
The 50-day EMA looks as if it’s getting ready to cross above the 200-day EMA, kicking off the so-called golden cross, something technical traders will be paying attention to.
$40 above looks to be resistance, so that’s an area that I think could be interesting to watch as well.
Ultimately, this is a market that looks like it’s still very much in a range but had been bullish previously. As the old adage goes, consolidation quite often leads to continuation.
If you’d like to know more about technical analysis and how traders use it, please visit our educational area.